What do we need to be happy? evidence from a psychosocial perspective
Su Yeon Kye
*, Kyoung hee Oh
*, Kee ho Park
**†*
Cancer Information and Education Branch, National Cancer Control Institute, National Cancer Center, Goyang, Republic of Korea
**
Cancer Policy Branch, National Cancer Control Institute, National Cancer Center, Goyang, Republic of Korea
<Abstract>
Objectives: This study aims to identify the psychosocial factors affecting on happiness among the general population in South Korea.
Methods: This cross-sectional study was conducted using the multiple-stratified random sampling on the Korea Census of 2005. In October 2009, investigators conducted 15-minute face-to-face interviews with 1,500 South Korean volunteers ranging from 30 to 69 years old with no history of cancer. The questionnaire included socio-demographics, stress levels, coping strategies, social support, SOC, and happiness levels. Results: The multivariate analysis identified that married persons were more likely to be happy than those who were not married, respondents who had a higher score of stress and SOC were less likely to be happy, and those who had a higher score of social support from family were more likely to be happy. Conclusions: Interventions designed to increase happiness may need to include activities to control stress and promote social support from family.
Key words: Happiness, Korea, Psychosocial, Stress, Social support, Sense of coherence
Corresponding author : Kee ho Park, MD, PhD
Cancer Policy Branch, National Cancer Control Institute, National Cancer Center, 323 Ilsan-ro Ilsandong-gu Goyang, 410-769 Republic of Korea
주소: (410-769) 경기도 고양시 일산동구 일산로 323 국립암센터 암정책과 Tel: +82-31-920-2160 Fax: +82-31-920-8133 E-mail: park.keeho@gmail.com
* This study was financially supported by National Cancer Center [Grant 1310260-2]. No potential conflicts of interest were disclosed.
•Received: January 19, 2015 •Revised: March 13, 2015 •Accepted: March 16, 2015
Ⅰ. Introduction
Since people satisfy more of their essential material needs throughout the world, the interest in happiness is gradually increasing. Happiness can be examined by two separate dimensions in terms of people’s evaluations of their lives: life satisfaction which is appraised cognitively about one’s life and emotions which refers to positive and negative affect (Diener, 2000). A whole view of the overall perception of happiness was created by the blend of these two components (Pavot &
Dinner, 1993). Because happiness holds the diversity of meanings, it can be operationalized and assessed as general happiness (Michalos, Zumbo, & Hubley, 2000). To encompass the multitude of meanings for the individuals answering the question, the concept of happiness is measured by a
single-item using this comprehensive definition. Research has found that mortality may be predicted by single-item self-reported happiness questions better than by objective measures, even after counterbalanced by the negative impact of chronic illness on mortality (Guven & Saloumidis, 2009).
There is a large amount of accumulating evidence that happiness is associated with many valued social resources, such as higher incomes, higher education, better mental health, improved social and personal functioning, lower unsocial activity, better job performance, healthy behaviors, and longevity (Diener 2000; Savelkoul et al., 2000; Subramanian, Kim, & Kawachi, 2005; Staats, Cosmar, & Kaffenberger, 2007; Grant, Wardle, & Steptoe, 2009; Lane et al., 2009;
Piqueras et al., 2011; Shahab & West, 2012; Wang et al.,
2012). On the basis of the individual and environmental
benefits of increasing happiness from these literature, the development of interventions aimed to improve and sustain individuals’ happiness levels has attracted attention of positive psychologists (Seligman et al., 2005). However, the research on the most effective method of maximizing the level of happiness still needs to be conducted in depth.
Research has generally taken a stress-and-strain approach to the development of happiness, ‘fixing what is wrong,’ rather than ‘developing what is right’ (Schaufeli, 2004). However, previous studies revealed that happiness can be improved by emphasizing the positive psychosocial factors such as social support and efficient coping styles as well as reducing negative factors such as stress (Savelkoul et al., 2000; Azizi, 2012).
Several happiness interventions using affirmative reactions such as counting one’s blessings, performing acts of kindness, or promoting hopeful goal-directed thinking have shown positive findings to be emerged (Otake et al., 2006; Feldman
& Dreher, 2012). An intervention program should not be initiated without first conducting a needs assessment to determine the specific needs of the target population. During this phase, it is extremely important to collect primary data from members of the target population (Gibert, Sawyer, &
McNeill, 2011). Thus, it is necessary to collect and manipulate a particular set of positive psychosocial factors known to be related to happiness.
Some studies examined psychosocial variables related to happiness and showed that college students who reported perceived higher levels of stress were less happy than those who had lower levels of stress (Holly & Schiffrin, 2010). The stress levels of participants with higher emotional intelligence were lower and the levels of life satisfaction and happiness of them were higher, indicating that perceived stress mediates the relationship between emotional intelligence and a sense of well-being (Ruiz-Aranda, Extremera, & Pineda-Galan, 2013).
Those who reported feeling stressed in normal circumstances and during tests situations showed a lower likelihood of being considered ‘very happy’ (Piqueras et al., 2011). Higher levels of emotion-based coping were linked to greater subjective happiness in cases of girls from the Government Aided School
(Joseashwinanand & Saraladevi, 2013). Conversely, in general there was a negative relationship between inefficient coping styles such as emotion-based coping and happiness and a positive relationship between efficient coping styles such as problem-based coping and happiness (Azizi, 2012). One study revealed that the best predictors of happiness in the immigrant women in Spain were emotional support from the family and instrumental support from the native (Dominguez-Fuentes &
Hombrados-Mendieta, 2012). Findings demonstrate the importance of understanding the psychosocial factors affecting happiness. However, most of these studies have focused on a few psychosocial factors and a specific target. Therefore, the aim of the present study was to determine the relationship between happiness and other factors such as socio-demographics, stress, coping strategies, social support, and sense of coherence (SOC) among the general population in Republic of Korea.
Ⅱ. Methods
1. Design and Sample
The participants in this cross-sectional study were chosen from a population-based database using multiple stratified random sampling on the Korea Census of 2005 which is the 17
thpopulation census in Korea. Administrative districts and their size were considered to select the enumeration districts.
Three to eight households were chosen randomly in an enumeration district and one eligible person whose date of birth was closest to the point of survey was selected as a respondent per household. A total of 1,500 participants aged between 30 and 69 years, with no history of cancer, were engaged in face-to-face interviews in October 2009.
Information was collected about the participants’ happiness
levels, stress levels, coping strategies, social support, SOC, and
socio-demographics.
2. Measures
Happiness was assessed using people’s responses to the question, ‘In general, how would you describe your happiness?’ As a construct, ‘happiness’ could be examined in terms of people’s overall evaluation of their own lives and capture momentary feelings of pleasure. This single item is part of the General Health Questionnaire, which has been validated by many studies (Goldberg et al., 1997). Single-item happiness measures have been widely used in the literature in several different cultures (Subramanian et al., 2005; Wang et al., 2012). We dichotomized the four categories of the happiness measure to ‘0’ if ‘not happy at all,’ and ‘1’ if ‘very happy,’ ‘mostly happy,’ or ‘a little bit happy’ to identify the factors related “not to be unhappy” instead to “feel above the average happiness.”
The Psychosocial Wellbeing Index — Short Form (PWI-SF) was used to assess participants’ levels of psychosocial stress (Jang, 2000). The original PWI, based on the General Health Questionnaire-60 (Goldberg & Hillier, 1979), was revised and adapted by Jang (Jang, 1994) to amend for Korean population.
It contains items on social performance and self-confidence (e.g. I can enjoy daily life), depression (e.g. I feel unhappy and depressed), general well-being and vitality (e.g. I feel comfortable and healthy), and sleeping disturbance and anxiety (e.g. I can’t sleep well because I am concerned). The PWI-SF consists of 18 items, each scored on a four-point Likert scale ranging from ‘strongly disagree’ (0) to ‘strongly agree’ (3).
The total score can range from 0 to 54. The Cronbach's alpha coefficient was 0.87.
Respondents’ coping strategies were assessed using the Coping Strategy Indicator (CSI) developed by Amirkhan (Amirkhan, 1990). The CSI is a self-report measure containing 33 items that assess three coping strategies: social support seeking, problem solving, and avoidance. The participants are asked to recall one stressful situation that they encountered in the last six months and to rate each item based on the coping strategy they utilized. Each coping strategy is rated on a three-point Likert scale ranging from ‘never’ (1) to ‘much’ (3), and the score on the CSI can range from 11 to 33. The
Cronbach's alpha coefficients were 0.84, 0.86, and 0.76 for social support seeking, problem solving, and avoidance, respectively.
Social support was assessed using the Multidimensional Scale of Perceived Social Support (MSPSS) developed by Zimet & Farley (1988). The MSPSS consists of 12 perceived social support items and 3 subscales that assess support from
‘family,’ ‘friends,’ and ‘significant others.’ Participants were asked to rate each item on a five-point Likert scale ranging from ‘strongly disagree’ (1) to ‘strongly agree’ (5), and the score could range from 4 to 20. The Cronbach’s alpha coefficients were 0.92, 0.90, 0.87 for family, friends, and significant others, respectively.
SOC was assessed using the Sense of Coherence Scale (SOC-13) developed by Antonovsky (1993). This scale refers to an enduring attitude and measures how people view life and, in stressful situations, identify and use their general resistance resources to maintain and develop their health. The SOC-13 consists of three dimensions with 13 items: comprehensibility, manageability, and meaningfulness. This tool uses a seven-point Likert scale ranging from “never” (1) to ‘very often’ (7). The total score on the tool can range from 13 to 91. The Cronbach's alpha coefficient for this scale was 0.77.
3. Ethics statement
The study protocol was approved by the Institute Review Board at the National Cancer Center, and informed written consent was obtained from all study participants.
4. Analysis
For the purpose of analysis, the chi-square test was conducted
to assess the relationships between demographics, stress, coping
strategy, social support, SOC, and happiness level. Multivariate
analysis was performed using a stepwise multiple logistic
regression model in order to determine adjusted odds ratios
(aOR) for socio-demographic and psychosocial factors related to
happiness, after adjusting effects of some possible confounding
or background variables. Variables in the multivariate analysis
Total n (%)
Happy n (%)
Unhappy n (%)
p
†Total 1500(100.0) 1410(94.0) 90(6.0)
Gender
Male 755(50.3) 705(50.0) 50(55.6) .329
Female 745(49.7) 705(50.0) 40(44.4)
Age, years
30-39 465(31.0) 441(31.3) 24(26.7) .783
40-49 477(31.8) 446(31.6) 31(34.4)
50-59 339(22.6) 319(22.6) 20(22.2)
60-69 219(14.6) 204(14.5) 15(16.7)
Education (missing n = 7)
None 16(1.1) 14(1.0) 2(2.2) .036
Elementary school graduate 115(7.7) 101(7.2) 14(15.7)
Middle school graduate 164(11.0) 152(10.8) 12(13.5)
High school graduate 731(49.0) 695(49.5) 36(40.4)
College graduate 430(28.8) 408(29.1) 22(24.7)
≥ Graduate school 37(2.5) 34(2.4) 3(3.4)
Marital status
Not married 139(9.3) 121(8.6) 18(20.2) <.001
Married 1306(87.0) 1243(88.0) 63(70.8)
Divorced/Separated 16(1.1) 14(1.0) 2(2.2)
Widowed 40(2.7) 34(2.4) 6(6.7)
Annual family income, US dollars (missing n = 19)
< 20,000 299(20.2) 269(19.3) 30(33.7) .001
were selected based on variables that were marginally significant with p < .1 in univariate analysis. Probabilities for removal and entry of factors were set to 0.15 and 0.20. Correlation was performed to assess the confounders. Data were analyzed using SPSS 15.0 software.
Ⅲ. Results
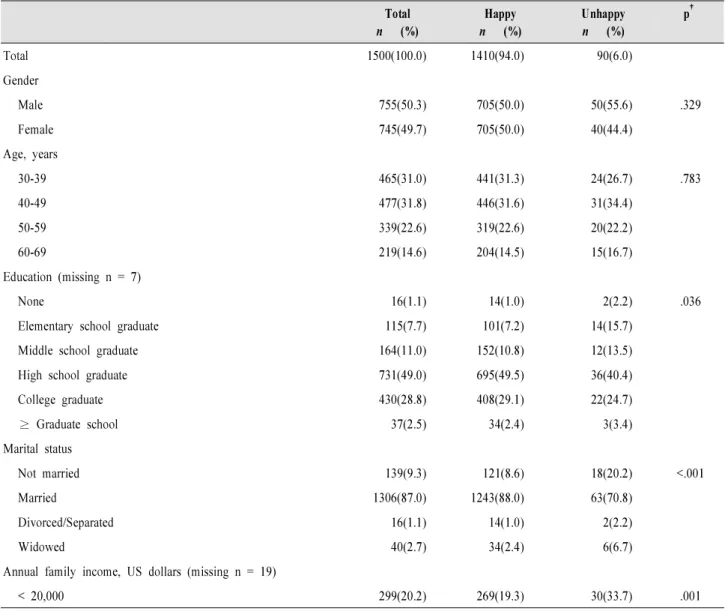
Table 1 and 2 list the characteristics of the sample and their happiness level with regard to each variable. The mean age
was 46.7 years (range, 30 to 69 years; median, 46.0 years), standard deviation (SD) was 10.3 years, 87% had a partner, and 74.3% were employed. Nearly one third of the participants had university-level education, whereas 19.8% of the study population had not completed high school. About 6% of the participants perceived that they were not happy at all.
Happiness level differed significantly with regard to education, marital status, annual family income, stress, social support-seeking coping strategy, problem-solving coping strategy, social support from family, social support from friends, social support from significant others, and SOC.
<Table 1> Sociodemographic characteristics by happiness levels
Total n (%)
Happy n (%)
Unhappy n (%)
p
†20,000-29,999 394(26.6) 365(26.2) 29(32.6)
30,000-39,999 446(30.1) 424(30.5) 22(24.7)
40,000-49,999 199(13.4) 192(13.8) 7(7.9)
50,000-69,999 106(7.2) 106(7.6) 0(0.0)
≥ 70,000 37(2.5) 36(2.6) 1(1.1)
Type of job
None 56(3.7) 50(3.5) 6(6.7) .502
Outdoor (agriculture, animal, forest & fishing) 42(2.8) 39(2.8) 3(3.3)
Self-employed, small business (retail, food service, taxi driving, etc.) 446(29.7) 417(29.6) 29(32.2)
Sales & marketing (customer service) 190(12.7) 176(12.5) 14(15.6)
Engineering, technical, transport & logistics 86(5.7) 80(5.7) 6(6.7)
Building, construction, & manual (including cleaning, security, etc.) 56(3.7) 51(3.6) 5(5.6) Office & administrative (general office work, education & training) 263(17.5) 251(17.8) 12(13.3)
Management & executive 8(0.5) 7(0.5) 1(1.1)
Professional (academic, health care, law, arts, etc.,) 24(1.6) 23(1.6) 1(1.1)
Housewife 330(22.0) 317(22.5) 13(14.4)
Religious affiliation
None 631(42.6) 586(42.1) 45(50.6) .260
Buddhist 373(25.2) 351(25.2) 22(24.7)
Protestant 371(25.0) 356(25.6) 15(16.9)
Catholic 107(7.2) 100(7.2) 7(7.9)
†
p values were determined using the chi-square test and t-test.
<Table 2> Psychosocial factors by happiness levels
Total mean(SD)
Happy mean(SD)
Unhappy mean(SD)
p
†Stress 36.80(7.85) 36.10(7.31) 47.93(7.70) <.001
Coping strategy: Social support seeking 21.86(3.93) 21.93(3.86) 20.65(4.72) .003
Coping strategy: Problem solving 23.73(4.11) 23.83(4.08) 22.20(4.40) <.001
Coping strategy: Avoidance 18.26(3.82) 18.22(3.81) 18.76(3.99) .195
Social support: Family 15.34(2.55) 15.46(2.42) 13.48(3.59) <.001
Social support: Friends 14.32(2.70) 14.41(2.63) 12.90(3.23) <.001
Social support: Significant others 14.77(2.94) 14.88(2.83) 12.98(3.92) <.001
Sense of Coherence 58.88(9.04) 59.24(8.79) 53.32(10.95) <.001
†
p values were determined using the chi-square test and t-test.
Stepwise multiple logistic regression was performed to explain relationships between socio-demographic and psychosocial factors, and happiness level, after adjusting for effects of some possible confounding or background variables.
Education, marital status, annual family income, stress, social support-seeking coping strategy, problem-solving coping strategy, social support from family, social support from friends, social support from significant others, and SOC were retained in the multivariate logistic regression model (p < .1).
The analyzed results of the stepwise logistic regression model are summarized in Table 3. The results revealed that married
persons were more likely to be happy than those who were not married (aOR 2.77, 95% CI, 1.43 to 5.38). Stress (aOR 0.79, 95% CI, 0.75 to 0.82) and SOC (aOR 0.96, 95% CI, 0.92 to 0.99) were the independent psychosocial risk factors for happiness, and social support from family (aOR 1.14, 95% CI, 1.04 to 1.25) was the independent psychosocial protective factor for happiness. Correlation was conducted to assess the confounding variables indicating that some of the independent factors (stress, coping strategy: social support seeking, coping strategy: problem solving, coping strategy: avoidance, social support, and sense of coherence) were significantly correlated.
<Table 3> Multivariate logistic regression analysis with happiness as the dependent variable.
†β Wald χ
2p-value OR 95% CI
Marital status(ref: Not married)
Married 1.022 9.15 .002 2.77 1.43-5.38
Divorced/Separated 0.367 0.16 .689 1.44 0.23-8.72
Widowed 0.281 0.20 .649 1.32 0.39-4.45
Stress -0.233 100.40 <.001 0.79 0.75-0.82
Social support: Family 0.136 8.74 .003 1.14 1.04-1.25
Sense of Coherence -0.041 5.92 .015 0.96 0.92-0.99
R
2= 0.134 Abbreviations: OR, odds ratio; CI, confidence interval
†