* Corresponding author
Phone: +82-51-720-2455, Fax: +82-51-720-2456 E-mail: [email protected]
EST-based Identification of Genes Expressed in the Muscle of Olive Flounder, Paralichthys olivaceus
Eun-Mi Park1, Young-Ok Kim1*, Bo-Hye Nam1, Hee Jeong Kong1, Woo-Jin Kim1, Sang-Jun Lee1 and Tae-Jin Choi1,2
1Biotechnology Research Institute, National Fisheries Research & Development Institute, 408-1 Sirang-ri, Gijang-eup, Gijang-gun, Busan 619-902, Republic of Korea
2Department of Microbiology, Pukyong National University, 599-1 Daeyeon-dong, Nam-gu, Busan 608-737, Republic of Korea
Abstract of expressed sequence tags (ESTs) is an efficient approach for gene discovery, ex- pression profiling, and development of resources useful for functional genomics. To analyze the transcriptome of olive flounder, Paralichthys olivaceus, we have conducted EST analysis using cDNA libraries made from muscle of P. olivaceus. Redundant ESTs were assembled into over- lapping contigs by using the assembly program ICAtools software. We found that the 221 ESTs were composed of 21 clusters and 35 singletons, suggesting that the overall redundancy of the library was 74.7%. Of the 221 clones, 218 clones (98.6%) were identified as known genes by BLAST searches and 3 clones (1.4%) did not match to any previously described genes. Based on major functions of their encoded proteins, the identified clones were classified into 13 broad categories. Sequence analysis of the ESTs revealed the presence of microsatellite-containing genes which may be valuable for further gene mapping studies. This study contributes to the identification of many EST clones that could be useful for genetics and developmental biology of olive flounder.
Key words : Olive flounder, Paralichthys olivaceus, expressed sequence tag (EST), expression profile, marker
Introduction
The olive flounder is one of the main edible fishes in the Asian countries, and also one of the most lucra- tive fishes in marine culture industries. The olive flounder stocks currently used in aquaculture have be- come appreciably different from their wild counterpars, which suggest that olive flounder genetics will play a more important role in improving the performance of brood stocks [16]. The increasing pressure in the field of aquaculture has determined the necessity to adopt the most recent techniques of molecular biology that, integrated with the classic methodologies, could aug- ment the overall efficiency of the industry.
The expressed sequence tag (EST) approach is a use- ful technique for large-scale cloning and character- ization of cDNAs [7,17,18] for deciphering genome se-
quences [9]. In addition, this approach is valuable in the studies of mRNA expression profiles at the single gene level, from unbiased cDNA libraries, as this pro- vides information on the composition and the relative abundance of the transcripts [14].
Recently, EST analysis allows acquisition of huge number of DNA sequence information in a short time period for many organisms including several species of fish [1,2,7,21,25]. However, the number of fish-related ESTs stored in public databases remains miniscule rela- tive to the amount of mammalian sequences, and rela- tively few tissue-specific cDNA libraries are available [23]. The expression profiles inherent to tissue-specific cDNA libraries sometimes provide novel and different information, which can also provide more profound functional meaning [13].
Muscle is the largest organ system in fish and de-
termines fish meat quality and production traits [24].
The understanding of the growth and developmental mechanisms of muscle holds great scientific and prac- tical values. Detection of gene-expression patterns of muscle may facilitate the characterization of candidate genes that can be further investigated for fish meat pro- duction and quality traits [5,8]. Herein, as a component of a transcriptome analysis of the olive flounder, we have constructed cDNA library from the muscle of adult olive flounder, and analyzed 221 expressed se- quence tag (EST) clones.
Materials and Methods Fish and tissues preparation
Olive flounder Paralichthys olivaceus were obtained from Koje Hatchery of National Fisheries Research and Development Institute (NFRDI) and maintained in 6 tons flow-through tank at 12±1°C under a natural photoperiod. Muscle tissue was collected and cut into as small pieces as possible. Pooled tissue was rapidly frozen with liquid nitrogen and ground with a mor- tar/pestle.
Construction of olive flounder cDNA library mRNAs were isolated from muscle using a PolyA Tract mRNA isolation kit (Promega, WI). cDNA syn- thesis was carried out using a ZAP-cDNA synthesis kit with oligo-(dT) primer (Stratagene, CA). The cDNA li- brary was constructed in Uni-ZAP XR vectors accord- ing to the manufacturer's instruction (Stratagene, CA).
All primary libraries were amplified and aliquots of each amplified library were stored at both 4°C and -80°C.
Plasmid preparation and sequencing
Conversion of the recombinant Uni-ZAP XRs into pBluescript phagemids was carried out by in vivo ex- cision according to the manufacturer's instruction (Stratagene, CA). Plasmid DNA was prepared by the alkaline lysis method [22] using the Qiagen Spin Column Mini-plasmid kits. Single-pass sequencing of 5'-termini of selected cDNA clones in phagemid form was performed using the ABI 3130 automatic DNA se- quencer (PE Applied Biosystems, CA).
Bioinformatic analysis
Bioinformatic analysis was conducted to determine
gene identities using GeneMaster 3.0 software (Ensoltek, Republic of Korea). Briefly, vector sequence was re- moved and database search was limited to ESTs >100bp in length. ESTs were then assembled in clusters of con- tigous sequences (contig) using ICAtools program [20].
Gene annotation procedures and homology searches of the sequenced ESTs were done by BLASTX for amino acids similarity comparisons [3]. Matches were consid- ered to be significant only when the probability (P) was less than 1×10⁻³ using BLASTX with all parameters at the defaults. All ESTs that were not identified as ortho- logues of known genes were designated as unknown EST clones and hypothetical proteins were considered as known EST clones.
Identification of microsatellite containing cDNAs
In total 221 EST sequences were screened for di-, tri-, tetra-, pentanucleotide microsatellite repeats using MICAS (Microsatellite Analysis Server) program (http://210.212.212.7/MIC/index.html). The criteria used to identify microsatellite were as follows: five repeats for dinucleotide microsatellites, four repeats for trinu- cleotide microsatellites and three repeats for tetra-and pentanucleotide microsatellites. Single nucleotide re- peats were not included since they are not very useful for polymorphic markers. Some cDNA clones contained more than one type of repeat, in which case these clones were categorized according to the longest repeats.
Results and Discussion
Summary of EST clones in cDNA library from muscle of olive flounder
We made cDNA libraries from muscle of olive flounder, consisting of 1.0×10⁶ pfu/ml from poly- adenylated fractions of RNA isolated from olive flound- er muscle. A number of clones in the constructed cDNA libraries were believed to be sufficient to encompass the predominantly expressed mRNA within tissue. The average length of the insert cDNA fragments was 1.7 kb (range, 0.5-3.5 kb). Total of 222 clones were ran- domly selected from cDNA library. The nucleotide se- quences of these clones (CX283967-CX284188) were determined using T3 primer, and then homologous se- quences were searched in GenBank database. A sum- mary of the identified genes is shown in Table 1. The ESTs were grouped into total 221 consensus sequences,
Table 1. General characteristics of muscle ESTs taken from olive flounder
Muscle Number of clones sequenced
Number of clones analysed Average insert size (kb) EST clusters
Unigene
Redundancy (%)
ESTs with E value < 1×e-3 (matched)(%) ESTs with E value ≥ 1×e-3 (unknown)(%)
222 221 1.7±0.4
21 56 74.7%
218 (98.6%) 3 (1.4%)
comprised of 21 clusters and 35 singletons, suggesting that the libraries had an overall redundancy of 74.7.7%.
BLASTX comparisons established that 218 (98.6%) of the clones were orthologues of known genes and the remaining 3 clones were not identified via similarity comparisons (E±1×e-3). Among the 221 EST clones, six unique genes were identified as homologues of pre- viously reported olive flounder ESTs, and 212 (97.2%) genes were identified as orthologues of known genes from other organisms. These results suggest that EST analysis constitutes a powerful technique for the rapid discovery of large numbers of useful genes in olive flounder.
Expression profile in muscle of olive flounder The expression profiles of the known genes identified in muscle of olive flounder are provided in Fig. 1.
Among the 56 identified genes, 35 genes (62.5%) were sequenced only once; 10 genes (17.9%) were 2-4 times;
11 genes (19.6%) were 5 times or more. The percentage of singletons was acceptable, although redundancy tends to increase with increasing numbers of sequenced clones. The most abundantly expressed genes in the mus- cle were as follows: hypothetical protein LOC406496
35
5 4
1 2
0 1 2 1 1 1 1 2
0 10 20 30 40
1 2 3 4 5 6 7 8 16 19 49 60 76
Redundancy
Hits per gene
Fig. 1. Expression profiles and sequencing redundancy in the analysis of ESTs from the muscle of olive flounder.
(34.4%), aldolase A fructose-bisphosphate (34.4%), al- dolase A (27.1%) and glyceraldehyde-3-phosphate de- hydrogenase (GAPDH) (22.2%) (Fig. 1).
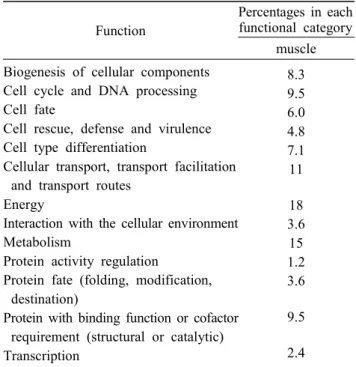
Distribution of the identified clones in mus- cle of olive flounder
Based on the major functions of their encoded pro- teins, the identified clones were classified into 13 broad categories, as follows: biogenesis of cellular compo- nents, cell cycle/ DNA processing, cell fate, cell rescue/
defense/ virulence, cell type differentiation, cellular transport/ transport facilitation/ transport routes, energy, interaction with the cellular environment, metabolism, protein activity regulation, protein fate (folding, mod- ification, destination), protein with binding function/
cofactor requirement (structural or catalytic), and transcription. The distribution of identified clones from the cDNA library of muscle is shown in Table 2.
The muscle cDNA library shows some differences in expression patterns of previously reported tissues from olive flounder [13] that reflect their different func- tion in olive flounder. However, notable differences were not detected. Clones associated with energy, me- tabolism, cellular transport/ transport facilitation/ trans- port routes were represented in high percentages. In oth- er hand, a reverse trend was also noted; namely, clones associated with protein activity regulation, transcription,
Table 2. Functional categorization of the muscle cDNA li- brary taken from olive flounder
Function
Percentages in each functional category
muscle Biogenesis of cellular components
Cell cycle and DNA processing Cell fate
Cell rescue, defense and virulence Cell type differentiation
Cellular transport, transport facilitation and transport routes
Energy
Interaction with the cellular environment Metabolism
Protein activity regulation
Protein fate (folding, modification, destination)
Protein with binding function or cofactor requirement (structural or catalytic) Transcription
8.3 9.5 6.0 4.8 7.1 11 18 3.6 15 1.2 3.6 9.5 2.4
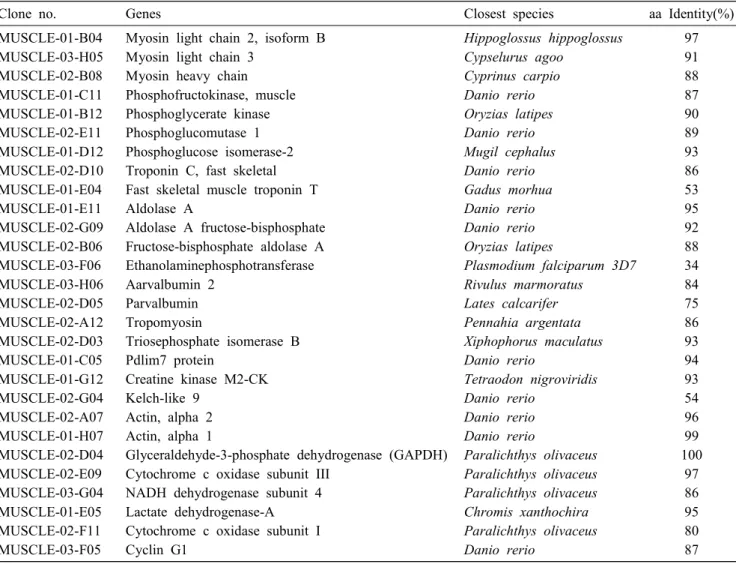
Table 3. Mainly identified ESTs from the muscle cDNA library of olive flounder
Clone no. Genes Closest species aa Identity(%)
MUSCLE-01-B04 MUSCLE-03-H05 MUSCLE-02-B08 MUSCLE-01-C11 MUSCLE-01-B12 MUSCLE-02-E11 MUSCLE-01-D12 MUSCLE-02-D10 MUSCLE-01-E04 MUSCLE-01-E11 MUSCLE-02-G09 MUSCLE-02-B06 MUSCLE-03-F06 MUSCLE-03-H06 MUSCLE-02-D05 MUSCLE-02-A12 MUSCLE-02-D03 MUSCLE-01-C05 MUSCLE-01-G12 MUSCLE-02-G04 MUSCLE-02-A07 MUSCLE-01-H07 MUSCLE-02-D04 MUSCLE-02-E09 MUSCLE-03-G04 MUSCLE-01-E05 MUSCLE-02-F11 MUSCLE-03-F05
Myosin light chain 2, isoform B Myosin light chain 3
Myosin heavy chain Phosphofructokinase, muscle Phosphoglycerate kinase Phosphoglucomutase 1 Phosphoglucose isomerase-2 Troponin C, fast skeletal Fast skeletal muscle troponin T Aldolase A
Aldolase A fructose-bisphosphate Fructose-bisphosphate aldolase A Ethanolaminephosphotransferase Aarvalbumin 2
Parvalbumin Tropomyosin
Triosephosphate isomerase B Pdlim7 protein
Creatine kinase M2-CK Kelch-like 9
Actin, alpha 2 Actin, alpha 1
Glyceraldehyde-3-phosphate dehydrogenase (GAPDH) Cytochrome c oxidase subunit III
NADH dehydrogenase subunit 4 Lactate dehydrogenase-A Cytochrome c oxidase subunit I Cyclin G1
Hippoglossus hippoglossus Cypselurus agoo
Cyprinus carpio Danio rerio Oryzias latipes Danio rerio Mugil cephalus Danio rerio Gadus morhua Danio rerio Danio rerio Oryzias latipes
Plasmodium falciparum 3D7 Rivulus marmoratus
Lates calcarifer Pennahia argentata Xiphophorus maculatus Danio rerio
Tetraodon nigroviridis Danio rerio
Danio rerio Danio rerio
Paralichthys olivaceus Paralichthys olivaceus Paralichthys olivaceus Chromis xanthochira Paralichthys olivaceus Danio rerio
97 91 88 87 90 89 93 86 53 95 92 88 34 84 75 86 93 94 93 54 96 99 100
97 86 95 80 87 interaction with the cellular environment and protein
fate (folding, modification, destination) were repre- sented at relatively low percentages.
Gene identification of the muscle cDNA li- brary
Manly identified EST clones in muscle library are summarized in Table 3. Several of the most abundant transcripts in the muscle cDNA library corresponded to genes that exhibit a skeletal muscle-specific or skel- etal muscle-predominant pattern of expression, includ- ing myosin light chain, myosin heavy chain, tropomyo- sin, troponin and muscle-specific creatine kinase [4].
The putative amino acid sequence deduced from one cDNA clone, MUSCLE-01-E04, was identified as the troponin T. Troponin T is a class of skeletal muscle specific proteins that are an important component of the thin-filament. Recently, troponin T gene expression profile is regulated at metamorphosis of flatfish by thy-
roid hormones (THs) that are involved in muscle devel- opment [6]. The amino acid sequence of MUSCLE-02- D10 was 86% identical through the troponin C of the zebrafish. Troponin C is a key subunit triggering the contraction of striated muscles responding to the changes in intracellular Ca2+ concentration [19]. The putative amino acid sequences deduced from the cDNA clones, MUSCLE-03-H06 and MUSCLE-02-D05, were determined to be those of parvalbumins (MUSCLE-03- H06; parvalbumin 2, MUSCLE-02-D05; parvalbumin).
Parvalbumins are Ca2+-binding proteins with low mo- lecular weight and acidic isoelectir point. They are pres- ent in relatively high amounts in white muscle of lower vertebrates and have been suggested to be important in the relaxation of fiber in muscle [11,12]. Despite of these important, parvalbumins are founded major al- lergy-eliciting protein in fish.
In addition, some of identified genes represent house-keeping genes, such as actin, glyceraldehyde-3-
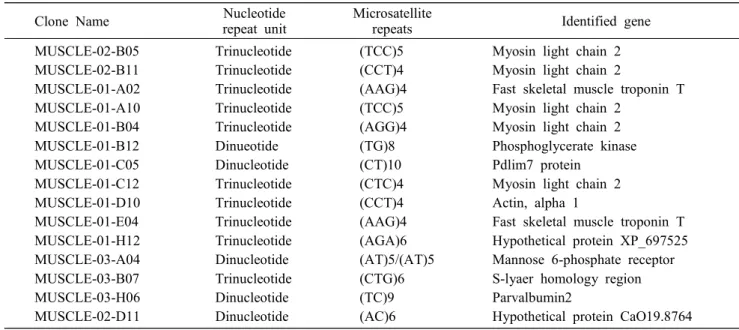
Table 4. EST-containing microsatellite cDNA clones from the muscle cDNA library of olive flounder
Clone Name Nucleotide
repeat unit
Microsatellite
repeats Identified gene
MUSCLE-02-B05 MUSCLE-02-B11 MUSCLE-01-A02 MUSCLE-01-A10 MUSCLE-01-B04 MUSCLE-01-B12 MUSCLE-01-C05 MUSCLE-01-C12 MUSCLE-01-D10 MUSCLE-01-E04 MUSCLE-01-H12 MUSCLE-03-A04 MUSCLE-03-B07 MUSCLE-03-H06 MUSCLE-02-D11
Trinucleotide Trinucleotide Trinucleotide Trinucleotide Trinucleotide Dinueotide Dinucleotide Trinucleotide Trinucleotide Trinucleotide Trinucleotide Dinucleotide Trinucleotide Dinucleotide Dinucleotide
(TCC)5 (CCT)4 (AAG)4 (TCC)5 (AGG)4 (TG)8 (CT)10 (CTC)4 (CCT)4 (AAG)4 (AGA)6 (AT)5/(AT)5 (CTG)6 (TC)9 (AC)6
Myosin light chain 2 Myosin light chain 2
Fast skeletal muscle troponin T Myosin light chain 2
Myosin light chain 2 Phosphoglycerate kinase Pdlim7 protein
Myosin light chain 2 Actin, alpha 1
Fast skeletal muscle troponin T Hypothetical protein XP_697525 Mannose 6-phosphate receptor S-lyaer homology region Parvalbumin2
Hypothetical protein CaO19.8764
phosphate dehydrogenase (GAPDH), NADH de- hydrogenase subunit, aldolase A and cytochrome c oxi- dase subunit I and the rest may play a more specific role in the muscle.
Isolation of EST clones containing micro- satellite
Among 222 sequenced cDNA clones, 15 unigue EST clones harbor microsatellite sequences (Table 4). They were located in 5'or 3'untranslated regions (UTRs) with a high frequency (data not shown). Microsatellites are generally thought to occur primarily in noncoding DNA. However, surveys of other cDNA libraries have revealed that up to 8% of clones may harbor micro- satellites [10]. These microsatellies may potentially be polymorphic and useful for genetic mapping of the olive flounder genome, but their potential poly- morphisms were not determined. As some of the micro- satellites are tagged to genes, development and mapping of type I markers will further facilitate comparative ge- nomics concerning genome organization and evolution.
The EST clones isolated in this study can be used as probe to develop molecular markers for tissue-specif- ic or cell-specific, to determine full-length sequences for cDNA or gene interest, and to perform functional analysis for olive flounder genes.
Acknowledgements
This study was supported by the Internship Program
of the Biotechnology Research Institute, NFRDI, Republic of Korea.
References
1. Adams, M.D., Kelley, J.M., Gocayne, J.D., Dubnick, M., Polymeropoulos, M.H., Xiao, H., Merril, C.R., Wu, A., Olde, B. and Moreno, R.F. et al. 1991. Complementary DNA sequencing: expressed sequence tags and human genome project. Science 252, 1651-1656.
2. Adams, M.D., Kerlavage, A.R., Fleischmann, R.D., Fuldner, R.A., Bult, C.J., Lee, N.H., Kirkness, E.F., Weinstock, K.G., Gocayne, J.D. and White, O. et al.
1995. Initial assessment of human gene diversity and ex- pression patterns based upon 83 million nucleotides of cDNA sequence. Nature 377, 173-174
3. Altschul, S.F., Madden, T.L., Schaffer, A.A., Zhang, J., Zhang, Z., Miller, W. and Lipman, D.J. 1997. Gapped BLAST and PSI-BLAST: a new generation of protein database search program. Nucl. Acids Res. 25, 3389- 3402.
3. Bai, J., Solberg, C., Fernandes, J.M. and Johnston, I.A.
2007. Profiling of maternal and developmental-stage spe- cific mRNA transcripts in Atlantic halibut Hippoglossus hippoglossus. Gene 386(1-2), 202-210.
4. Buetow, K.H., Edmonson, M.N. and Cassidy, A.B. 1999.
Reliable identification of large numbers of candidate SNPs from public EST data. Nat. Genet. 21(3), 323-325.
5. Campinho, M.A., Silva, N., Nowell, M.A., Llewellyn, L., Sweeney, G.E. and Power, D.M. 2007. Troponin T iso- form expression is modulated during Atlantic halibut metamorphosis. BMC Dev. Biol. 7, 71.
6. Clark, M.S., Edwards, Y.J., Peterson, D., Clifton, S.W., Thompson, A.J., Sasaki, M., Suzuki, Y., Kikuchi, K., Watabe, S., Kawakami, K., Sugano, S., Elgar, G. and
Johnson, S.L. 2003. Fugu ESTs: new resources for tran- scription analysis and genome annotation, Genome Res.
13, 2747-2753.
7. Davoli, R., Zambonelli, P., Bigi, D., Fontanesi, L. and Russo, V. 1999. Analysis of expressed sequence tags of porcine skeletal muscle. Gene 233(1-2), 181-188.
8. Dehal, P., Satou, Y., Campbell, R.K., Chapman, J., Degnan, B. and De Tomaso, A. et al., 2002. The draft genome of Ciona intestinalis: insights into chordate and vertebrate origins. Science 298, 2157-2167.
9. Depeiges, A., Goubely, C., Lenoir, A., Cocherel, S., Picard, G., Raynal, M., Grellet, F. and Delseny, M. 1995.
Identification of the most represented repeated motifs in Arabidopsis thaliana microsatellite loci. Theor. Appl.
Genet. 91, 160-168.
10. Gillis, J., Thomason, D., Lefevre, J. and Kretsinger, R.H.
1982. Parvalbumins and muscle relaxation: a computer simulation study, J. Muscle Res. Cell Motil. 3, 377-398.
11. Heizmann, C.W., Berchtold, M.W. and Rowlerson, A.M.
1982. Correlation of parvalbumin concentration with re- laxation speed in mammalian muscles. Proc. Natl. Acad.
Sci. U.S.A. 79, 7243-7247.
12. Kim, Y.O., Park, E.M., Nam, B.H., Jee, Y.J., Kong, I.S.
and Lee, S.J. 2006. EST-based identification of genes ex- pressed in the spleen and headkidney of olive flounder Paralichthys olivaceus. Kor. J. Genet. 28(1), 9-15.
13. Kimura, T., Jindo, T., Narita, T., Naruse, K., Kobayashi, D., Shin-I, T., Kitagawa, T., Sakaguchi, T., Mitani, H., Shima, A., Kohara, Y. and Takeda, H. 2004. Large-scale isolation of ESTs from medaka embryos and its applica- tion to medaka developmental genetics. Mech. Dev.
121(7-8), 915-932.
14. Kurobe, T., Yasuike, M., Kimura, T., Hirono, I. and Aoki, T. 2005. Expression profiling of immune-related genes from Japanese flounder Paralichthys olivaceus kid- ney cells using cDNA microarrays. Dev. Comp. Immunol.
29(6), 515-523.
15. Lie, O., Slettan, A., Grimholt, U., Lundin, M., Syed, M.
and Olsaker, I. 1994. Fish gene maps and their im- plications for aquaculture. Anim. Biotech. 5, 209-218.
16. Lo, J., Lee, S., Xu, M., Liu, F., Ruan, H., Eun, A., He,
Y., Ma, W., Wang, W., Wen, Z. and Peng, J., 2003.
15,000 unique zebrafish EST clusters and their future use in microarray for profiling gene expression patterns dur- ing embryogenesis. Genome Res. 13, 455-466.
17. Nishikata, T., Yamada, L., Mochizuki, Y., Satou, Y., Shin-i, T., Kohara, Y. and Satoh, N., 2001. Profiles of maternally expressed genes in fertilized eggs of Ciona intestinalis. Dev. Biol. 238, 315-331.
18. Ojima, T., Ohta, T. and Nishita, K. 2001. Amino acid sequence of squid troponin C. Comp. Biochem. Physiol.
B Biochem. Mol. Biol. 129(4), 787-796.
19. Parsons, J.D. 1995. Improved tools for DNA comparison and clustering. Comp. Appl. Biosci. 11, 603-613.
20. Rise, M.L., von Schalburg, K.R., Brown, G.D., Mawer, M.A., Devlin, R.H., Kuipers, N., Busby, M., Beetz-Sargent, M., Alberto, R., Gibbs, A.R., Hunt, P., Shukin, R., Zeznik, J.A., Nelson, C., Jones, S.R., Smailus, D.E., Jones, S.J., Schein, J.E., Marra, M.A., Butterfield, Y.S., Stott, J.M., Ng, S.H., Davidson, W.S.
and Koop, B.F. 2004. Development and application of a salmonid EST database and cDNA microarray: data mining and interspecific hybridization characteristics.
Genome Res. 14, 478-490.
21. Sambrook, J., Frisch, E.F. and Maniatis, T. 2000.
Molecular Cloning, A Laboratory Manual, Cold Spring Harbor Laboratory Press, Cold Spring Harbor, New York.
22. Ton, C., Hwang, D.M., Dempsey, A.A., Tang, H.C., Yoon, J., Lim, M., Mably, J.D., Fishman, M.C. and Liew, C.C. 2000. Identification, characterization, and mapping of expressed sequence tags from an embryonic zebrafish heart cDNA library. Genome Res. 10(12), 1915-1927.
23. Wang, X.L., Wu, K.L., Li, N., Li, C.L., Qiu, X.M., Wang, A.H. and Wu, C.X. 2006. Analysis of expressed sequence tags from skeletal muscle-specific cDNA li- brary of Chinese native Xiang pig. Yi Chuan Xue Bao.
Acta Genetica Sinica. 33(11), 984-991.
24. Zeng, S. and Gong, Z. 2002. Expressed sequence tag analysis of expression profiles of zebrafish testis and ova- ry, Gene 10, 45-53.