The Effect of the Degree of Luminal Contrast- Enhancement on CT Measurement of Plaque Size:
A Comparison with T1-weighted Magnetic Resonance Imaging
1Byoung Wook Choi, M.D., Jin Hur, M.D., Hye-Jeong Lee, M.D., Young Jin Kim, M.D., Tae Hoon Kim, M.D.2, Kyu Ok Choe, M.D.
1Department of Diagnostic Radiology, Department of Cardiovascular Radiology Cardiovascular Center, and Research Institute of Radiological Science, Yonsei University College of Medicine
2Department of Diagnostic Radiology, Gangnam Severance Hospital, Yonsei University College of Medicine
This work was supported by the Korea Research Foundation Grant funded by the Korean Government (MOEHRD, Basic Research Promotion Fund) (KRF- 2007-313-E00358).
Received August 11, 2010 ; Accepted August 24, 2010
Address reprint requests to : Byoung Wook Choi, M.D., Department of Diagnostic Radiology, Severance Hospital, Yonsei University College of Medicine, 250 Seongsanno, Seodaemoon-gu, Seoul 120-752, Korea.
Tel. 82-2-2228-7400 Fax. 82-2-393-3035 E-mail: [email protected]
Purpose: We studied early and delayed contrast-enhanced CT to determine the effects of the degree of luminal enhancement on the measurement of plaque size compared to T1-weighted MRI.
Materials and Methods: T1-weighted MRI and a two-phase contrast-enhanced CT was performed in 5 New Zealand white rabbits with atherosclerosis. Early-phase images were acquired during an expected peak enhancement period of the lumen; delayed- phase images were acquired 240 sec after administration of the contrast media.
Anteroposterior and lateral luminal diameters (APD, LD), luminal area (LA), total ves- sel area (TVA), and plaque area (PA) of the aorta were measured on MRI and CT, re- spectively and compared to each other.
Results: A total of 78 slices of the aorta were analyzed. PA, measured on T1-weighted MR images, was significantly greater than PA for both early-phase and delayed-phase CT (p < 0.001). The mean difference in PA was 12.13 ± 5.52 mm2(p < 0.001), 11.51
± 4.37 mm2(p < 0.001), -0.62 ± 3.87 mm2(p = 0.159) for MRI vs. early-phase CT, MRI vs. delayed-phase CT, and early-phase CT vs. delayed-phase CT, respectively.
Conclusion: Different luminal densities by contrast enhancement do not affect the CT measurement of plaque area for the detection of obstructive coronary artery disease.
Index words :Atherosclerosis
Tomography, X-Ray Computed Magnetic Resonance Imaging Aorta, Coronary Diseases Rabbits
With the emergence of multi-detector computed to- mography (MDCT), contrast-enhanced coronary com- puted tomographic (CT) angiography has been widely used for detecting obstructive coronary artery disease (1-3). A unique advantage of CT compared to other non- invasive imaging modalities for the evaluation of coro- nary artery disease is the fact that contrast-enhanced CT shows not only calcified, but also non-calcified athero- sclerotic plaques. Therefore many investigators have studied coronary atherosclerotic plaques by CT (4-8).
However, the detection and measurement of the size and density of plaques are influenced by the strong en- hancement of the arterial lumen, which is required for detecting obstructive coronary artery disease (9).
Compared to CT, magnetic resonance imaging (MRI) is superior in terms of plaque characterization with mul- ti-contrast imaging (10-12). The measurement of plaque size by T1-weighted imagery is not influenced by lumi- nal intensity. However, the current technology of MRI is limited in the evaluation of atherosclerotic plaques in human coronary arteries because of limited spatial and temporal resolution. Therefore, thus far, most studies on atherosclerotic plaques with MRI have used larger plaques in human carotid arteries or atherosclerotic ani- mal models (12-16).
A rabbit’s atherosclerotic aorta is a well-established experimental model for imaging plaques representing those in human coronary arteries because the diameter of rabbit’s aorta is similar to that of human coronary ar- teries and the method for developing an atherosclerotic rabbit model, consisting of a high cholesterol diet and balloon injury technique, has been proven as being effi- cient (8, 17).
In this study, using an atherosclerotic rabbit model, we investigated the effect of the degree of luminal en- hancement on the CT measurement of plaque size on early and delayed CT images compared with T1-weight- ed MRI.
Materials and Methods
Animal Protocol
New Zealand white rabbits (n = 5, weight 3.0 to 3.5 kg, all male) were used for the animal model of athero- sclerosis. Atherosclerotic aortic lesions were induced as previously described (18). The study protocol was ap- proved by our Animal Care and Use Committee.
Magnetic Resonance Imaging
All MR imaging was performed under general anes- thesia of the animals by administering intramuscular tiletamine (20 mg/kg, Zoletil; Virbac, France) and xy- lazine (5 mg/kg, Rompun; Bayer, Korea). The rabbits were imaged in the craniocaudal direction and in the supine position with a 1.5 tesla MRI unit (Achieva, Philips Medical Systems, City, The Netherlands) using a 5-channel cardiac coil. Using a fast spin-echo sequence, sequential 2-dimensional axial T1-weighted images of the aorta measuring 3-mm thick, were obtained from the arch to the iliac bifurcation. The typical parameters included the following parameters: TR/TE= 500/12 msec, field of view = 9 cm, matrix 256 × 256, signal av- erage = 4, and a slice spacing of 9 mm. Fat suppression was applied and the in-plane resolution was 0.35 × 0.35 mm.
Computed Tomography
The CT was performed with a 64-slice multi-detector CT scanner (LightSpeed VCT XT, GE Healthcare). A 21- gauge intravenous access was placed in the ear vein. CT and MRI was performed within 48 hours of each other.
We used a 1:2 dilution of the contrast agent (320mg io- dine/mL) with saline, yielding a concentration of 100- 110 mg iodine per milliliter. With this concentration, the aortic luminal attenuation was similar to that of routine human coronary artery CT angiography (250 to 350 HU).
General anesthesia using intramuscular tiletamine (20 mg/kg, Zoletil; Virbac, France) and xylazine (5 mg/kg, Rompun; Bayer, Korea) was performed for imaging. A CT scan was performed in the craniocaudal direction from the aortic arch to iliac bifurcation in the supine po- sition.
The scan start for early-phase of the study was deter- mined using a real-time bolus-tracking technique. The region of interest (ROI) was drawn in the descending thoracic aorta to monitor a threshold of 100 HU above baseline attenuation. The time delay to start a scan was 4 sec after a threshold trigger of 100 HU was attained. A total of 15 mL of the diluted contrast was administered at a rate of 0.5 mL/sec using an automated infusion pump (Medrad Envision CT, Medrad Inc, Indianola, U.S.A.). Delayed-phase scanning began 240 sec after the administration of contrast media. The 240-sec time point for the delayed phase was selected with the pre- liminary scans of three rabbits, which was visually opti- mal in distinguishing the lumen and plaques.
The imaging parameters were as follows: axial mode, collimation 0.625 mm × 64, 120 kV, 180 mA, and a ro- tation time 0.5s. The total acquisition time ranged from 14 to 17 sec. Axial images were reconstructed with a field of view of 160 × 160 mm, a 512 × 512 matrix, and a slice thickness of 3 mm with a soft convolution kernel compared with a 3-mm thick MRI.
Image Analysis
The MR and CT images were transferred to a dedicat- ed workstation (Aquarius, Terrarecon Inc, San Maeto, U.S.A.) for analysis. CT images were reformatted with a 3-mm thickness in order to match the 3-mm thick MR images. We measured anterior-posterior diameter (APD), lateral diameter (LD), luminal area (LA), and to- tal vessel area (TVA). APD was defined as anterior-pos- terior diameter between the inner margins of the vessel
wall parallel to the anterior-posterior axis of vertebrae.
LD was defined as the orthogonal diameter of APD be- tween the inner margins of the vessel wall.
Measurements for APD, LD, LA, and TVA were manu- ally traced (Fig. 1). Plaque area (PA) was calculated by subtracting LA from TVA. An experienced radiologist performed all the measurements. Measurement on CT was performed with a window setting of 450 and a level setting of 70 for the standardized comparison. Finally the measurements on MR, early-phase CT, and delayed- phase CT images were compared.
Statistical Analysis
The agreement between measurements for APD, LD, LA, and TVA by CT and MRI was evaluated with the Bland-Altman test. The statistical significance of the dif- ferences of each measurement of plaque according to
A B
C
Fig. 1. Measurements. A tracing of the anterior posterior lumi- nal diameter (vertical lines), lateral luminal diameter (horizontal lines), luminal area (inner circles), and total vessel area (outer circles) on T1-weighted MRI (A), early-phase CT (B), and de- layed-phase CT (C).
different imaging methods was assessed using Student’s t-test for paired samples. P-values less than 0.05 were considered to be statistically significant. MedCalc soft- ware (Version 8.2.0.1, Mariakerke, Belgium) was used for the statistical evaluation.
Results
The number of analyzed slices from the five rabbit aortas was 78, while the mean value of the luminal den-
A B
C D
E
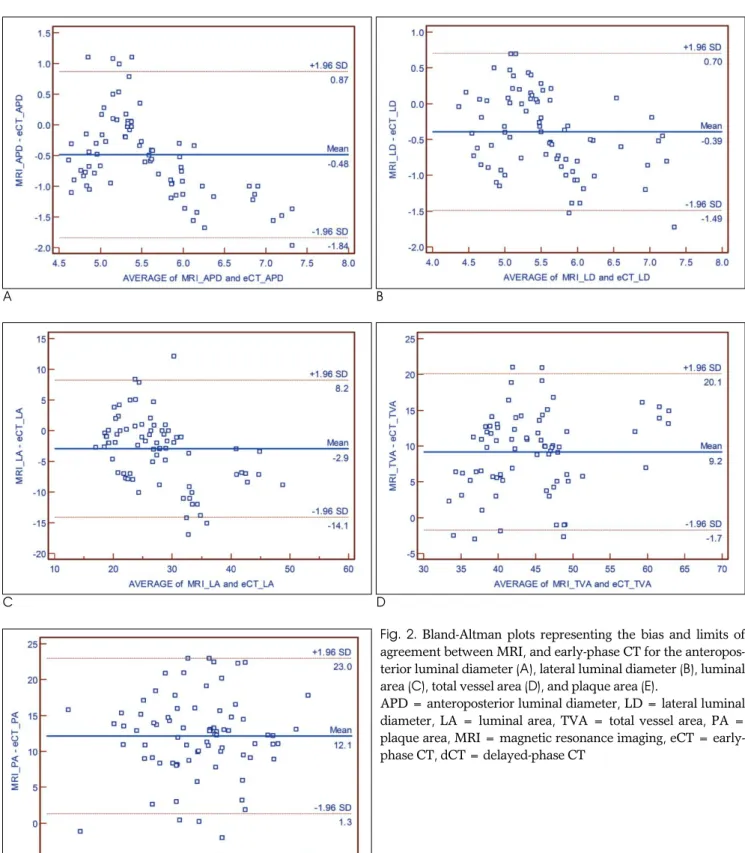
Fig. 2. Bland-Altman plots representing the bias and limits of agreement between MRI, and early-phase CT for the anteropos- terior luminal diameter (A), lateral luminal diameter (B), luminal area (C), total vessel area (D), and plaque area (E).
APD = anteroposterior luminal diameter, LD = lateral luminal diameter, LA = luminal area, TVA = total vessel area, PA = plaque area, MRI = magnetic resonance imaging, eCT = early- phase CT, dCT = delayed-phase CT
sity was 291.8 ± 10.6 HU in early phase CT and 145.4
± 9.2 HU in delayed phase CT.
Table 1 summarized each measurement from differ- ent imaging methods. Significant agreement between MRI and CT measurements was noted for the vessel di-
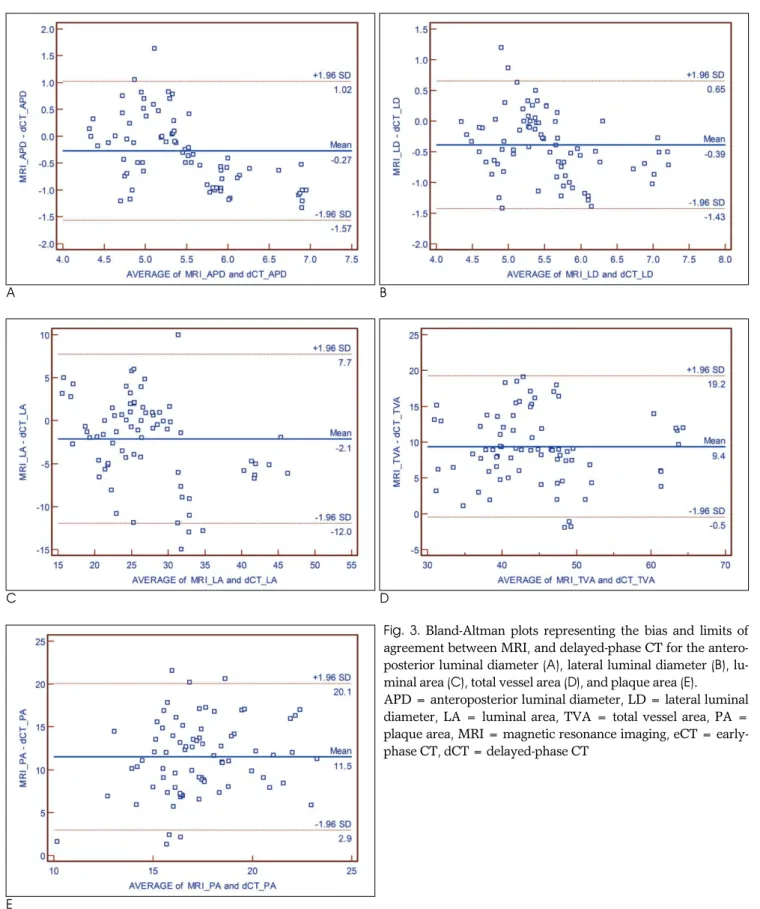
ameters and areas (Figs. 2, 3). The APD, LD, and LA measured on T1-weighted MR images were significantly smaller than those on early-phase CT and delayed-phase CT (p < 0.001). TVA and PA measured on T1-weighted MR images were significantly greater than those on ear-
A B
C D
E
Fig. 3. Bland-Altman plots representing the bias and limits of agreement between MRI, and delayed-phase CT for the antero- posterior luminal diameter (A), lateral luminal diameter (B), lu- minal area (C), total vessel area (D), and plaque area (E).
APD = anteroposterior luminal diameter, LD = lateral luminal diameter, LA = luminal area, TVA = total vessel area, PA = plaque area, MRI = magnetic resonance imaging, eCT = early- phase CT, dCT = delayed-phase CT
ly-phase CT and delayed-phase CT (p < 0.001).
Compared to both early-phase and delayed-phase CT, MRI tended to provide smaller values for APD, LD, LA and larger values for TVA, especially when the dimen- sion was larger.
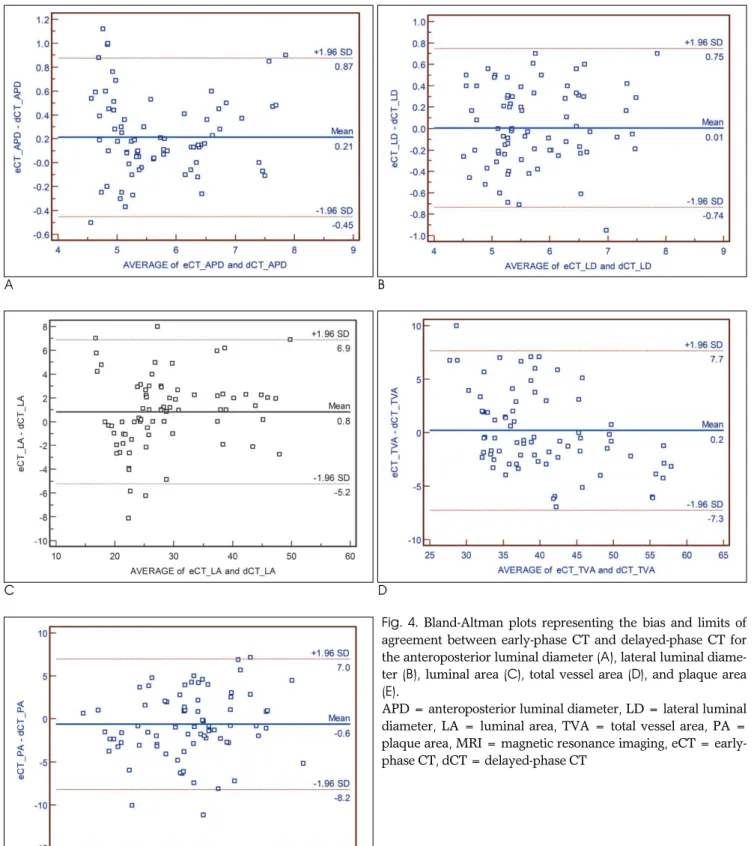
Highly significant agreement was achieved between early-phase and delayed-phase CT measurements of vessel diameters and areas (Fig. 4). APD and LA mea- sured on early-phase CT was significantly greater than those on delayed phase CT (p < 0.001 and p = 0.021, re-
A B
C D
E
Fig. 4. Bland-Altman plots representing the bias and limits of agreement between early-phase CT and delayed-phase CT for the anteroposterior luminal diameter (A), lateral luminal diame- ter (B), luminal area (C), total vessel area (D), and plaque area (E).
APD = anteroposterior luminal diameter, LD = lateral luminal diameter, LA = luminal area, TVA = total vessel area, PA = plaque area, MRI = magnetic resonance imaging, eCT = early- phase CT, dCT = delayed-phase CT
spectively). However, no significant difference in the measurement of LD, TVA, and PA between early-phase CT and delayed-phase CT (p=0.905, 0.641, 0.159, re- spectively).
The mean difference of PA was 12.13 ± 5.52 mm2(p
< 0.001), 11.51 ± 4.37 mm2(p < 0.001), -0.62 ± 3.87 mm2 (p = 0.159) for MRI vs. early-phase CT, MRI vs.
delayed-phase CT, and early-phase CT vs. delayed- phase CT, respectively.
Discussion
With introduction of 64 multi-detector computed to- mography, contrast-enhanced coronary CT angiography enables the detection of obstructive coronary artery dis- ease but also noncalcified plaque (1-8). However, the accuracy of coronary CT to detect non-calcified coro- nary plaque has not been well known.
Many investigators have studied plaque detection and size measurement of coronary arteries on coronary CT angiography compared with intravascular ultrasonogra- phy (IVUS) as the standard reference. The sensitivities and specificities of CT for the detection of coronary artery segments with plaque have been reported as quite high between 80 and 90% and there was close cor- relation between CT and IVUS for a plaque cross-sec- tional area, volume of single plaques, and plaque vol- ume per coronary segment according to the literature (6, 7, 19-20). In the previous study at our institute, while the correlation coefficient for measurements of non-cal- cified plaques between CT and IVUS were relatively high (r = 0.708), CT significantly underestimated the plaque area compared with IVUS (6). The limited spatial resolution of CT accounts for the difficulty in accurately quantifying plaque area by CT. CT may not measure
plaques accurately, especially when their thickness is relatively low. This means that early plaque with diffuse thickening of the coronary arterial wall could not be de- tected by CT.
Furthermore, the detection and measurement of the size of plaques can be influenced by strong enhance- ment of the arterial lumen, which is required for detect- ing obstructive coronary artery disease. Cademartiri et al. (9) reported that the intracoronary attenuation signifi- cantly modified the attenuation of plaques assessed by CT. However, there has been no report describing that intracoronary attenuation affects the measurement of the plaque area as a result of a CT. All the previous stud- ies regarding the measurement of plaque area with CT adopted the coronary artery angiography protocol, which targeted peak enhancement of the arterial lumen to maximize contrast between the lumen and plaque or surrounding tissue, in order to easily detect obstructive coronary lesions. In the present study, we first selected a 240-sec delayed phase that showed visually optimal ar- terial luminal enhancement that distinguished the lu- men and plaques. Then, we compared early phase and delayed phase to identify the influence of luminal densi- ty on the measurement of plaque areas.
The anteroposterior luminal diameter and luminal area measured on early-phase CT were greater than those on delayed-phase CT. Consequently, the plaque areas measured on early phase were smaller than those measured on the delayed phase. However, the differ- ence was not statistically significant. Compared with MRI, both phases of CT underestimated the plaque area. Therefore, both the early-phase CT using the usual coronary CT angiography protocol and the delayed- phase CT, significantly underestimates plaque area compared with MRI.
Table 1. Measurements of Luminal and Lateral Diameters and Luminal, Total Vessel, and Plaque Areas on MRI and CT
APD LD LA TVA PA
T1W-MRI 5.32±0.56 5.33±0.65 26.04±6.40 49.13±8.11 23.08±3.59
eCT 5.80±0.91 5.73±0.85 28.98±8.80 39.93±6.87 10.95±3.46
dCT 5.60±0.90 5.72±0.81 28.16±8.22 39.73±8.51 11.58±2.89
Note.─All numbers represent the mean ± standard deviation.
The unit for numbers is mm2.
T1W-MRI = T1-weighted magnetic resonance image eCT = early-phase CT
dCT = delayed-phase CT
APD = anterior-posterior diameter LD = lateral diameter
LA = luminal area TVA = total vessel area
PA - plaque area, which is calculated by subtracting luminal area from total vessel area
MDCT is now widely used for the detection of coro- nary artery disease including obstructive lesions and non-obstructive non-calcified lesions in clinical practice.
The low incidence of non-calcified plaques in asympto- matic patients with a high risk of coronary artery dis- ease may be explained by the underestimation of non- calcified plaque with CT (6, 7). In particular, the poten- tial utility of CT to monitor plaque change by statin ther- apy may be limited by the low sensitivity of CT for de- tecting non-calcified plaque when it is small.
Limitations of this study were as follows: MRI might underestimate the luminal area because of a blood flow artifact at the peripheral lumen near to the vessel wall, which might be a factor in overestimating the plaque area by MRI. We did not use a pathologic specimen as a standard reference because shrinkage of the vessel wall during formalin fixation after sacrificing the animals was substantial as compared with in vivo images. We did not consider the possibility and influence of plaque enhancement in the delayed phase CT, in which the in- fluence seemed to be minimal in terms of measuring the plaque area. The CT protocol in this study was not the same as the coronary CT angiography in clinical prac- tice. Interobserver and intraobserver agreement were not obtained which was known to be the cause of ~30%
variability for plaque volume in other studies (6, 7, 21, 22). Finally, we did not use control animals to compare the measurement of the vessel wall under normal and atherosclerotic conditions.
Conclusion
Luminal density by contrast enhancement may affect the measurement of the luminal area and plaque area but the difference is not significant. Both early-phase CT and delayed-phase CT significantly underestimate plaque areas compared to MRI. Therefore, visualization and measurement of non-calcified plaques of coronary arteries with CT in clinical practice may not accurately represent significant atherosclerotic changes in the coro- nary arterial wall.
References
1. Mowatt G, Cook JA, Hillis GS, Walker S, Fraser C, Jia X, et al. 64- slice computed tomography angiography in the diagnosis and as- sessment of coronary artery disease: systematic review and meta- analysis. Heart 2008;94:1386-1393
2. Budoff MJ, Dowe D, Jollis JG, Gitter M, Sutherland J, Halamert E, et al. Diagnostic performance of 64-multidetector row coronary
computed tomographic angiography for evaluation of coronary artery stenosis in individuals without known coronary artery dis- ease: results from the prospective multicenter ACCURACY (as- sessment by coronary computed tomographic angiography of indi- viduals undergoing invasive coronary angiography) trial. J Am Coll Cardiol 2008;52:1724-1732
3. Miller JM, Rochitte CE, Dewey M, Arbab-Zadeh A, Niinuma H, Gottlieb I, et al. Diagnostic performance of coronary angiography by 64-row CT. N Engl J Med 2008;359:2324-2336
4. Schepis T, Marwan M, Pflederer T, Seltmann M, Ropers D, Daniel WG, et al. Quantification of non-calcified coronary atherosclerotic plaques with dual-source computed tomography: comparison with intravascular ultrasound. Heart 2010;96:610-615
5. Yang WI, Hur J, Ko YG, Choi BW, Kim JS, Choi D, et al.
Assessment of tissue characteristics of noncalcified coronary plaques by 64-slice computed tomography in comparison with in- tegrated backscatter intravascular ultrasound. Coron Artery Dis 2010;21:168-174
6. Hur J, Kim YJ, Lee HJ, Nam JE, Choe KO, Seo JS, et al.
Quantification and characterization of obstructive coronary plaques using 64-slice computed tomography: a comparison with intravascular ultrasound. J Comput Assist Tomogr 2009;33:186-192 7. Leber AW, Becker A, Knez A, von Ziegler F, Sirol M, Nikolaou K,
et al. Accuracy of 64-slice computed tomography to classify and quantify plaque volumes in the proximal coronary system: a com- parative study using intravascular ultrasound. J Am Coll Cardiol 2006;47:672-677
8. Viles-Gonzalez JF, Poon M, Sanz J, Rius T, Nikolaou K, Fayad ZA, et al. In vivo 16-slice, multidetector-row computed tomography for the assessment of experimental atherosclerosis: comparison with magnetic resonance imaging and histopathology. Circulation 2004;110:1467-1472
9. Cademartiri F, Mollet NR, Runza G, Bruining N, Hamers R, Somers P, et al. Influence of intracoronary attenuation on coronary plaque measurements using multislice computed tomography: ob- servations in an ex vivo model of coronary computed tomography angiography. Eur Radiol 2005;15:1426-1431
10. Yuan C, Kerwin WS, Ferguson MS, Polissar N, Zhang S, Cai J, et al. Contrast-enhanced high resolution MRI for atherosclerotic carotid artery tissue characterization. J Magn Reson Imaging 2002;15:52-67
11. Zaho XQ, Phan BA, Chu B, Bray F, Moore AB, Polissar NL, et al.
Testing the hypothesis of atherosclerotic plaque lipid depletion during lipid therapy by magnetic resonance imaging: study design of carotid plaque composition study. Am Heart J 2007;154:239-246 12. Cai J, Hatsukami TS, Ferguson MS, Kerwin WS, Saam T, Chu B, et
al. In vivo quantitative measurement of intact fibrous cap and lipid-rich necrotic core size in atherosclerotic carotid plaque: com- parison of high-resolution, contrast-enhanced magnetic resonance imaging and histology. Circulation 2005;112:3437-3444
13. Briely-Saebo KC, Mulder WJ, Mani V, Hyafil F, Amirbekian V, Aguinaldo JG, et al. Magnetic resonance imaging of vulnerable atherosclerotic plaques: current imaging strategies and molecular imaging probes. J Magn Reson Imaging 2007;26:460-479
14. Kerwin WS, Zhao X, Yuan C, Hatsukami TS, Maravilla KR, Underhill HR, et al. Contrast-enhanced MRI of carotid atheroscle- rosis: dependence on contrast agent. J Magn Reson Imaging 2009;30:35-40
15. Dong L, Wang J, Yarnykh VL, Underhill HR, Neradilek MB, Polissar N, et al. Efficient flow suppressed MRI improves inter- scan reproducibility of carotid atherosclerosis plaque burden mea- surements. J Magn Reson Imaging 2010;32:452-458
16. Helft G, Worthley SG, Fuster V, Zaman AG, Schechter C, Osende JI, et al. Atherosclerotic aortic component quantification by nonin- vasive magnetic resonance imaging: an in vivo study in rabbits. J Am Coll Cardiol 2001;37:1149-1154
17. Courtman DW, Schwartz SM, Hart CE. Sequential injury of the rabbit abdominal aorta induces intramural coagulation and lumi- nal narrowing independent of intimal mass: extrinsic pathway in- hibition eliminates luminal narrowing. Cir Res 1998;82:996-1006 18. Choi BW, Hur J, Lee HJ, Kim YJ, Kim TH, Choe KO. Gadolinium-
enhanced magnetic resonance imaging of atherosclerotic plaques in comparison with histopathology: an in vivo study in aorta of rabbits. J Korean Soc Magn Reson Med 2009;13:81-87
19. Petranovic M, Soni A, Bezzera H, Loureiro R, Sarwar A, Raffel C, et al. Assessment of nonstenotic coronary lesions by 64-slice multi- detector computed tomography in comparison to intravascular ul-
trasound: evaluation of nonculprit coronary lesions. J Cardiovasc Comput Tomogr 2009;3:24-31
20. Sun J, Zhang Z, Lu B, Yu W, Yang Y, Zhou Y, et al. Identification and quantification of coronary atherosclerotic plaques: a compari- son of 64-MDCT and intravascular ultrasound. AJR Am J Roentgenol 2008;190:748-754
21. Hoffmann H, Frieler K, Hamm B, Dewey M. Intra- and interob- server variability in detection and assessment of calcified and non- calcified coronary artery plaques using 64-slice computed tomog- raphy: variability in coronary artery plaque measurement using MSCT. Int. J Cardiovasc Imaging 2008;24:735-742
22. Pflederer T, Schmid M, Ropers D, Ropers U, Komatsu S, Daniel WG, et al. Interobserver variability of 64-slice computed tomogra- phy for the quantification of non-calcified coronary atherosclerotic plaque. Rofo 2007;179:953-957
대한영상의학회지 2010;63:329-337
CT를 이용한 비석회화 죽상경화반의 측정에 있어서 내강의 조영 정도가 미치는 영향에 대한 실험적 연구: T1 강조 자기공명영상과의 비교1
1연세대학교 의과대학 영상의학과, 심장혈관병원 심장영상의학과, 방사선의과학 연구소
2연세대학교 의과대학 강남세브란스병원 영상의학과
최병욱∙허 진∙이혜정∙김영진∙김태훈2∙최규옥
목적: 혈관 내강의 조영증강 정도가 CT에서 경화반의 크기의 측정에 영향을 미치는지 알아보기 위하여 조기와 지연 기 조영증강 CT를 T1-강조 MRI와 비교하였다.
대상과 방법: 뉴질랜드 흰토끼 5마리의 죽상경화증 대동맥을 이용하였다. T1-강조 영상과 이중 주기 조영증강 CT 를 촬영하였다. 조기 CT는 예상되는 내강의 최대 조영증강기에 영상을 얻었고 지연기는 조영제 주입 후 240초 후에 영상을 얻었다. MRI와 CT에서 각각 대동맥의 전후 좌우 내강지름(APD, LD), 내강면적(LA), 혈관전체면적 (TVA), 경화반면적(PA)을 측정하고 서로 비교하였다.
결과: 총 78개의 대동맥 절편을 분석하였다. T1-강조 MRI에서 측정한 PA는 조기와 지연기 CT에서 측정한 값보 다 유의하게 컸다(p < 0.001). 측정 PA의 평균 차이는 MRI와 조기 CT에서 12.13 ± 5.52 mm2 (p < 0.001), MRI와 지연기 CT에서, 11.51 ± 4.37 mm2(p < 0.001), 조기 CT와 지연기 CT에서 -0.62 ± 3.87 mm2 (p = 0.159)였다.
결론: 조영증강에 의한 혈관내강 밀도의 차이는 경화반면적의 측정에 영향을 미치지 않는다.