Predicting Soil Chemical Properties with Regression Rules from Visible-near Infrared Reflectance Spectroscopy
Suk Young Hong*, Kyungdo Lee, Budiman Minasny
1, Yihyun Kim
2, and Byung Keun Hyun Department of Agricultural Environment, National Academy of Agricultural Science, RDA, Wanju, Korea
1
Faculty of Agriculture and Environment, The University of Sydney, Sydney, Australia
2
Research Policy Bureau, Rural Development Administration(RDA), Jeonju, Korea
(Received: October 13 2014, Revised: October 23 2014, Accepted: October 23 2014)
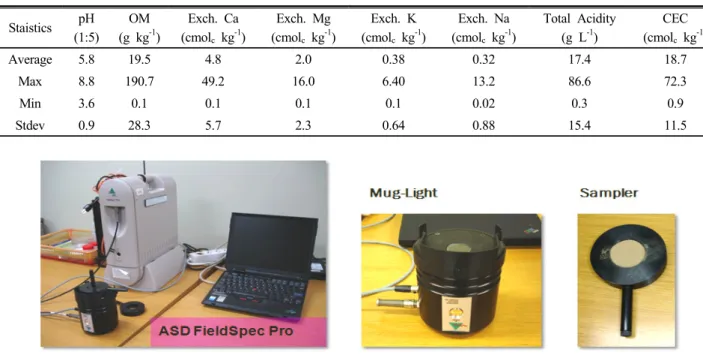
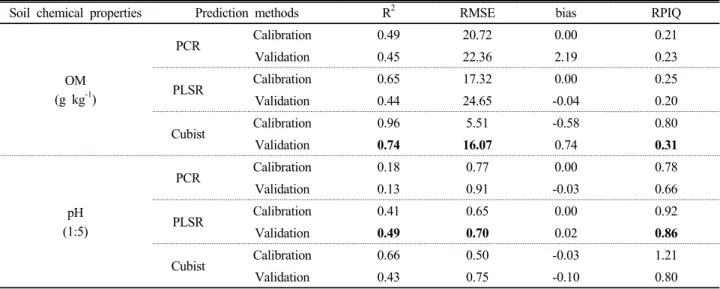
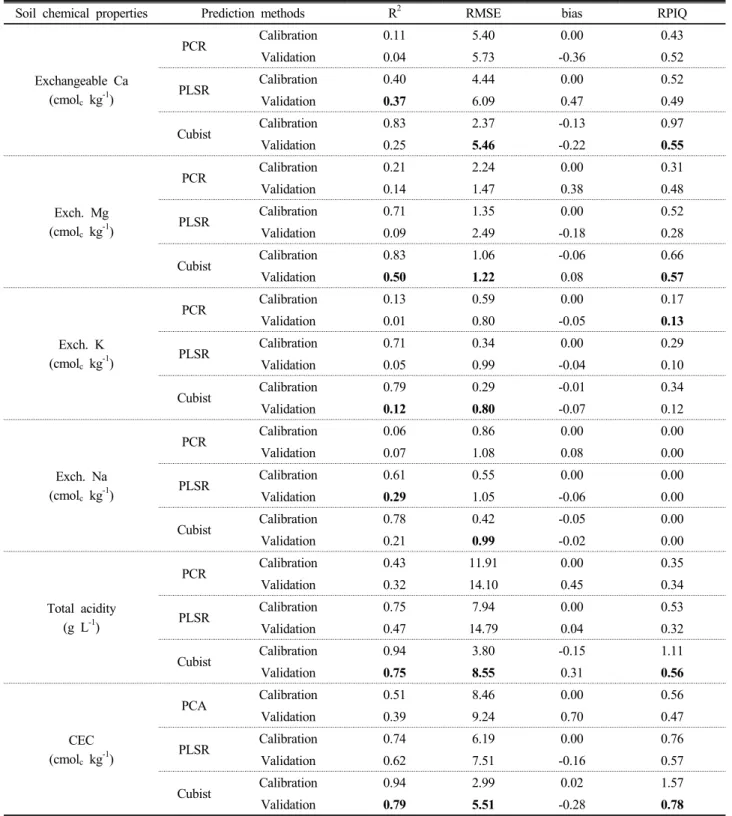
This study investigates the prediction of soil chemical properties (organic matter (OM), pH, Ca, Mg, K, Na, total acidity, cation exchange capacity (CEC)) on 688 Korean soil samples using the visible-near infrared reflectance (VIS-NIR) spectroscopy. Reflectance from the visible to near-infrared spectrum (350 to 2500 nm) was acquired using the ASD Field Spec Pro. A total of 688 soil samples from 168 soil profiles were collected from 2009 to 2011. The spectra were resampled to 10 nm spacing and converted to the 1st derivative of absorbance (log (1/R)), which was used for predicting soil chemical properties. Principal components analysis (PCA), partial least squares regression (PLSR) and regression rules model (Cubist) were applied to predict soil chemical properties. The regression rules model (Cubist) showed the best results among these, with lower error on the calibration data. For quantitatively determining OM, total acidity, CEC, a VIS-NIR spectroscopy could be used as a routine method if the estimation quality is more improved.
Key words: Soil chemical properties, visible-near infrared reflectance, spectroscopy, PCA, PSLR, Cubist
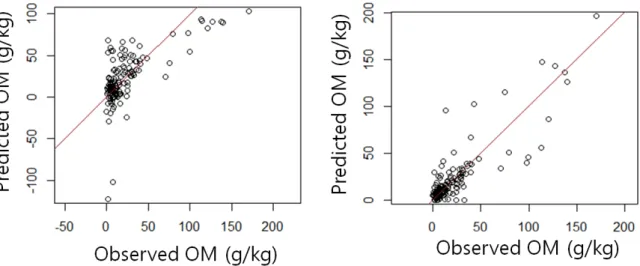
Scatter plot of PLSR (left) and Cubist (right) models with validation dataset to predict OM.
1)
*Corresponding author : Phone: +82632382510, Fax: +82632383823, E-mail: [email protected]
§