*Corresponding author : Chang-Sug Lee, The industrial R&D center, Korea Spectral Products, KSP, Seoul 152-779, Korea. Tel: +82-2-2109-8871, E-mail: [email protected]
2014년 6월 30일 투고, 2014년 9월 10일 심사완료, 2014년 9월 25일 게재확정
예측알고리즘 적용을 위한 데이터세트 구성이 근적외선 분광광도계를 이용한 옥수수 품질평가에 미치는 영향
최성원1⋅이창석1*⋅박창희1⋅김동희1⋅박성권2⋅김법균3⋅문상호4
1코리아스펙트랄프로덕츠(주), 2농촌진흥청 국립축산과학원,
3건국대학교 동물자원학과, 4건국대학교 식품생명과학부
The Effect of Representative Dataset Selection on Prediction of Chemical Composition for Corn kernel by Near-Infrared
Reflectance Spectroscopy
Sung-Won Choi1, Chang-Sug Lee1*, Chang-Hee Park1, Dong-Hee Kim1, Sung-Kwon Park2, Beob-Gyun Kim3, Sang-Ho Moon4
1Korea Spectral Products, Seoul 152-779, Korea,
2National Institute of Animal Science, RDA, Suwon 441-706, Korea,
3Department of Animal Science and Technology, Konkuk University, Seoul 143-701, Korea,
4Division of Food Bio Science, Konkuk University, Chungju 380-701, Korea
ABSTRACT
The objectives were to assess the use of near-infrared reflectance spectroscopy (NIRS) as a tool for estimating nutrient compositions of corn kernel, and to apply an NIRS-based indium gallium arsenide array detector to the system for collecting spectra and analyzing calibration equations using equipments designed for field application. Partial Least Squares Regression (PLSR) was employed to develop calibration equations based on representative data sets. The kennard-stone algorithm was applied to induce a calibration set and a validation set. As a result, the method for structuring a calibration set significantly affected prediction accuracy. The prediction of chemical composition of corn kernel resulted in the following (kennard-stone algorithm: relative) moisture (R2=0.82, RMSEP=0.183), crude protein (R2=0.80, RMSEP=0.142), crude fat (R2=0.84, RMSEP=
0.098), crude fiber (R2=0.74, RMSEP=0.098), and crude ash (R2=0.81, RMSEP=0.048). Result of this experiment showed the potential of NIRS to predict the chemical composition of corn kernel.
(Key words : Chemical composition, Corn kernel, Kennard-Stone, NIRS, PLSR)
서 론
국내 동물사료 관련한 주요 현안은 수입
사료의 높은 의존성으로 인한 국내 사료의 자급생산 노력과 시장 활성화방안 논의로 이 에 따른 사료 품질평가에 대한 관심이 지속
적으로 늘어가고 있다. 그 예로 식량자원 및 동물사료의 대표적 에너지원인 옥수수는 에 탄올 산업의 급팽창으로 관련 산업 및 유통 시장 확대로 보다 높은 품질이 요구되고 섭 취하는 동물의 성장 및 비용측면에서 매우 중요하나 품질을 분석하는 이화학적 분석 기 술이 시간적, 경제적 비용이 많이 요구되어 져 새로운 신속기법 개발이 절실히 요구되고 있는 상황이다.
근적외선 분광법(Near infrared Spectroscopy, NIRS)을 이용한 분석방법은 Karl Norris (1976) 등에 의해 농산물의 수분, 단백질 분 석을 최초로 시도하였으며 스캐닝 모노크로 미터(UV/Vis/NIR spectrophotometer, Cary14) 방식의 상업용 분광광도계 이용확대와 광학 기술의 발전으로 상업화 가능한 장치로 발전 해 왔다. 1970년대 이후 다변량 통계분석으 로 화학적 성분 및 구조를 분석 가능함이 보 고되며 기계학습 및 패턴인식 기법들이 근적 외선 스펙트럼에서 화학적 정보를 해석하는 방법으로 연구 되었으며 화학실험에서 얻은 데이터로부터 수학적, 통계학적 모형으로 화 학적 정보를 추출 할 수 있는 계량분석화학 (Chemometrics)이라는 이름으로 분석법이 태 동하게 되었다. 그 후 컴퓨터기술 발전으로 다양한 기법 개발 및 학술연구로 보다 다양 한 분야에 확대 적용 되며 각 분야에 맞는 기법 적용 및 평가가 필요하다(Varmuza and Filzmoser, 2009).
국내에서는 이 등(2009)이 근적외선 분광 법을 이용한 사초의 성분 추정 실험결과 ADF와 NDF의 R2는 0.94로 성공적으로 성분 추정이 가능하였음을 입증한 바 있으며 Park 등(2006)은 볏짚의 CP, CF, NDF, ADF에 대 한 검량식을 개발하고 근적외선 분광법의 실 용성 여부를 보고한 바 있으며 Park 등 (2004)이 조사료 가치 평가에 근적외선 분광
법을 활용하는 등의 연구가 꾸준히 진행되고 있다.
본 연구는 근적외선 분광법을 이용한 옥수 수의 신속한 품질평가 방법의 가능성을 확인 하고 분석정확도 향상을 위한 근적외선 검량 식 개발을 위하여 수행하였다.
재료 및 방법 1. 시료 및 성분 분석
본 연구를 위해 브라질, 아르헨티나를 포 함한 남아메리카 원산지로 한 시료 당 약 500 g, 총 63점의 옥수수 원료사료 시료를 획 득하였다. 성분 분석은 한국사료협회 (Korea Feed Association)의 도움으로 AOAC (2005) 방법에 의해 수분(Moisture), 조단백질 (Crude Protein), 조지방(Crude Fat), 조섬유 (Crude Fiber), 조회 분(Crude Ash)을 측정하였고 성분 분석 결과 는 근적외선 분광광도계로 측정된 스펙트럼 과의 선형적인 상관관계를 찾을시 필요한 것 으로 예측 알고리즘을 이용한 분석법 적용 시 결과의 기준분석 역할을 하는데 사용하 였다.
2. 근적외선 분광광도계 분석
시료는 입자사이즈 영향을 최소화하기 위 하여 분쇄기(Sample Mill)를 이용하여 분쇄한 후 표준체를(Stainless sieve, 1 mm) 이용하여 물리적 전처리를 하였다. 전처리된 시료는 원형구조의 시료 컵에 약 10 g 정도 충진 시 켜 열전냉각(Thermoelectric cooling)을 포함한 InGaAs (silicon and indium gallium arsenide) 어레이 디텍터로 구성된 반사용 근적외선 분 광광도계(Korea Spectral Products, DAF2000, Korea)를 이용하여 900~2100 nm의 범위에
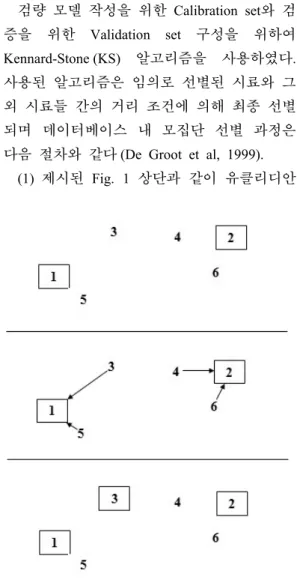
Fig. 1. Schematic overview of the principal of Kennard-Stone Sample selection.
서 3반복 측정하여 산술평균 후 보간법 (Interpolation)을 이용하여 1 nm의 간격으로 변환하여 흡광도(log 1/R: absorbance) 스펙트 럼을 획득하였다.
시료 컵에 적용된 광 윈도우 재료는 Coring 7980 fused silica를 사용하고 반사체 (Reflector) 는 반사율이 높은 골드로 코팅하여 사용하 였다.
3. 검량 모델 작성 및 성능 평가
(1) 검량 모델 작성
다 변량 회귀 분석법 중 하나인 부분 최소 자승 회귀 분석법(Partial Least Square Regression:
PLSR)은 획득된 근적외선 스펙트럼 데이터 에서 화학성분 정보를 추출하기 위한 것으로 (Gemperline, 2006) 근적외선 분광 광도계에 서 획득한 스펙트럼 독립변수(X)와 기준분석 에 의해 측정된 화학적 정보 종속변수(Y) 사 이에 존재하는 관계를 수학적, 통계적 방법 에 의해 검량 모델을 유도하는 분석 방법이 다(Martens and Naes, 1990).
PLSR법은 데이터베이스 독립변수들을 정 보의 손실 없이 가능한 적은 주성분으로 축 소함으로 주성분분석(PCA) 과정과 유사하나 종속변수도 동시에 함께 고려함으로써 변수 들 간의 높은 상관에 의한 설명력 감소에 따 른 다중공성선 문제를 해결 할 수 있는 방법 으로 요인(Factor)수 증가에 따른 잔차(Residual) 와의 비교로 최적의 검량 모델이 작성된다.
본 연구에서 검량 모델 작성은 오픈소스 소프트웨어인 R (ver. 3.1.0)을 이용하였다.
(2) 성능 평가
개발된 검량 모델의 정확도는 예측된 값이 실측값을 얼마나 잘 설명하고 있는 지를 나 타내는 것으로 모델 작성에 사용되지 않은
미지의 시료들로 검증하며 결정계수(coefficient of determination: R2)와 측정오차 (root mean square error of calibration.: RMSEC, root mean square error of prediction: RMSEP)로 표현되 고 결정계수는 1에 가까울수록 측정오차는 0 에 가까울수록 검량 모델의 정확도가 높은 것으로 판단했다.
4. 데이터 세트 선별
검량 모델 작성을 위한 Calibration set와 검 증을 위한 Validation set 구성을 위하여 Kennard-Stone (KS) 알고리즘을 사용하였다.
사용된 알고리즘은 임의로 선별된 시료와 그 외 시료들 간의 거리 조건에 의해 최종 선별 되며 데이터베이스 내 모집단 선별 과정은 다음 절차와 같다(De Groot et al, 1999).
(1) 제시된 Fig. 1 상단과 같이 유클리디안
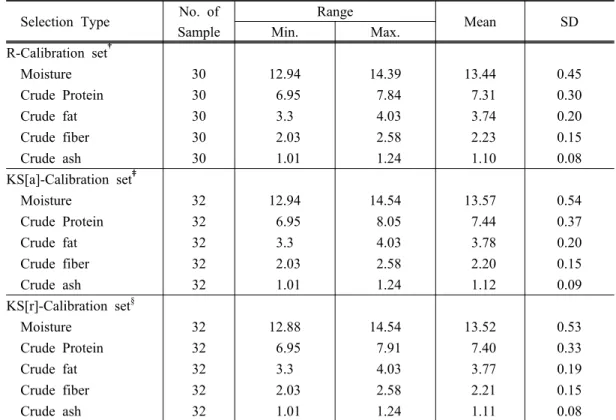
Table 1. Distribution of chemical compositions of selected calibration sets of samples in complete data sets.
Selection Type No. of Range
Mean SD
Sample Min. Max.
R-Calibration set†
Moisture 30 12.94 14.39 13.44 0.45
Crude Protein 30 6.95 7.84 7.31 0.30
Crude fat 30 3.3 4.03 3.74 0.20
Crude fiber 30 2.03 2.58 2.23 0.15
Crude ash 30 1.01 1.24 1.10 0.08
KS[a]-Calibration set‡
Moisture 32 12.94 14.54 13.57 0.54
Crude Protein 32 6.95 8.05 7.44 0.37
Crude fat 32 3.3 4.03 3.78 0.20
Crude fiber 32 2.03 2.58 2.20 0.15
Crude ash 32 1.01 1.24 1.12 0.09
KS[r]-Calibration set§
Moisture 32 12.88 14.54 13.52 0.53
Crude Protein 32 6.95 7.91 7.40 0.33
Crude fat 32 3.3 4.03 3.77 0.19
Crude fiber 32 2.03 2.58 2.21 0.15
Crude ash 32 1.01 1.24 1.11 0.08
Min = minimum, Max = maximum, SD = standard deviation.
†R-Calibration set: randomly selected sample set in complete calibration set;
‡KS[a]-Calibration set: absolutely selected sample set using Kennard-Stone (KS) algorithms;
§ KS[r]-Calibration set: relatively selected sample set using Kennard-Stone (KS) algorithms.
거리(Euclidean distance)를 이용하여 가장 거 리가 먼 2개의 샘플을 선정한다.
(2) 그 외 남은 샘플들은 (1)에 의해 선택 된 샘플수와 같게 그룹화 되어 저장된다.
(3) 저장된 그룹 중 가장 거리가 짧은 샘 플이 소속된 그룹을 선택한다.
(4) 제시된 Fig. 1 하단과 같이 선택된 그 룹 내 가장 거리가 먼 샘플을 새로운 샘플로 선택한다.
요구되어진 샘플 개수에 도달 할 때 위 제 시된 절차를 반복하며 Kennard-Stone (KS) 알 고리즘은 두 개의 같은 특징을 가지는 그룹 으로 분할하는데 유용하게 사용될 수 있다.
KS 알고리즘 분석은 Rapid Miner (Rapid Miner
Studio6.0)를 이용하고 relative법과 absolute법 을 이용하여 각각 선별하였다.
결과 및 고찰 1. 데이터 세트 특성
본 연구에 사용된 옥수수의 수분, 조단백 질, 조지방, 조섬유, 조회분의 성분분포와 평 균 및 표준편차는 Table 1과 같다. 검량 모델 작성에 사용되는 데이터 세트는 구성에 따라 예측 결과 정확도에 기인하는 효과가 크다.
Chin (1998) 등은 적절한 사이즈 및 샘플 선 별 시 중요성을 강조하며 측정 대상의 화학
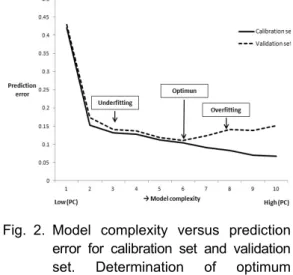
Fig. 2. Model complexity versus prediction error for calibration set and validation set. Determination of optimum complexity (number of Factor) of PLSR Model for Crude fat.
적 성분과 분광스펙트럼의 특성들을 고르게 포함해야 한다 하였다. 또한 De Groot (1999) 등에 의해 새로운 검량모델 개발 및 시스템 재구성 시 재측정(recalibration)은 필연적이므 로 데이터 세트 내 양질의 데이터 선택은 추 후 많은 노동과 비용을 절감하는데 도움이 될 것이라 하였다.
데이터세트 구성을 고려치 않은 조건으로 총 63개의 옥수수 시료 중 약 절반 정도를 무작위로 선별하여 R-Calibration set (30개)로 구성하였고 데이터세트의 효율적 구성을 위 해 KS 알고리즘을 사용하여 각 시료별로 거 리에 의한 특성이 가장 크게 반영되는 그룹 으로 선택되게 calibration set (KS[a]-Calibration set=32개, KS[r]-Calibration set=32개)를 구성하 였다. 구성에 선별되지 못한 시료는 각각 validation set로 구성하도록 하여 성능평가에 사용됨으로써 calibration set와는 유사성이 떨 어지는 그룹임으로 성능평가 시 검량 모델의 견고성 여부의 판단에 보다 효과적이게 하였 다. Table 1의 데이터 세트 특성은 KS[a]- Calibration set와 KS[r]-Calibration set가 R- Calibration set 보다 성분범위가 보다 넓게 구 성 되었으며 표준편차가 0.45(R-Calibration set) 보다 0.54(KS[a]-Calibration set), 0.53(KS[r]- Calibration set)로 크게 나타나 KS 알고리즘 이 데이터 세트의 고른 구성에 효과가 있음 이 나타났다.
2. 모델 복잡도
검량 모델 개발에서 최적의 PLSR 요인 (factor) 수를 결정하는 것은 중요한 과정중의 하나로써 방법으로는 Leave-one-out cross validation (LOOCV) 및 Bootstrap (Varmuza and Filzmoser 2009)을 사용하며 적용 케이스로는 Validation set로 요인 수를 점차적으로 늘려
가며 예측 오차(Prediction error)로써 성능을 평가한다.
조지방 검량 모델 개발에 사용된 최적의 요인 수는 Fig. 2와 같으며 Calibration set는 요인 수 증가에 따른 예측 오차는 0에 가깝 게 수렴해 갔으며 Validation set는 요인 수 6 에서 예측 오차가 최소로 나타났고 그 이상 의 요인 수에서는 예측 오차가 커짐으로써 과적합으로 인한 문제가 나타났다. 예측 오 차가 가장 적은 요인수를 모델 개발에 사용 하며 수분, 조단백질, 조섬유, 조회분에도 동 일 방법을 적용하였다.
3. 검량 모델 평가
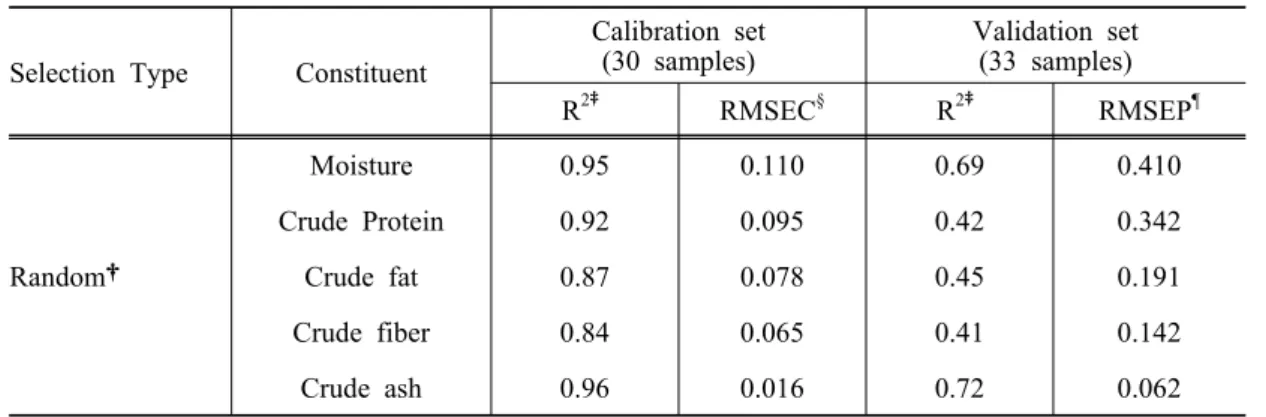
Table 2에서 보는 바와 같이 Validation set 는 조회분(R2=0.70)과 수분 (R2=0.69)을 제외 한 나머지 성분은 R2값(<0.5)이 낮은 정확도 로 나타났고 RMSEP 값이 최소 0.062에서 최 대 0.410으로 RMSEC 보다 높은 오차를 보 였다. Calibration set 검증할시 전체적으로 높 은 R2와 낮은 RMSEC 결과가 나타났으나 미 지의 샘플조합인 Validation set로 검증할시
Table 2. The prediction results if the randomly selected calibration set is applied.
Selection Type Constituent
Calibration set
(30 samples) Validation set (33 samples) R2‡ RMSEC§ R2‡ RMSEP¶
Random†
Moisture 0.95 0.110 0.69 0.410
Crude Protein 0.92 0.095 0.42 0.342
Crude fat 0.87 0.078 0.45 0.191
Crude fiber 0.84 0.065 0.41 0.142
Crude ash 0.96 0.016 0.72 0.062
†Random: the randomly selected calibration set by RapidMiner Studio 6.0.
‡R2: coefficient of determination.
§ RMSEC: root mean square error of calibration.
¶ RMSEP: root mean square error of prediction.
Table 3. The prediction results if the Kennard-stone algorithm is applied.
Kennard-Stone
Algorithm Constituent
Calibration set
(32 samples) Validation set (31 samples)
R2§ RMSEC¶ R2§ RMSEP∮
Absolute†
Moisture 0.87 0.181 0.82 0.192
Crude Protein 0.84 0.143 0.78 0.172
Crude fat 0.86 0.099 0.82 0.103
Crude fiber 0.75 0.087 0.72 0.098
Crude ash 0.82 0.043 0.80 0.048
Calibration set
(32 samples) Validation set (31 samples)
R2§ RMSEC¶ R2§ RMSEP∮
Relative‡
Moisture 0.83 0.182 0.82 0.183
Crude Protein 0.81 0.142 0.80 0.142
Crude fat 0.85 0.096 0.84 0.098
Crude fiber 0.76 0.093 0.74 0.098
Crude ash 0.82 0.043 0.81 0.048
†Absolute: The required sample size of calibration set.
‡Relative: The required sample ratio of calibration set (sample ratio: 0.5).
Sample ratio: the fraction of calibration set which should be sampled.
§ R2: coefficient of determination.
¶ RMSEC: root mean square error of calibration.
∮RMSEP: root mean square error of prediction.
R2와 RMSEP의 결과가 크게 낮아지는 것으 로 보아 검량 모델 개발을 위한 데이터 세트 로써 견고함이 떨어지는 것으로 나타났다.
Table 3에서 보는 바와 같이 Absolute 방식 으로 조섬유(R2=0.75)를 제외한 나머지 성분 들은 R2값(>0.8) 이상으로 나타났고 RMSEP 값이 최소 0.048에서 최대 0.192로 나타났다.
Relative 방식 역시 조섬유 (R2=0.76)을 제외한 나머지 성분들 R2값(>0.8) 이상으로 RMSEP 값 최소 0.048 최대 0.183으로 두 선별방식 모두 Random 방식보다 우수한 예측 결과가 나타났다. RMSEP와 RMSEC가 큰 차이를 보 이지 않는 것으로 보아 KS 알고리즘을 이용 한 방법이 미지의 샘플에 대한 견고성이 높 은 검량 모델 작성에 효과적인 것으로 나타 나 본 연구에서 사용된 데이터 선별 방법이 검량 모델을 이용한 사료 성분 예측정확도 향상에 기여를 하는 것으로 나타났다.
결 론
본 연구는 데이터세트 구성에 따라 근적외 선 분광법을 이용한 옥수수 화학적 성분결과 에 미치는 영향을 평가하기 위해 수행 하였 다. 데이터세트 구성은 Random 방법, relative KS 알고리즘 방법, absolute KS 알고리즘 방 법으로 하였으며 PLSR법을 이용하여 검량모 델을 작성하였다. 예측결과 옥수수 모든 화 학적 성분에서 KS 알고리즘 방법을 적용할 시 결과의 정확도가 높게 나타나 제시된 방 법이 데이터세트의 대표성 확보에 보다 유리 한 것으로 나타났다. 근적외선 분광법을 이 용한 옥수수 성분 분석이 신속 정확하게 이 용 가능함의 여부가 이번 연구로 확인되었고 분석정확도 향상을 위해 보다 다양한 범위의 시료 확보와 처리기법에 추가 연구가 필요하 다고 생각된다.
사 사
본 논문은 농촌진흥청 공동연구사업(과제 번호: PJ907038)의 지원에 의해 이루어진 것 임.
인 용 문 헌
1. AOAC. 2005. Official methods of analysis (16th ed.), Association of Official Analytical Chemist, Arlington, VA. Washington D.
C., USA.
2. Chin, W.W. 1998. The Partial Least Squares Approach to Structural Equation Modeling. Modern Methods for Business Research. NJ: Lawrence Erlbaum Associates.
Mahwah. pp. 295-336.
3. De Groot, P.J., Postma, G.J., Melssen, W.J. and Buydens, L.M.C. 1999. Selecting a representative training set for the classification of demolition waste using remote NIR sensing. Analytical chimica acta. 392:67-75.
4. Lee, H.W., Kim, J.D., Kim, W.H. and Lee, J.K. 2009. Prediction on the quality of forage crop by near infrared reflectance spectroscopy. Journal of The Korean Society of Grassland Science. 29(1):31-36.
5. Martens, H. and Naes, T. 1990. Multivariate calibration. Journal of Chemometrics. 4(6):
441.
6. Norris, K.H., Barnes, R.E.F., Moore, J.E.
and Shenk, J.S. 1976. Predicting forages quality by infrared reflectance spectroscopy.
Journal of Animal Science. 43:889-897.
7. Park, H.S., Lee, J.K. and Lee, H.W. 2004.
Applications of Near Infrared Reflectance
Spectroscopy (NIRS) in Forage Evaluation.
Journal of The Korean Society of Grassland Science. 24(1):81-90.
8. Park, H.S., Lee, J.K., Lee, H.W., Hwang, K.J., Jung, H.Y. and Ko, M.S. 2006.
Effect of sample preparations on prediction of chemical composition for corn silage by near infrared reflectance spectroscopy. Journal of The Korean Society of Grassland Science.
26(1):53-62.
9. Paul Gemperline. 2006. Practical Guide To Chemometrics, Second Edition. Taylor&Francis Group. London. pp. 168-211.
10. Varmuza, K. and Filzmoser, P. 2009.
Introduction to Mutivariate Statistical Analysis in Chemometrics. Taylor & Francis Group.
USA. pp. 103-190.