Clinical T3 (cT3) prostate cancer is present in 12-40% of all patients who are newly diagnosed with prostate cancer.1-3Although the gold standard for treating these patients remains controversial, the optimal management of locally advanced prostate cancer should be individually tailored based on the clinical stage, the biopsy Gleason sum (GS) and the prostate specific antigen (PSA) level, as well as the patient’s age, co-morbidities, and personal preference. Until recently, definite radical prostatectomy (RP) has not been considered as the standard treatment for cT3 high risk prostate cancer which has grown beyond the periprostatic tissue or seminal vesicles without lymph node invasion or distant metastases.1Because RP
Can We Predict Real T3 Stage Prostate Cancer in Patients with Clinical T3 (cT3) Disease
before Radical Prostatectomy?
Hye Won Lee,
1Seong Il Seo,
2Seong Soo Jeon,
2Hyun Moo Lee,
2and Han Yong Choi
21Department of Integrative Bioscience and Biotechnology, Pohang University of Science and Technology, Pohang;
2Department of Urology, Samsung Medical Center, Sungkyunkwan University School of Medicine, Seoul, Korea.
Purpose:Down-staging of clinical T3 (cT3) prostate cancer after radical prosta- tectomy (RP) is not uncommon due to the inaccuracy of the currently available staging modalities, although selected down-staged cT3 patients can be a candidate for definitive RP. We identified the significant predictors for down-staging of cT3 after RP. Materials and Methods:We included 67 patients with cT3 stage prostate cancer treated with radical perineal prostatectomy (RPP) between 1998 and 2006 and reviewed their medical records retrospectively. The clinical stage was obtained according to the DRE, the prostate biopsy findings, and the prostate MRI. Results:
Fifty three (79%) patients with cT3 prostate cancer were down-staged to pT2 after RP. The percent of positive cores had the strongest association with down-staging of cT3 [p = 0.01, odds ratio (OR) = 6.3], followed by baseline prostate specific antigen (PSA) (p = 0.03, OR = 5.0), the biopsy Gleason sum (GS) (p = 0.03, OR = 4.7), and the maximum tumor volume of the positive cores (p = 0.05, OR = 4.0).
When the cut-off points of significant parameters which were a PSA < 10 ng/mL, a percent of positive cores ≤ 30%, a maximum tumor volume of the positive cores
≤ 75% and GS ≤ 7 were combined, the sensitivity, specificity, and positive predictive value were 0.25%, 1.00%, and 100%, respectively. Conclusion:The percent of positive cores ≤ 30%, serum PSA < 10 ng/mL, the biopsy GS ≤ 7, and the maximum tumor volume of the positive cores ≤ 75% were the significant predictors of down-staging cT3 disease after RP.
Key Words: Prostate cancer, staging, cT3, MRI
Received: July 1, 2009 Revised: October 1, 2009 Accepted: November 4, 2009 Corresponding author: Dr. Seong Il Seo, Department of Urology, Samsung Medical Center, Sungkyunkwan University School of Medicine, 50 Irwon-dong, Gangnam-gu, Seoul 135-710, Korea.
Tel: 82-2-3410-3556 , Fax: 82-2-3410-3027 E-mail: [email protected]
∙The authors have no financial conflicts of interest.
© Copyright:
Yonsei University College of Medicine 2010 This is an Open Access article distributed under the terms of the Creative Commons Attribution Non- Commercial License (http://creativecommons.org/
licenses/by-nc/3.0) which permits unrestricted non- commercial use, distribution, and reproduction in any medium, provided the original work is properly cited.
INTRODUCTION
cured only a minority of patients when applied as a mono- therapy, the combination of hormonal treatment (HT) with radiotherapy (RT) was previously considered state of the art for the management of cT3 disease.
However, down-staging (pT2) or up-staging (pT4 or pN+) after RP is not a rare clinical error due to the inade- quate diagnostic accuracy of the preoperative staging evaluation, and in one study, the proportion of clinical over-staging was reported to be 27% of all the hormone- naive cT3 patients.2Several authors reported very good long-term outcomes after surgery as the initial treatment for locally-advanced prostate cancer, especially in the case of over-staged patients with cT3 prostate cancers.2,3The favorable cancer-specific survival rate and the overall survival rate after RP at the 10-yr follow-up for patients with cT3 disease were reported to be > 75% and 60%, res- pectively, in previous studies.4Similarly, Freedland, et al.
reported that among 56 patients who had clinical stage T3a disease treated by RP alone by a single surgeon between 1987 and 2003, PSA-free survival at 15 years after surgery was 49% and metastasis-free survival and cause-specific survival at 15 years after surgery were 73% and 84%, res- pectively.5But the evaluation of the Surveillance, Epide- miology, and End Results database reveals that only 9% of men with locally advanced, nonmetastatic disease are treated surgically (± HT), and even for men with a long life-expectancy.5Although Partin tables which use a com- bination of preoperative PSA, biopsy GS, and clinical stages are the most widely used tool to predict final pathol- ogical staging after RP for organ-confined tumors, rare useful preoperative predictive parameters for locally ad- vanced disease are available.6In addition, retrospective data show that the patients who are young and have organ confined diseases demonstrate the best postoperative results in terms of curative and erectile function.7If over- staged cT3 prostate cancer could be reliably identified be- fore determining the treatment plan by clinical parameters, these predictors could be used as selection criteria of patients that can benefit from RP and can be a candidate for nerve-preservation. In this study, we found the useful predictors for down-staging of cT3 after RP and evaluated the determined predictors’ diagnostic efficacy at specific cut-off points.
Sixty-seven patients with cT3 prostate cancer that were treated with radical perineal prostatectomy (RPP) at our institution between 1998 and 2006 were included in this study. We reviewed the patients’ medical records, retro- spectively, and excluded patients with a history of neo-
adjuvant HT or RT. The routine preoperative clinical stag- ing work-up included taking the history and a physical examination that included a digital rectal examination (DRE), determining the serum baseline PSA level, the trans- rectal ultrasound (TRUS) guided prostate biopsy, MRI, and bone scan.
The serum PSA level was determined on an ambulatory basis prior to biopsy with the Hybritech, Tosoh, or Abbot assay. All the prostate biopsies were performed using a standard 18 gauge biopsy gun and the number of biopsy sites ranged from six to ten with additional targeted biopsies when a hypoechoic or suspicious lesion existed. For each needle biopsy, certain variables were assessed, including the GS, the percent of tumor as a function of all the biopsy tissue, the number of cancer positive cores and the total number of cores from all the biopsy sites.
MRI was performed using a whole-body 3-T MR scanner with pelvic phasedarray coil and were performed accord- ing to the same protocol. All MRI studies were performed more than 3-4 weeks after prostate biopsy to reduce the possibility of post-biopsy artifacts. All data were evaluated by two experienced radiologists with knowledge of clinical data PSA, biopsy GS, and DRE findings. We considered the MRI findings in determining clinical stage and cT3 disease was defined as a state with suspicious extra-capsular extension (ECE) or seminal vesicle invasion (SVI) in the MRI. The following criteria were used for the diagnosis of ECE: tumor tissue in the extraprostatic tissue, obliteration of the rectoprostatic angle, bulging of the prostate contour caused by tumor, asymmetry or direct involvement of the neurovascular bundles, thickening, retraction or irregularity of the prostate capsule, disruption of the prostatic capsule adjacent to the tumor, and stranding of the periprostatic fatty tissue.8,9The criterion for seminal vesicle invasion was abnormal asymmetric low signal intensity within the lumen on T2-weighted images. All the prostates from RP were examined while they were still fresh by a pathologist.
Routine sections of all the surgical margins, including the prostatic base, apex and peripheral zone, the capsule and periprostatic soft tissue, seminal vesicle, urethra, and blad- der neck were examined on permanent staining. Based on these findings, ECE, SVI, and/or positive surgical margins (PSM) were recorded. Diseases extending into but not through the prostatic capsule were considered negative for ECE.
Univariate analysis of the clinical characteristics between the down-staged cT3 group and the non down-staged group after RP was assessed by Student t-test, Mann- Whitney U-test, and chi-square test. A logistic regression multivariate analysis was performed to evaluate the ability of the preoperative PSA level, the PSA density (PSAD:
PSA divided by prostate volume measured with TRUS),
MATERIALS AND METHODS
and the prostate biopsy findings, including the biopsy GS, the percent of positive cores, and the maximum tumor volume of the positive cores to predict down-staging after RP. The receiver operating characteristics (ROC) curve analysis derived area under the curve (AUC) estimates determined the cut-off points of each predictor, and their sensitivity, specificity, and positive predictive value (PPV) were then analyzed. The SPSS version 17.0®(SPSS Inc, Chicago, IL, USA) for Windows was used for statistical analysis and a probability (p) level of less than 0.05 was considered statistically significant.
Of the total 67 patients with cT3 stage disease, 79% (n = 53) were down-staged after RPP and neurovascular bundle saving technique was applied to 10 (15%) patients (unila- teral: 2, bilateral: 8). Among the 53 down-staged patients,
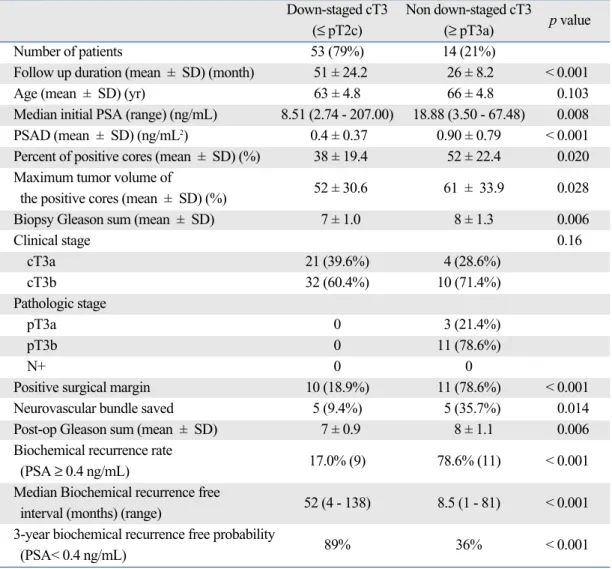
21 (39.6%) and 32 (60.4%) patients were cT3a (positive ECE) and cT3b (positive seminal vesicle invasion), respec- tively. Table 1 summarizes the comparative analysis of clinical and pathological features between the down-staged group and non down-staged group after RPP. In the 53 down-staged patients, 10 (18.9%) patients had a positive surgical margin in their post-prostatectomy specimen com- pared to 11 (78.6%) patients in the non down-staged group (p < 0.001). The nerve-sparing rate was significantly dif- ferent between the down-staged group (9.4%) and non down-staged group (35.7%) (p = 0.014). When the PSA cut-off value of 0.4 ng/mL was used as the definition of biochemical recurrence, oncologic outcomes including pos- toperative biochemical recurrence rate (17.0% vs. 78.6%, p
< 0.001), biochemical recurrence free interval (52 months vs. 8.5 months, p < 0.001), and 3-year biochemical recur- rence free probability (89% vs. 36%, p < 0.001) showed meaningfully better results in the down-staged group com- pared to the non down-staged group.
RESULTS
Table 1. Univariate Analysis of the Clinical and Prostate Needle Biopsy Findings as a Function of the Down- Staging after Radical Prostatectomy
Down-staged cT3 Non down-staged cT3
p value
(≤ pT2c) (≥ pT3a)
Number of patients 53 (79%) 14 (21%)
Follow up duration (mean ± SD) (month) 51 ± 24.2 26 ± 8.2 < 0.001
Age (mean ± SD) (yr) 63 ± 4.8 66 ± 4.8 0.103
Median initial PSA (range) (ng/mL) 8.51 (2.74 - 207.00) 18.88 (3.50 - 67.48) 0.008
PSAD (mean ± SD) (ng/mL2) 0.4 ± 0.37 0.90 ± 0.79 < 0.001
Percent of positive cores (mean ± SD) (%) 38 ± 19.4 52 ± 22.4 0.020 Maximum tumor volume of
52 ± 30.6 61 ± 33.9 0.028
the positive cores (mean ± SD) (%)
Biopsy Gleason sum (mean ± SD) 7 ± 1.0 8 ± 1.3 0.006
Clinical stage 0.16
cT3a 21 (39.6%) 4 (28.6%)
cT3b 32 (60.4%) 10 (71.4%)
Pathologic stage
pT3a 0 3 (21.4%)
pT3b 0 11 (78.6%)
N+ 0 0
Positive surgical margin 10 (18.9%) 11 (78.6%) < 0.001
Neurovascular bundle saved 5 (9.4%) 5 (35.7%) 0.014
Post-op Gleason sum (mean ± SD) 7 ± 0.9 8 ± 1.1 0.006
Biochemical recurrence rate
17.0% (9) 78.6% (11) < 0.001 (PSA ≥ 0.4 ng/mL)
Median Biochemical recurrence free
52 (4 - 138) 8.5 (1 - 81) < 0.001 interval (months) (range)
3-year biochemical recurrence free probability
89% 36% < 0.001
(PSA< 0.4 ng/mL)
PSA, prostate specific antigen; PSAD, prostate specific antigen density.
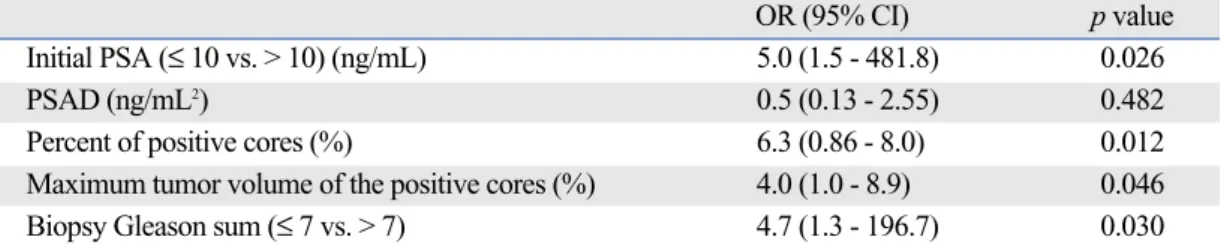
The baseline PSA level (p < 0.001), PSAD (p < 0.001), the biopsy GS (p = 0.01), the percent of positive cores (p = 0.02), and the maximum tumor volume of the positive cores (p = 0.03) showed significant differences on univariate analysis between the down-staged cT3 prostate cancer group and the other group. But after multivariate logistic regression analysis, the percent of positive cores had the strongest association with down-staging of cT3 disease [p
= 0.01, odds ratio (OR) = 6.3, 1.86 ≤ 95% CI ≤ 8.0], and this was followed by the preoperative PSA level (p = 0.03, OR = 5.0, 1.5 ≤ 95% CI ≤ 481.8), the biopsy GS (p = 0.03, OR = 4.7, 1.3 ≤ 95% CI ≤ 196.7), and the maximum tumor volume of the positive cores (p = 0.05, OR = 4.0, 1.0 ≤ 95% CI ≤ 8.9) (Table 2).
The ROC curve analysis demonstrated the largest AUC for the preoperative PSA (0.832), and this was followed by the biopsy GS (0.706), the percent of positive cores (0.687), and the maximum tumor volume of the positive cores (0.592) (Fig. 1). Table 3 lists the sensitivity, specificity, and
Table 2. Multivariate Analysis of the Clinical and Biopsy Findings for Predicting the Down-Staging of Clinical T3 Prostate Cancer
OR (95% CI) p value
Initial PSA (≤ 10 vs. > 10) (ng/mL) 5.0 (1.5 - 481.8) 0.026
PSAD (ng/mL2) 0.5 (0.13 - 2.55) 0.482
Percent of positive cores (%) 6.3 (0.86 - 8.0) 0.012
Maximum tumor volume of the positive cores (%) 4.0 (1.0 - 8.9) 0.046
Biopsy Gleason sum (≤ 7 vs. > 7) 4.7 (1.3 - 196.7) 0.030
PSA, prostate specific antigen; PSAD, prostate specific antigen density.
Table 3. The Sensitivity, Specificity, PPV, and NPV at Each Cut-Off Value of the Preoperative Predictors for Predicting Down-Staging of Clinical T3 Prostate Cancer
Cut-off value Sensitivity Specificity PPV (%) NPV (%)
Preoperative PSA (ng/mL)
10 0.698 0.857 94.87 42.86
20 0.925 0.286 81.67 42.86
Percent of positive cores (%)
30 0.358 1.000 100.00 29.17
50 0.717 0.571 86.36 34.78
75 0.943 0.143 84.65 40.00
Maximum tumor volume of the positive cores (%)
25 0.264 0.786 82.35 28.21
50 0.415 0.714 83.33 24.32
75 0.660 0.500 83.33 28.00
Biopsy Gleason sum
6 0.019 1.000 87.5 25.58
7 0.396 0.786 88.23 50.00
Combination of a PSA level <10 ng/mL and a percent of positive core ≤ 30% and a maximum tumor volume of the positive core ≤ 75% and a biopsy Gleason sum ≤ 7
0.245 1.000 100.00 25.93
PPV, positive predictive value; NPV, negative predictive value; PSA, prostate specific antigen.
Fig. 1. The ROC curve analysis of each clinical parameter for predicting down- staging of clinical T3 prostate cancer area under curve (AUC). Preoperative PSA, 0.832; Biopsy Gleason sum (GS), 0.706; Percent of positive cores, 0.687;
Maximum tumor volume of the positive cores, 0.592. ROC, receiver operating characteristics; PSA, prostate specific antigen.
PPV at the cut-off value of each predictor for down-staging cT3 disease. Among the 28 (42%) patients with an initial PSA level ≤ 10 ng/mL, only 57% were down-staged accor- ding to the radical prostatectomy specimen. But if the pre- op PSA level was less than 10 ng/mL, then 95% of the patients would have had a pathological stage ≤ pT2. If the cut off value of the percent of positive cores was deter- mined as 30%, then the sensitivity, specificity, and PPV were 0.36, 1.00, and 100% in contrast to 0.94, 0.14, and 85%, respectively, when the percent of positive cores was determined as 75%. In addition, the sensitivity, specificity, and PPV were 0.66, 0.50, and 83%, respectively, at a 75%
maximum tumor volume of the positive core and these values were 0.40, 0.79 and 88%, respectively, at a biopsy GS of 7. Finally, when the cut-off points of significant parameters which were a PSA < 10 ng/mL, a percent of positive cores ≤ 30%, a maximum tumor volume of the positive cores ≤ 75% and GS ≤ 7 were combined, then the sensitivity, specificity, and PPV were determined to be 0.25, 1.00, and 100%, respectively.
The treatment goal for locally-advanced prostate cancer is to potentially cure the disease, prolong the biochemical progression-free or metastasis-free survival, and improve the quality of life. Although RP has been generally recom- mended for patients with a PSA < 20 ng/mL, a disease stage ≤ cT3a and a biopsy GS ≤ 8, RP could be an alterna- tive choice which has acceptable surgery-related morbidity for selected patients with cT3 disease if the improved sur- gical techniques such as radical extirpation and extended lymph node dissection were performed and, especially if these patients were down-staged to pT2 after RP. Although definitive surgery is not very popular in treating cT3 disease, recent studies have presented very convincing long-term outcomes after surgery as primary treatment, with 5- and 10-year overall survival of 75-97.6% and 60-94.8%, and 5- and 10-year cancer specific survival of 85-100% and 57- 90%, respectively.2,3,10,11
In several factors influencing the outcome in cT3 pros- tate cancer, the pathologic stage eventually has an impor- tant influence in postoperative cancer control.12,13The results of our study supported this by showing better oncol- ogic surgical outcomes in the down-staged group after RP compared to the non down-staged group. Despite various efforts to enhance the accuracy of the prediction of non- organ confined diseases, the down-staging rate of cT3 diseases is known to be about 17-30% and these patients could be candidates for RP according to the generally accepted standards.13,14Predictive algorithms based on multi-
variate regression analysis and neural networks are su- perior to standard empirical methods of clinical staging and they have been validated in several studies.12 Although currently, DRE, biopsy GS, and serum PSA alone or in combination do not accurately predict disease extent for the individual patient, a combination of all three has been recommended as a basis of predictive algorithms for pros- tate cancer staging. Partin tables, a pretreatment table using the combination of preoperative serum PSA, biopsy GS, and clinical stage are the most widely used tools to predict the final histopathology in clinically organ-confined disease (stage cT1c-cT2c) and have been demonstrated to be more accurate than any single clinical staging method alone.7 Since the introduction of these nomograms at Johns Hop- kins Hospital, the presence of pathologically non-organ- confined cancers has dropped from about two-thirds in the prenomogram era to less than half, and the incidence of either seminal vesicle involvement or pelvic lymph node metastasis decreased from 20% to 10%.
However, predictive nomograms which can provide a basis for decision-making and patient counseling before treating clinically locally-advanced prostate cancer is still lacking. Our study used the combination of baseline PSA level and biopsy findings including GS, the percent of positive cores, and finally the maximum tumor volume of the positive cores to predict down-staging after RP in this study. In one recent study, patients were divided into three PSA subgroups (≤ 10 ng/mL, > 10-20 ng/mL, and > 20 ng/mL) and two GS subgroups [≤ 7 (3 + 4) and ≤ 7 (4 + 3)]
and the table stratifies patients into six demarcated risk groups.15While in the first group, consisting of patients with PSA ≤ 10 ng/mL and GS ≤ 7 (3 + 4), under-staging was only 6% (5% pT3b and 1% pT4), in the sixth group consisting of patients with PSA > 20 ng/mL and GS ≤ 7 (4 + 3), under-staging was as high as 68% (44% pT3b and 22% pT4). They reported accurate predictive ability of the table for SVI (AUC 0.73, 0.653 ≤ 95% CI ≤ 0.803) and for adjacent structure involvement (AUC 0.80, 0.732 ≤ 95%
CI ≤ 0.860) in ROC analysis. Veltri and co-workers com- bined serum PSA levels, patients’ age, the number of posi- tive biopsy cores, the percentage of tumor involvement in a core, GS, the presence of a Gleason grade of 4 or 5, and the tumor location by sextant biopsy to predict disease extent on the basis of multivariate regression analysis and reported a sensitivity of 91% and 53% and a specificity of 41% and 94% for the prediction of organ confinement and advanced disease, respectively. Moreover, several neural networks, which can define nonlinear patterns between predictor variables more precisely than linear statistical models, have been introduced to predict disease extent.9,16
The preoperative PSA level, the biopsy GS, the percent of positive cores, and the maximum tumor volume of the
DISCUSSION
positive cores were determined to be the significant pre- dictors of down-staging in our study. When the cut-off points of the PSA was < 10 ng/mL, the percent of the positive cores was ≤ 30%, the maximum tumor volume of the positive cores was ≤ 75%, and the biopsy GS was ≤ 7, and all these were combined, the sensitivity, specificity, and PPV were 0.25, 1.00, and 100%, respectively. The PSA value has been known to generally be correlated with the cancer volume, GS, ECE, and the occurrence of lymph node metastases. For example, one study showed that a PSA level > 10 ng/mL has a sensitivity, specificity, and PPV of 61%, 88%, and 88% for the detection of ECE, respectively.17Narayan, et al. established probability plots that can predict the presence of ECE, seminal vesicle in- volvement, and lymph node metastases using PSA level.18 In addition, according to previous studies, the percent of positive cores or the maximum tumor volume of the positive cores in the needle biopsy may provide excellent informa- tion for disease extent. In a study of 207 patients, the extent of cancer in the needle biopsy, as defined by the percent of positive cores and the maximum tumor volume of the positive cores, is strongly predictive of pathological organ-confined diseases and the tumor volume at radical prostatectomy.19For example, patients with 1 tumor posi- tive biopsy of 6 biopsies or the tumor volume of the posi- tive biopsy less than 5% had an approximately 10% or less risk of ECE. The number of positive cores is jointly predic- tive of ECE in a model incorporating the PSA level, the clinical stage, and the GS; therefore, a model to predict organ-confined disease should incorporate the extent of the tumor in the needle biopsy.20Finally, patients with a GS 8 or 9 at the time of the needle biopsy were almost 12 times as likely to have ECE at prostatectomy compared with those patients with a GS ≤ 6.21Similarly, our data showed that a patient with a biopsy GS ≤ 7 was 4.7 times as likely to be down-staged to ≤ pT2 (p = 0.03, 1.3 ≤ 95% CI ≤ 196.7) and the sensitivity, specificity, and PPV were 0.66, 0.50, and 83%, respectively. But although the GS, the extent of carcinoma in the biopsy specimen, and the presence of perineural invasion are significant indicators of either the tumor volume or the pathologic stage, a previous model that used these biopsy findings still revealed an inadequate ability to predict the tumor volume and stage at RP.19And high GS prostate cancer patients confined to the prostate at histopathologic examinations have an excellent oncologic outcome after RP.22Thus, ancillary markers, including DNA ploidy or MIB-I, have been suggested as a new factor that can enhance the ability to predict clinically significant out- comes.23,24
All the patients diagnosed with prostate cancer at our institution routinely underwent a prostate MRI and we con- sidered MRI findings to determine the clinical TNM stag-
ing, especially ≤ cT3 stage and treatment options instead of DRE. Despite the introduction of new imaging techniques and the refinement of existing techniques, it remains diffi- cult to stage accurately in the preoperative period between organ confined and locally advanced diseases. Ohori, et al.
reported that the PPV and NPV for detecting ECE were 74% and 64%, respectively, for DRE, and in another study, the PPV and NPV of MRI for identifying ECE ranged from 66% to 82% and from 30% to 90%, respectively.25,26 The wide variation in the reliability of DRE and MRI for determining the presence of ECE may come from the oper- ator-dependent examinations, which depend on the pers- onal skill and the interpretation of the test results by the investigator. Although standard clinical staging evaluation does not considers MRI but DRE, clinical assessment by DRE and the measurement of the PSA level is not accurate in determining the local stage, with underestimations in as many as 40-60% of cases.27The sensitivity of DRE alone in diagnosing non organ-confined diseases is poor: 20- 40% of men with nonpalpable diseases and 50-75% of men with palpable clinical stage T2 tumors have extrapros- tatic diseases at surgery and over-staging occurs in 10-20%
of men with clinically non organ-confined diseases.28There- fore, accurate staging with additional imaging methods is an important issue for correct management of prostate cancer patients.
Among these imaging techniques, MRI is considered to play an important role in local staging of prostate cancer and the role of MRI of the prostate has been debated exten- sively in previous studies. In fact, the low sensitivity of MRI for the detection of local extension (20-70%) or lymph node metastasis (0-15%) also limits their usefulness in clinical staging and their use was eliminated in patients with PSA levels of < 20 ng/mL, which have a less than 1%
probability of lymph node involvement. However, recently, with the introduction of new MR sequences, new coils, and other technical developments instead of initially MR imaging using a conventional body coil with limited anato- mical resolution, the diagnostic capability of MRI imaging in preoperative staging of prostate cancer was reported as a maximum combined sensitivity and specificity of 71% in a meta-analysis of all published studies evaluating the per- formance of MR imaging in the local staging of prostate cancer.29In another prospective study to compare the accu- racy in predicting pathological stage in patients intended for RP between 3-Tesla (T) MRI and the Partin tables, 3T MRI showed a high accuracy (85.2%) for the staging of clinically localized prostate cancer, and it was significantly more accurate in predicting the final pathological stage than the Partin tables.30In the present study, 53 (79%) pati- ents were down-staged as ≤ pT2 after RP and this high rate could be explained partly by the fact that we included clini-
cal staging based on the MRI findings before the techni- ques of prostate MRI were refined for satisfactory diagno- stic accuracy. In addition, we selectively preformed RP for the cT3 patients who had a low PSA level and fair biopsy findings, although the imaging work-up was suspicious for ECE or SVI, and this also could have caused the high down-staging rate. Although an MRI can be incorporated in the clinical work up of prostate cancer, there are several limitations associated with local staging of the prostate by an MRI. For example, a hemorrhage due to a biopsy can show areas of low signal intensity that are similar to pros- tate cancer and so this causes discrepancies between the MRI and histopathology results. Moreover, an MRI cannot detect microscopic invasion and none of the currently ava- ilable imaging modalities allow for the detection of micro- scopic invasion.8The recent introduction of multi-slice dynamic contrast enhanced MRI and 1H MR spectroscopy to dynamic MRI has achieved significant improvement for tumor visualization and the staging performance for deter- mining the presence of tumor extension by reducing the inter-observer variability.31,32 Of the total 67 patients with cT3 stage disease, the neurovascular bundle saving techni- que was applied to 10 (15%) patients (unilateral: 2, bilateral:
8) in our study. The patient parameters for performing
“safe” nerve-sparing surgery are controversial and generally, those who are young and have organ-confined diseases were considered optimal candidates in terms of the rates of achieving a cure and maintaining a proper erectile function.7 Various clinical parameters have recently been investigat- ed as potential selection criteria to define the cancer-specific safety of nerve-sparing surgery. Graefen, et al. proposed that only well-differentiated cancer in the preoperative biopsy and a maximum of one positive core on the evaluat- ed side could be safe and more applicable criteria for nerve- sparing RP.33The preoperative biopsy criteria includes moderate grade unilateral tumors of patients having at least three biopsy cores on the non-cancerous side in one study.34 However, there are no official guidelines whether or not to perform a nerve-sparing RP because of multifocality and heterogeneity of prostate cancer; our results could be care- fully considered when the nerve-sparing technique was performed in RP for cT3 patients.
This study involved a small study population of a single institution within a long duration and preoperatively staged prostate cancer based on MRI findings, which is not usually used or considered in traditional clinical T staging. In addi- tion, RP was performed in a proportion of patients with cT3 prostate cancer, so the findings of this study could not be generalized in all cT3. Finally, although our study classi- fied those patients with ≤ pT2 disease and positive surgical margins as a down-staged group because the surgical margin involvement was not considered in the pathological
staging, their prostate cancer was not organ-confined and so these pathology findings could affect the prognosis after RP. However, models promising performance for one group of patients do not guarantee utility in another group and differences in race, age, and comorbidity and variations in retrieval and interpretation of clinical data may interfere with an algorithm’s predictive performance. A larger, ran- domized, multi-center study may provide promising an- swers for constructing highly accurate models or algori- thms that attempt to predict the down-staging at RP, and these models or algorithms would incorporate the biopsy findings and the newly developed and refined staging modalities. Also, these models can be proved as safe para- meters for nerve preservation by analyzing the oncologic outcomes when they are considered in further studies.
1. Schröder FH, van den Ouden D. Management of locally advanced prostate cancer. 2. Radiotherapy, neoadjuvant endocrine treat- ment, update 1997-1999. World J Urol 2000;18:204-15.
2. Ward JF, Slezak JM, Blute ML, Bergstralh EJ, Zincke H. Radical prostatectomy for clinically advanced (cT3) prostate cancer since the advent of prostate-specific antigen testing: 15-year outcome.
BJU Int 2005;95:751-6.
3. [Radical prostatectomy as monotherapy for locally advanced prostate cancer (T3a): 12 years follow-up.] Arch Esp Urol 2004;
57:679-92.
4. Casey JT, Meeks JJ, Greco KA, Wu SD, Nadler RB. Outcomes of locally advanced (T3 or greater) prostate cancer in men un- dergoing robot-assisted laparoscopic prostatectomy. J Endourol 2009;23:1519-22.
5. Freedland SJ, Partin AW, Humphreys EB, Mangold LA, Walsh PC. Radical prostatectomy for clinical stage T3a disease. Cancer 2007;109:1273-8.
6. Partin AW, Kattan MW, Subong EH, Walsh PC, Wojno KJ, Oesterling JE, et al. Combination of prostate-specific antigen, clinical stage, and Gleason score to predict pathological stage of localized prostate cancer. A multi-institutional update. JAMA 1997;277:1445-51.
7. Stamatiou K, Sofras F. Is the presence of perineural and periva- scular invasion a risk factor for positive surgical margins during neurovascular bundle preservation radical prostatectomy proce- dure? Urol Int 2007;79:189-90.
8. Fütterer JJ. MR imaging in local staging of prostate cancer. Eur J Radiol 2007;63:328-34.
9. Rørvik J, Halvorsen OJ, Albrektsen G, Ersland L, Daehlin L, Haukaas S. MRI with an endorectal coil for staging of clinically localized prostate cancer prior of radical prostatectomy. Eur Radiol 1999;9:29-34.
10. van den Ouden D, Hop WC, Schröder FH. Progression in and survival of patients with locally advanced prostate cancer (T3) treated with radical prostatectomy as monotherapy. J Urol 1998;
160:1392-7.
11. Van Poppel H, Goethuys H, Callewaert P, Vanuytsel L, Van de Voorde W, Baert L. Radical prostatectomy can provide a cure for
REFERENCES
well-selected clinical stage T3 prostate cancer. Eur Urol 2000;
38:372-9.
12. Reckwiz T, Potter SR, Partin AW. Prediction of locoregional extension and metastatic disease in prostate cancer: a review.
World J Urol 2000;18:165-72.
13. van den Ouden D, Davidson PJ, Hop W, Schröder FH. Radical prostatectomy as a monotherapy for locally advanced (stage T3) prostate cancer. J Urol 1994;151:646-51.
14. Rannikko S, Salo JO. Radical prostatectomy as treatment of localized prostatic cancer. Early results, with special focus on transrectal ultrasound for local staging. Scand J Urol Nephrol 1990;24:103-7.
15. Joniau S, Hsu CY, Lerut E, Van Baelen A, Haustermans K, Roskams T, et al. A pretreatment table for the prediction of final histopathology after radical prostatectomy in clinical unilateral T3a prostate cancer. Eur Urol 2007;51:388-94.
16. Tewari A, Narayan P. Novel staging tool for localized prostate cancer: a pilot study using genetic adaptive neural networks. J Urol 1998;160:430-6.
17. Ehreth JT, Miller JI, McBeath RB, Hansen KK, Ahmann FR, Dalkin BL, et al. Prostate-specific antigen obtained under optimal conditions determines extracapsular adenocarcinoma of the prostate. Br J Urol 1995;75:21-5.
18. Narayan P, Gajendran V, Taylor SP, Tewari A, Presti JC Jr, Lei- dich R, et al. The role of transrectal ultrasound-guided biopsy- based staging, preoperative serum prostate-specific antigen, and biopsy Gleason score in prediction of final pathologic diagnosis in prostate cancer. Urology 1995;46:205-12.
19. Sebo TJ, Bock BJ, Cheville JC, Lohse C, Wollan P, Zincke H.
The percent of cores positive for cancer in prostate needle biopsy specimens is strongly predictive of tumor stage and volume at radical prostatectomy. J Urol 2000;163:174-8.
20. Egawa S, Suyama K, Matsumoto K, Satoh T, Uchida T, Kuwao S, et al. Improved predictability of extracapsular extension and seminal vesicle involvement based on clinical and biopsy findings in prostate cancer in Japanese men. Urology 1998;52:433-40.
21. Sebo TJ, Cheville JC, Riehle DL, Lohse CM, Pankratz VS, Myers RP, et al. Predicting prostate carcinoma volume and stage at radical prostatectomy by assessing needle biopsy specimens for percent surface area and cores positive for carcinoma, perineural invasion, Gleason score, DNA ploidy and proliferation, and preo- perative serum prostate specific antigen: a report of 454 cases.
Cancer 2001;91:2196-204.
22. Ohori M, Goad JR, Wheeler TM, Eastham JA, Thompson TC, Scardino PT. Can radical prostatectomy alter the progression of poorly differentiated prostate cancer? J Urol 1994;152:1843-9.
23. Cheng L, Sebo TJ, Cheville JC, Pisansky TM, Slezak J, Bergstralh
EJ, et al. p53 protein overexpression is associated with increased cell proliferation in patients with locally recurrent prostate carcinoma after radiation therapy. Cancer 1999;85:1293-9.
24. Ahlgren G, Falkmer U, Gadaleanu V, Abrahamsson PA. Evalua- tion of DNA ploidy combined with a cytometric proliferation index of imprints from core needle biopsies in prostate cancer.
Eur Urol 1999;36:314-9.
25. Ohori M, Egawa S, Shinohara K, Wheeler TM, Scardino PT.
Detection of microscopic extracapsular extension prior to radical prostatectomy for clinically localized prostate cancer. Br J Urol 1994;74:72-9.
26. McSherry SA, Levy F, Schiebler ML, Keefe B, Dent GA, Mohler JL. Preoperative prediction of pathological tumor volume and stage in clinically localized prostate cancer: comparison of digital rectal examination, transrectal ultrasonography and magnetic resonance imaging. J Urol 1991;146:85-9.
27. Heiken JP, Forman HP, Brown JJ. Neoplasms of the bladder, prostate, and testis. Radiol Clin North Am 1994;32:81-98.
28. Partin AW, Yoo J, Carter HB, Pearson JD, Chan DW, Epstein JI, et al. The use of prostate specific antigen, clinical stage, and Gleason score to predict pathological stage in men with localized prostate cancer. J Urol 1993;150:110-4.
29. Engelbrecht MR, Jager GJ, Laheij RJ, Verbeek AL, van Lier HJ, Barentsz JO. Local staging of prostate cancer using magnetic re- sonance imaging: a meta-analysis. Eur Radiol 2002;12:2294-302.
30. Augustin H, Fritz GA, Ehammer T, Auprich M, Pummer K.
Accuracy of 3-Tesla magnetic resonance imaging for the staging of prostate cancer in comparison to the Partin tables. Acta Radiol 2009;50:562-9.
31. Fütterer JJ, Engelbrecht MR, Huisman HJ, Jager GJ, Hulsbergen- van De Kaa CA, Witjes JA, et al. Staging prostate cancer with dynamic contrast-enhanced endorectal MR imaging prior to radical prostatectomy: experienced versus less experienced readers.
Radiology 2005;237:541-9.
32. Yu KK, Scheidler J, Hricak H, Vigneron DB, Zaloudek CJ, Males RG, et al. Prostate cancer: prediction of extracapsular extension with endorectal MR imaging and three-dimensional proton MR spectroscopic imaging. Radiology 1999;213:481-8.
33. Graefen M, Hammerer P, Michl U, Noldus J, Haese A, Henke RP, et al. Incidence of positive surgical margins after biopsy- selected nerve-sparing radical prostatectomy. Urology 1998;51:
437-42.
34. Sanwick JM, Dalkin BL, Nagle RB. Accuracy of prostate needle biopsy in predicting extracapsular tumor extension at radical retropubic prostatectomy: application in selecting patients for nerve-sparing surgery. Urology 1998;52:814-8.