Urological Oncology
Significance of Predicted Tumor Volume as a Predictor of Pathologic Stage in Patients Undergoing Radical Prostatectomy
Ja Hyeon Ku, Kyung Chul Moon1, Cheol Kwak, Hyeon Hoe Kim
Departments of Urology and 1Pathology, Seoul National University College of Medicine, Seoul, Korea
Purpose: The purpose of this study was to evaluate whether predicted tumor volume could predict pathologic stage in patients undergoing radical prostatectomy.
Materials and Methods: The clinical and pathologic data of 236 patients who underwent a 12-core needle biopsy followed by radical prostatectomy were obtained from our data- base and reviewed retrospectively.
Results: Observed tumor volume correlated best with serum prostate-specific antigen (PSA) level (r=0.677, p<0.001) and the number of positive biopsy cores (r=0.489, p
<0.001). Stepwise multiple linear regression analysis was used to develop a model for predicting tumor volume before radical prostatectomy. All explanatory variables ex- cept PSA and the number of positive biopsy cores were eliminated, yielding the equation ([predicted tumor volume]=0.381x[PSA]+0.921x[No. of positive biopsy cores]−0.992).
Tumor volume predicted by this equation correlated strongly with observed tumor vol- ume (r=0.722, p<0.001). This was also true when a different cohort of 159 patients was analyzed (r=0.638, p<0.001). The areas under the receiver operating characteristic curves of predicted tumor volume were 68.5% for extracapsular extension, 75.7% for seminal vesicle invasion, and 70.4% for positive surgical margin. Kaplan-Meier curves revealed that predicted tumor volume correlated significantly with biochemical re- currence-free survival (p<0.001; log-rank test).
Conclusions: Our findings suggest that tumor volume predicted on the basis of PSA levels and number of positive biopsy cores may predict pathologic stage with reasonable accuracy.
Key Words: Prostatectomy; Prostatic neoplasms; Treatment outcome; Tumor burden
This is an Open Access article distributed under the terms of the Creative Commons Attribution Non-Commercial License (http://creativecommons.org/licenses/by-nc/3.0) which permits unrestricted non-commercial use, distribution, and reproduction in any medium, provided the original work is properly cited.
Article History:
received 8 October, 2010 accepted 8 November, 2010
Corresponding Author:
Hyeon Hoe Kim
Department of Urology, Seoul National University Hospital, 28, Yeongeon- dong, Jongno Ku, Seoul 110-744, Korea
TEL: +82-2-2072-2425 FAX: +82-2-742-4665 E-mail: [email protected]
INTRODUCTION
It has been suggested previously that the malignant poten- tial of prostate cancer correlates strongly with the size of the primary cancer [1]. Reflecting this, all definitions of clinically significant vs. potentially insignificant prostatic carcinoma incorporate tumor size measurements [2,3].
Numerous studies have also shown that prostate cancer volume correlates with other prognostic indicators and with progression after radical prostatectomy [4,5]. These observations suggest that obtaining an accurate estima- tion of tumor volume preoperatively might aid the treat- ment decision. However, it remains difficult to estimate tu-
mor volume preoperatively on the basis of clinical parame- ters such as preoperative biopsy data. Indeed, there is often significant discord between the extent of cancer detected on biopsy and the tumor volume in the final surgical speci- men [6,7]. Moreover, although prostate-specific antigen (PSA) is the most widely used tumor marker in clinical practice for the diagnosis, staging, and monitoring of pros- tate cancer, PSA associates only weakly with prostate can- cer volume in men treated by radical prostatectomy [8].
The aim of this study was to determine whether it is pos- sible to estimate tumor volume on the basis of preoperative clinical variables and whether such predicted tumor vol- umes could predict pathologic stage in patients who under-
go radical prostatectomy. For this purpose, we developed a regression model composed of several preoperative varia- bles to predict total tumor volume.
MATERIALS AND METHODS 1. Patient population
Approval of the study was obtained from the Institutional Review Board of our institution. Between 2000 and 2004, 260 radical retropubic prostatectomies for the treatment of prostate cancer were performed at a single institution.
The clinical and pathologic data of these patients were ob- tained from our surgical database and were reviewed retrospectively. Patients with positive lymph nodes and who had received neoadjuvant or immediate adjuvant an- drogen ablation or radiotherapy were excluded from the study. A total of 236 patients were included in the study.
Individuals who visited our department for a variety of rea- sons, such as prostate cancer screening or because of void- ing symptoms, were enrolled regardless of whether the vis- it was primary or referred. Patients with high serum PSA levels or abnormal digital rectal examination (DRE) find- ings underwent a 12-core needle biopsy; all biopsies were performed by a single radiologist. The DRE was performed by senior urologists at our institution. The patients’ me- dian age at the time of surgery was 67.2 years (range, 41.8-80.7 years). The median preoperative PSA level was 8.1 ng/ml (range, 0.7-98.0 ng/ml). None of the patients had evidence of nodal disease or distant metastasis on either contrast-enhanced computed tomography or bone scans.
2. Histologic analysis
The presence of carcinoma in needle biopsy tissue was as- sessed by a single pathologist (K.C.M). Gleason primary and secondary grades with sum scores were assigned, and the number of core biopsy specimens that contained carci- noma was quantified. The radical prostatectomy speci- mens were handled and processed in a standard manner, in which all prostatic tissue was embedded as previously described [9]. The total tumor volume and the tumor vol- ume of each cancer focus were calculated by using the for- mula 0.4 x length x width x cross-sectional thickness, i.e., number of cross sections x section thickness [10]. All speci- mens were scored according to the Gleason grading system.
The pathologic stages were determined on the basis of the 2002 TNM classification, and a positive surgical margin was defined as the presence of cancer cells in the inked sur- face of the prostate specimen.
3. Follow-up
Follow-up information was collected from the medical records. All patients were followed up by measuring their PSA levels every 3 months. The median follow-up period was 17.9 months (range, 1.0-75.3 months). The endpoint of this study was biochemical recurrence. Biochemical re- currence was defined as detectable PSA levels (greater than 0.2 ng/ml on least two occasions), and the time of bio-
chemical recurrence was taken to be the first time PSA be- came detectable.
4. Statistical analysis
Pearson correlation coefficients for the relations between clinical parameters and total tumor volume were generated. Stepwise multivariate linear regression was performed to develop a model for predicting tumor volume before radical retropubic prostatectomy. The regression model in this study included age, body mass index, serum PSA, biopsy Gleason score, number of positive biopsy cores, and clinical stage. Clinical stage was categorized according to organ confinement. Differences in tumor volume (ΔV) were calculated by subtracting observed tumor volume (V1) from predicted tumor volume (V2). These differences were plotted against the mean volume by using the ap- proach described by Bland and Altman [11]: ΔV=(V2–
V1)x2/(V2+V1). The receiver operating characteristic (ROC) curve was used to indicate the ability of the predicted tumor volume to predict several pathologic parameters, namely, extracapsular extension, seminal vesicle in- vasion, and positive surgical margin. For this, areas under the ROC curves were estimated. Determining the area un- der the curve is a suitable way to summarize the overall dis- criminatory or diagnostic value of a model: the area can range from 0.5 (equivalent to flipping a coin, namely, a use- less model) to 1.0 (perfect discrimination). The more the area under the ROC curve approached 100% (i.e., the more the ROC curve approached the upper left corner), the great- er the predictive power. The Kaplan-Meier method was used to calculate the biochemical recurrence-free survival by predicted tumor volume. The differences were tested with the log-rank test. All p-values were two-sided and p
<0.05 was significant. All statistical analyses were per- formed with SPSS ver. 17.0 (SPSS Inc., Chicago, IL, USA) programs.
RESULTS
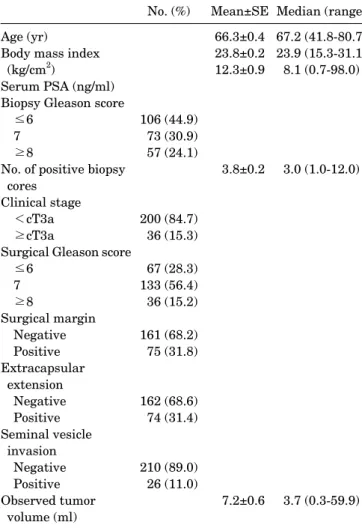
The patient characteristics are listed in Table 1. Of the 236 patients, 200 (84.7%) were deemed to have clinically lo- calized prostate cancer (T1-T2, N0) on the basis of the ini- tial physical and radiographic evaluation. However, after surgery, extracapsular extension was detected in 74 (31.4%), seminal vesicle involvement was observed in 26 (11.0%), and 75 (31.8%) had positive surgical margins.
Correlation coefficients between the tumor volume that was determined after radical prostatectomy and various clinical parameters were obtained. The correlations be- tween observed tumor volume and body mass index or biop- sy Gleason score were low (0.153 and 0.283, respectively).
The number of positive biopsy cores correlated more strongly with observed tumor volume (r=0.489, p<0.001).
The highest correlation (r=0.677, p<0.001) was found be- tween serum PSA and observed tumor volume (Table 2).
Moreover, when the patients were divided into two groups on the basis of clinical stage, the two groups differed sig-
TABLE 1. Patient characteristics
No. (%) Mean±SE Median (range) Age (yr)
Body mass index (kg/cm2)
Serum PSA (ng/ml) Biopsy Gleason score
≤6 7
≥8
No. of positive biopsy cores
Clinical stage
<cT3a
≥cT3a
Surgical Gleason score
≤6 7
≥8
Surgical margin Negative Positive Extracapsular
extension Negative Positive Seminal vesicle
invasion Negative Positive Observed tumor
volume (ml)
106 (44.9) 73 (30.9) 57 (24.1)
200 (84.7) 36 (15.3) 67 (28.3) 133 (56.4) 36 (15.2) 161 (68.2) 75 (31.8)
162 (68.6) 74 (31.4)
210 (89.0) 26 (11.0)
66.3±0.4 23.8±0.2 12.3±0.9
3.8±0.2
7.2±0.6
67.2 (41.8-80.7) 23.9 (15.3-31.1) 8.1 (0.7-98.0)
3.0 (1.0-12.0)
3.7 (0.3-59.9) SE: standard error, PSA: prostate-specific antigen
TABLE 2. Correlation between clinical parameters and observed tumor volume
r p-value
Age (yr) −0.28 0.671
Body mass index (kg/cm2) 0.153 0.019
Serum PSA (ng/ml) 0.677 <0.001
Biopsy Gleason score 0.283 <0.001
No. of positive biopsy cores 0.489 <0.001 PSA: prostate-specific antigen
FIG. 1. (A) Regression analysis showing the correlation between observed tumor volume and predicted tumor volume (r=0.722, p
<0.001), for which predicted tumor volume was calculated by using the following equation: [Predicted tumor volume]=
0.381x[prostate-specific antigen]+0.921x[No. of positive biopsy cores]−0.992. (B) Bland-Altman analysis of the agreement between observed tumor volume and predicted tumor volume. The linear line indicates the mean difference. Dotted lines represent 95%
confidence intervals from the mean of the two volumes.
nificantly in terms of observed tumor volume (6.4±0.6 for patients with <cT3a vs. 11.3±1.9 for those with ≥cT3a, p=0.020).
The relation between these clinical parameters and ob- served tumor volume was explored by multiple linear re- gression analysis. By using the stepwise method described earlier, all explanatory variables were eliminated except for PSA and the number of positive biopsy cores. This re- sulted in the equation: [Predicted tumor volume]=0.381x [PSA]+0.921x[No. of positive biopsy cores]−0.992. There was a strong correlation between predicted tumor volume and observed tumor volume (r=0.722, p<0.001) (Fig. 1A).
The mean difference in volume measurements was 0.3 ml (range, −1.4-1.7 ml; 95% confidence interval: −0.9-1.5 ml) (Fig. 1B).
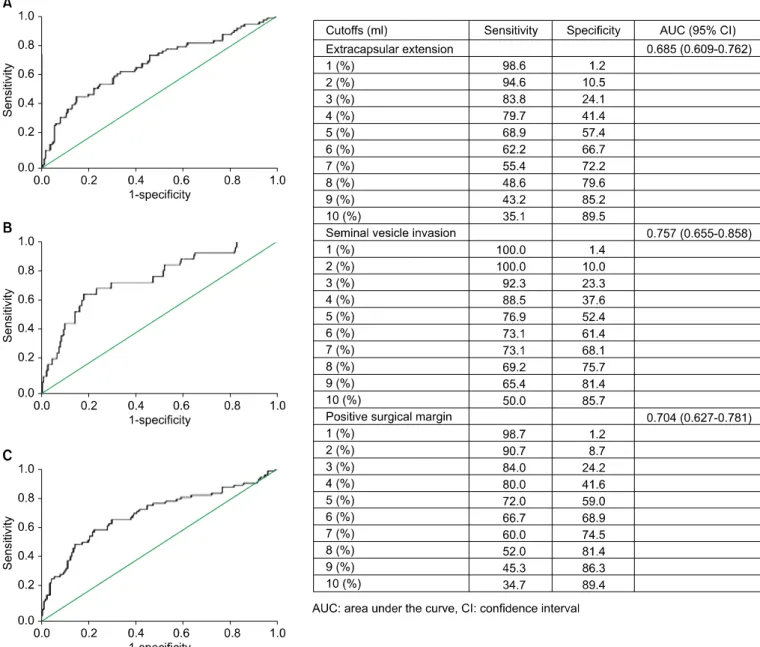
Fig. 2 presents the areas under the ROC curves, which indicate the ability of predicted tumor volume to predict pathologic stage. The areas under the ROC curves of pre- dicted tumor volume were 68.5% for extracapsular ex- tension, 75.7% for seminal vesicle invasion, and 70.4% for positive surgical margin. Thus, overall, predicted tumor volume predicted the pathologic results reasonably well.
FIG. 2. Ability of predicted tumor volume to predict pathologic outcomes. (A) Extracapsular extension. (B) Seminal vesicle invasion.
(C) Positive surgical margin.
FIG. 3. Biochemical recurrence-free survivals of patients accor- ding to median predicted tumor volume (p<0.001; log-rank test).
The sensitivity and specificity with which various pre- dicted tumor volume levels predicted pathologic stage are also shown in Fig. 2.
Fig. 3 shows the Kaplan-Meier curves of patients catego- rized according to predicted tumor volume. The curves re- vealed that predicted tumor volume correlated sig- nificantly with biochemical recurrence-free survival (p
<0.001; log-rank test) when the patients were stratified into two groups according to the median value (i.e., less than 5 ml or 5 ml or greater).
To validate the above formula, the data for another co- hort of patients who underwent radical retropubic prosta- tectomy (n=284), this time between 2005 and 2006, were obtained and reviewed. Of these patients, data for 159 were available. There was a significant correlation between the predicted tumor volume calculated by using the above for-
FIG. 4. Observed and predicted tumor volumes of a second cohort of patients who underwent radical retropubic prostatectomy between 2005 and 2006. (A) Regression analysis of all 159 patients (r=0.638, p<0.001). (B) Bland-Altman analysis of all 159 patients. (C) Regression analysis of the 66 patients whose observed tumor volume was <3 ml (r=0.277, p=0.024). (D) Bland-Altman analysis of the 66 patients whose observed tumor volume was <3 ml.
mula and the observed tumor volume (r=0.638, p<0.001) (Fig. 4A). The mean differences in volume measurements amounted to 0.3 ml (range, −1.3-2.0 ml; 95% confidence in- terval: −0.9-1.6 ml) (Fig. 4B).
The patients in our series are not representative of most patients seen today in North America and Western Europe, where 75% of those who receive a diagnosis of prostate can- cer have nonpalpable disease and tumor volumes that are smaller than those observed in our series. Consequently, we performed subgroup analysis by using 66 of the 159 pa- tients whose observed tumor volume was <3 ml. There was a weak correlation between predicted tumor volume and observed tumor volume (r=0.277, p=0.024) (Fig. 4C). The mean difference in volume measurements was 0.9 ml (range, −0.5-2.0 ml; 95% confidence interval: 0.9-1.8 ml) (Fig. 4D).
DISCUSSION
The size of a tumor is an important reflection of its biology, which is why tumor size has been reported to correlate di-
rectly with disease extent and to be an important prog- nostic indicator for prostate cancer. For example, Bostwick et al found that progression from capsular invasion to semi- nal vesicle invasion and finally metastasis was linked to increasing tumor volume [5]. Others have also noted that small-volume tumors rarely progress, whereas large-vol- ume tumors progress more frequently [3,12,13].
However, a method for accurately estimating the tumor volume of prostate cancer before radical prostatectomy is still lacking. Although serum PSA correlates with cancer volume, its ability to predict tumor size on its own is poor [14]. Radiologic imaging techniques often underestimate the tumor volume or even fail to detect the tumor [15].
Although histologic grade has been shown to correlate with actual tumor volume [16], we found that the Gleason score derived from preoperative biopsies correlated poorly with the actual tumor volume. Furthermore, the needle biop- sy-based Gleason score was not an independent ex- planatory variable for tumor volume in this study.
Because the total tumor volume in the radical prostatec- tomy specimen correlates with disease extent and may help
to predict tumor aggressiveness, we asked whether pre- operative parameters could serve collectively to predict preoperative tumor volume. Two variables, namely, serum PSA and the number of positive needle biopsy cores, were found to be most highly predictive of observed tumor volume. These observations are similar to those made in other studies that investigated the predictive power of tu- mor extent on needle biopsies. For example, Ogawa et al found that the number of cancer-positive biopsy cores and serum PSA were independently predictive of organ-con- fined disease [17]. Moreover, Egawa et al reported that the number of cores with cancer is jointly predictive of ex- traprostatic extension in a model that incorporates PSA, clinical stage, and Gleason score [18]. In addition, Wills et al showed that Gleason score and the number of cancer-pos- itive cores were the two best predictors of pathologic stage [19]. Recently, Ochiai et al found that the number of pos- itive cores obtained during extended biopsy may be a tool for predicting the biological significance of prostate cancer [20].
Although actual tumor volume helps to predict tumor ag- gressiveness, its calculation is time consuming and re- quires much effort. There are several different ways of esti- mating the size of tumors in radical prostatectomy speci- mens, but these methods are not suitable for routine clin- ical practice. Therefore, an alternative method of estimat- ing tumor size is desirable. When we established a re- gression model in which tumor volume was the dependent variable and the predicted tumor volume was the ex- planatory variable, the regression coefficient was sig- nificant at the 5% level with an adjusted R2=0.521. We also found that predicted tumor volume was a reasonable pre- dictor of pathologic stage.
This study suffered from several limitations. First, be- cause this study was conducted retrospectively, it may suf- fer from the typical biases of such research, including re- ferral, selection, and inclusion biases. Second, at the time of analysis, the median follow-up period of the cohort was only 17.9 months, which hampered our ability to analyze the associations of predicted tumor volume with pro- gression variables. Third, the percentage of needle biopsy core length that involved tumor was not reported con- sistently in our series, which meant that we could not ana- lyze the relationship between this variable and predicted tumor volume. It may be that the percentage of cores with adenocarcinoma is useful for predicting the outcomes of pathologic or biochemical recurrence. However, this limi- tation may be less serious because the number of positive cores may indicate tumor extent in needle biopsy speci- mens more quantitatively and reproducibly than visual in- spection estimates of the percentages of prostate needle bi- opsy tissue that contains carcinoma [21]. Furthermore, the prostate gland was typically sampled by 12-core biopsies in the present study. Increased sampling may improve the ability of tumor extent in needle biopsy specimens to accu- rately reflect whole-gland tumor volume [22].
CONCLUSIONS
The prediction of pathologic stage is a key element in pros- tate cancer treatment decision-making. We found that tu- mor volume predicted on the basis of PSA levels and the number of positive biopsy cores predicted pathologic stage with reasonable accuracy. Thus, this method of pre- operatively predicting tumor volume may improve the de- cision-making regarding patients with prostate cancer.
Conflicts of Interest
The authors have nothing to disclose.
REFERENCES
1. McNeal JE. Origin and development of carcinoma in the prostate.
Cancer 1969;23:24-34.
2. Humphrey PA, Vollmer RT. Percentage carcinoma as a measure of prostatic tumor size in radical prostatectomy tissues. Mod Pathol 1997;10:326-33.
3. Ohori M, Wheeler TM, Dunn JK, Stamey TA, Scardino PT. The pathological features and prognosis of prostate cancer detectable with current diagnostic tests. J Urol 1994;152:1714-20.
4. Bostwick DG, Graham SD Jr, Napalkov P, Abrahamsson PA, di Sant’agnese PA, Algaba F, et al. Staging of early prostate cancer:
a proposed tumor volume-based prognostic index. Urology 1993;41:403-11.
5. Watson RB, Civantos F, Soloway MS. Positive surgical margins with radical prostatectomy: detailed pathological analysis and prognosis. Urology 1996;48:80-90.
6. Carter HB, Sauvageot J, Walsh PC, Epstein JI. Prospective evalu- ation of men with stage T1c adenocarcinoma of the prostate. J Urol 1997;157:2206-9.
7. Sebo TJ, Cheville JC, Riehle DL, Lohse CM, Pankratz VS, Myers RP, et al. Predicting prostate carcinoma volume and stage at radi- cal prostatectomy by assessing needle biopsy specimens for per- cent surface area and cores positive for carcinoma, perineural in- vasion, Gleason score, DNA ploidy and proliferation, and pre- operative serum prostate specific antigen: a report of 454 cases.
Cancer 2001;91:2196-204.
8. Stamey TA, Caldwell M, McNeal JE, Nolley R, Hemenez M, Downs J. The prostate specific antigen era in the United States is over for prostate cancer: what happened in the last 20 years?
J Urol 2004;172:1297-301.
9. Humphrey PA, Keetch DW, Smith DS, Shepherd DL, Catalona WJ. Prospective characterization of pathological features of pro- static carcinomas detected via serum prostate specific antigen based screening. J Urol 1996;155:816-20.
10. Chen ME, Johnston D, Reyes AO, Soto CP, Babaian RJ, Troncoso P. A streamlined three-dimensional volume estimation method accurately classifies prostate tumors by volume. Am J Surg Pathol 2003;27:1291-301.
11. Bland JM, Altman DG. Statistical methods for assessing agree- ment between two methods of clinical measurement. Lancet 1986;1:307-10.
12. Renshaw AA, Richie JP, Loughlin KR, Jiroutek M, Chung A, D’Amico AV. The greatest dimension of prostate carcinoma is a simple, inexpensive predictor of prostate specific antigen failure in radical prostatectomy specimens. Cancer 1998;83:748-52.
13. McNeal JE, Haillot O. Patterns of spread of adenocarcinoma in the prostate as related to cancer volume. Prostate 2001;49:48-57.
14. Babaian RJ, Troncoso P, Steelhammer LC, Lloreta-Trull J, Ramirez EI. Tumor volume and prostate specific antigen: im- plications for early detection and defining a window of curability.
J Urol 1995;154:1808-12.
15. Norberg M, Holmberg L, Busch C, Häggman M, Egevad L, Magnusson A. Multiple transrectal ultrasound-guided biopsies for the detection of prostate cancer and determination of tumor volume, grade, and seminal vesicle invasion. Eur Radiol 1996;6:56-61.
16. McNeal JE, Villers AA, Redwine EA, Freiha FS, Stamey TA.
Histologic differentiation, cancer volume, and pelvic lymph node metastasis in adenocarcinoma of the prostate. Cancer 1990;66:
1225-33.
17. Ogawa O, Egawa S, Arai Y, Tobisu K, Yoshida O, Kato T.
Preoperative predictors for organ-confined disease in Japanese patients with stage T1c prostate cancer. Int J Urol 1998;5:454-8.
18. Egawa S, Suyama K, Matsumoto K, Satoh T, Uchida T, Kuwao
S, et al. Improved predictability of extracapsular extension and seminal vesicle involvement based on clinical and biopsy findings in prostate cancer in Japanese men. Urology 1998;52:433-40.
19. Wills ML, Sauvageot J, Partin AW, Gurganus R, Epstein JI.
Ability of sextant biopsies to predict radical prostatectomy stage.
Urology 1998;51:759-64.
20. Ochiai A, Troncoso P, Chen ME, Lloreta J, Babaian RJ. The rela- tionship between tumor volume and the number of positive cores in men undergoing multisite extended biopsy: implication for ex- pectant management. J Urol 2005;174:2164-8.
21. True LD, Wallner K. Why linear, not percent, of cancer should be used to measure cancer in needle biopsies. Mod Pathol 2002;15:184A.
22. Egevad L, Norberg M, Mattson S, Norlen BJ, Busch C. Estimation of prostate cancer volume by multiple core biopsies before radical prostatectomy. Urology 1998;52:653-8.