Clinical Significance of a Large Difference (≥ 2 points) between Biopsy and Post-prostatectomy Pathological Gleason Scores in Patients with Prostate Cancer
We investigated the clinical significance of large difference (≥ 2 points) between biopsy-derived (bGS) and post-prostatectomy Gleason scores (pGS). At 14 medical centers in Korea, 1,582 men who underwent radical prostatectomy for prostate cancer were included. According to the difference between bGS and pGS, the patients were divided into three groups: A (decreased in pGS ≥ 2, n = 30), B (changed in pGS
≤ 1, n = 1,361; control group), and C (increased in pGS ≥ 2, n = 55). We evaluated various clinicopathological factors of prostate cancer and hazards for biochemical failure. Group A showed significantly higher mean maximal percentage of cancer in the positive cores (max%) and pathological T stage than control. In group C, the number of biopsy core was significantly smaller, however, tumor volume and max%
were significantly higher and more positive biopsy cores were presented than control.
Worse pathological stage and more margin-positive were observed in group A and C than in control. Hazard ratio for biochemical failure was also higher in group A and C (P = 0.001). However, the groups were not independent factors in multivariate analysis. In conclusion, large difference between bGS and pGS shows poor prognosis even in the decreased group. However it is not an independent prognostic factor for biochemical failure.
Key Words: Prostatic Neoplasms; Gleason Score; Prognosis Changhee Yoo1, Cheol Young Oh1,
Jin Seon Cho1, Cheryn Song2, Seong Il Seo3, Hanjong Ahn2, Tae-Kon Hwang4, Jun Cheon5, Kang Hyun Lee6, Tae Gyun Kwon7,
Tae Young Jung8, Moon Kee Chung9, Sang Eun Lee10, Hyun Moo Lee3, Eun Sik Lee11, Young Deuk Choi12, Byung Ha Chung12, Hyung Jin Kim13, Wun-Jae Kim14, Seok-Soo Byun8, and Han Yong Choi3
1Department of Urology, College of Medicine, Hallym University, Chuncheon; 2Department of Urology, Asan Medical Center, University of Ulsan, College of Medicine, Seoul; 3Department of Urology, Sungkyunkwan University, School of Medicine, Seoul; 4Department of Urology, Seoul St. Mary’s Hospital, College of Medicine, The Catholic university of Korea, Seoul; 5Department of Urology, College of Medicine, Korea University, Seoul;
6Urologic Oncology Clinic, National Cancer Center, Goyang; 7Department of Urology, College of Medicine, Kyungpook National University, Daegu; 8Department of Urology, Seoul Veterans Hospital, Seoul; 9Department of Urology, College of Medicine, Pusan National University, Busan; 10Department of Urology, Seoul National University Bundang Hospital, Seongnam; 11Department of Urology, Seoul National University, College of Medicine, Seoul;
12Department of Urology, Urological Science Institute, Yonsei University, College of Medicine, Seoul; 13Department of Urology, Chonbuk National University Medical School, Jeonju; 14Department of Urology, College of Medicine, Chungbuk National University, Cheongju, Korea Received: 28 September 2010
Accepted: 25 January 2011 Address for Correspondence:
Han Yong Choi, MD
Department of Urology, Sungkyunkwan University, School of Medicine, Samsung Medical Center, 81 Irwon-ro, Gangnam-gu, Seoul 135-710, Korea
Tel: +82.2-3410-3351, Fax: +82.2-3410-3027 E-mail: [email protected]
This research was supported by the Korean Urological Oncology Society Grant 08-01.
DOI: 10.3346/jkms.2011.26.4.507 • J Korean Med Sci 2011; 26: 507-512 Oncology & Hematology
INTRODUCTION
The prostate cancer is the most common malignant disease of men in Western countries (1). Its incidence is continuously in- creasing Korea and its age-standardized incidence rates per 100,000 men was 4.6 cases, which was the 8th-highest cause
among the organ-specific malignant tumors in 2007 (2). Many pre-treatment prognostic factors have been proposed to be used to determine one of the treatment modalities and the Gleason system was proved to be one of the most important prognostic factors. Histological variation within each tumor brought two grades, the predominant, or primary grade and the less exten-
sive, or secondary grade (3). Biopsy-derived Gleason score (bGS) is used as one of the most important pretreatment prognostic factors (4, 5). Though the overall accuracy of Gleason grade on needle biopsies was found to be good in predicting prostatec- tomy specimen grade, upgrading and downgrading have been reported 9%-26% and 18%-22%, respectively (6, 7). Moreover, large difference (≥ 2 points) between biopsy-derived and post- prostatectomy Gleason scores (pGS) may confuse the clinicians in consulting the patients. We investigated the clinical signifi- cance of this difference.
MATERIALS AND METHODS
At 14 medical centers in Korea, the medical records of 1,582 men who underwent radical prostatectomy for prostate cancer be- tween 1995 and 2007 were reviewed retrospectively. Prostate biopsy was recommended to the patients who had abnormal finding in digital rectal examination or whose serum prostate specific antigen (PSA) level was above 3.0 or 4.0 ng/mL accord- ing to the policy for prostate biopsy of each medical center. All the pathologic slides of 18-gauge needle biopsy and the surgical prostate specimen from the involved medical centers were re- evaluated by single expert uropathologist. According to the 2005 International Society of Urological Pathology (ISUP) consensus on Gleason grading of prostatic carcinoma (8), bGS was defined as summation of primary GS and highest grade GS of all biopsy cores; and pGS was defined as summation of primary and sec- ondary GS in the prostate specimen. Tumor volume was mea- sured in the whole mount section of the resected prostate by the pathologist. The patients who took neoadjuvant therapy includ- ing androgen deprivation or radiation therapy and the patients whose pathological slides showed too poor quality to reevalu- ate were excluded. Finally 1,446 patients were included in this study. Biochemical failure was defined as serum PSA elevation above 0.2 ng/mL from nadir after radical prostatectomy. Time to biochemical failure was measured by the time interval from radical prostatectomy to biochemical failure. Needle biopsy specimen was taken from 6 (10.9%), 8 (8.4%), 10 (14.8%) and 12 cores (65.8%) and additional cores of suspicious nodules. Clini- cal stage was classified into cT1, cT2, and cT3 based on digital rectal examination and MRI findings. Operation procedure was included 1,036 radical retropubic prostatectomies (71.6%), 220 radical perineal prostatectomies (15.2%), 125 laparoscopic rad- ical prostatectomies (8.6%) and 65 robot-assisted radical pros- tatectomies (4.5%). Mean age was 64.9 (38-85) yr old and pre- operative sPSA was 11.8 ng/mL. The distribution of bGS was 46.7%, 39.5% and 13.8% in GS ≤ 6, 7, and ≥ 8, respectively (Table 1). According to the difference between bGS and pGS, the pa- tients were divided into three groups: group A (decreased in pGS by 2 or more), group B as a control group (changed in pGS with- in 1 point), and group C (increased in pGS by 2 or more). We
evaluated various clinicopathological factors of prostate cancer, including age, preoperative sPSA, the number of biopsy cores, the highest cancer % in biopsy cores, clinical and pathological stage, volume % and distribution of cancer cells in surgical spec- imen, and surgical margin status, univariately and multivari- ately. Hazards for biochemical failure of these groups were also analyzed.
ANOVA and chi-square test was used for analysis of the vari- ables in three groups. Scheffe’s method and Dunnett’s C meth- od were used for post-hoc test for identifying the groups which made difference. Kaplan-Meier method and log rank test and Cox-regression hazard model were used for analysis of the haz- ards for biochemical failure of the groups.
Ethics statement
This study was reviewed and approved by the institutional re- view board of the Samsung Medical Center (No. 2008-05-067).
The board exempted informed consent because it was a retro- spective study.
RESULTS
Each group included 30 (2.1%), 1,361 (94.1%) and 55 (3.8%) pa- tients. Group A included bGS 7, 9 and 10 by 26.7%, 70.0%, and 3.3%, respectively, and group C, bGS 4, 5, 6, 7, and 8 by 5.5%, 7.3%, 21.8%, 63.6%, and 1.8% (Table 1). In the comparison of the clin- icopathological factors of the three groups, the number of biop- sy cores, maximal cancer % in positive cores, clinical and path- ological stage, cancer volume %, and surgical margin status were significantly different (Table 2). In group A and C, maximal % of tumor in biopsy cores (P < 0.001 and P = 0.032, respectively) and margin positivity (P = 0.025 and P = 0.002, respectively) were higher than the control group B and pathological T stage was also worse in the group A and C than the control group B (P = 0.006 and P < 0.001, respectively). In group C, the number of bi- opsy core was significantly lower but tumor volume % in the pa- thology specimen was significantly higher and tumor was more widely distributed in the prostate specimen than the control group B (P = 0.001), which were different aspects from group A Table 1. Proportion of the bGS in the three groups
Biopsy-derived
Gleason score Group A (%) Group B (%) Group C (%)
4 - 3 (0.2) 3 (5.5)
5 - 15 (1.1) 4 (7.3)
6 - 639 (47.0) 12 (21.8)
7 8 (26.7) 528 (38.8) 35 (63.6)
8 - 102 (7.5) 1 (1.8)
9 21 (70.0) 69 (5.1) -
10 1 (3.3) 5 (0.4) -
Total 30 1,361 55
Group A (decreased in pGS by 2 or more), Group B (changed in pGS within 1 point), Group C (increased in pGS by 2 or more).
(Table 3). Of the patients in group A, 73.3% diagnosed as prostate cancer of bGS 9 or 10 and their pGS fell into pGS 7 or 8. Though pGS of 8 patients (26.7%) who was diagnosed as bGS 7 was de- creased to 5, the pathological stage of 7 of them were pT2c or higher.
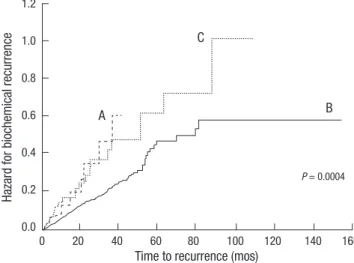
Hazard ratio (HR) for biochemical failure was significantly higher in both groups (Group A, HR 2.385, 95% CI [1.222-4.656]
P = 0.011; Group C, HR 1.750, 95% CI [1.147-2.672], P = 0.009) (Fig. 1). The median time to biochemical failure in group A and C were 46.0 and 62.6 months respectively but that of the control group did not reach median value within follow-up period. In
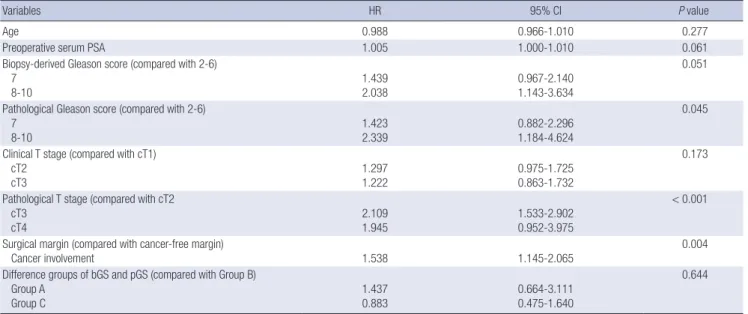
multivariate analysis, however, this difference of bGS and pGS was not an independent prognostic factor of biochemical recur- rence. Well-known prognostic factors of prostate cancer such as pGS (P = 0.045), pT stage (P < 0.001), surgical margin (P = 0.004) were significant in multivariate analysis (Table 4).
Table 2. Comparison of the clinicopathological factors of the three groups
Parameters Group A Group B Group C P value
No. of the patients 30 1,361 55 -
Age (yr) 64.7 ± 7.0 64.9 ± 6.6 65.7 ± 5.9 0.653
Preoperative PSA (ng/dL) 11.4 ± 6.9 11.8 ± 15.4 15.1 ± 11.9 0.289
Body mass index (kg/m2) 24.5 ± 3.5 24.1 ± 3.3 24.1 ± 3.1 0.792
Prostate volume (mL) 36.5 ± 13.2 37.1 ± 17.9 32.8 ± 14.5 0.270
Clinical T stage (%) cT1
cT2 cT3
14 (46.7) 14 (46.7) 2 (6.7)
725 (53.5) 515 (38.0) 114 (8.4)
24 (45.3) 23 (43.4) 6 (11.3)
0.006
No. of biopsy core (%) ≤ 7
8-10 10-12 ≥ 12
4 (13.8) 1 (3.4) 1 (3.4) 20 (67.0)
140 (10.3) 116 (8.6) 194 (14.3) 903 (66.7)
13 (23.6) 4 (7.3) 15 (27.3) 23 (41.8)
0.002
Maximal % of tumor in biopsy cores 64.3 ± 23.1 41.8 ± 29.0 52.3 ± 34.1 < 0.001
Tumor volume % in prostate specimen 19.2 ± 18.1 15.1 ± 18.1 28.0 ± 23.4 < 0.001
Pathological T stage (%) pT2
pT3a pT3b pT4
15 (50.0) 7 (23.3) 7 (23.3) 1 (3.3)
953 (70.1) 280 (20.6) 102 (7.5) 25 (1.8)
18 (33.3) 23 (42.6) 12 (22.2) 1 (1.9)
< 0.001
Tumor distribution (%) Apex
Peripheral Base Apex to base
6 (24.0) 6 (24.0) 3 (12.0) 10 (40.0)
486 (38.2) 327 (25.7) 206 (16.2) 253 (19.9)
9 (20.0) 9 (20.0) 7 (15.6) 20 (44.4)
0.001
Margin positivity (%) Positive
Margin free 15 (50)
15 (50) 419 (30.8)
942 (69.2) 28 (50.9)
27 (49.1) 0.001
Group A (decreased in pGS by 2 or more), Group B (changed in pGS within 1 point), Group C (increased in pGS by 2 or more).
Table 3. Difference of the variables of the group A and the group C compared with those of group B
Variables P values
Group A Group C
No. of biopsy core 0.745 < 0.001
Maximal % of tumor in biopsy cores* < 0.001 0.032
Tumor volume % in pathology* 0.482 < 0.001
Pathological T stage 0.006 < 0.001
Tumor distribution 0.090 0.001
Margin positive rate 0.025 0.002
*by Scheffe’s method and Dunnett’s C method in post-hoc test. Group A (decreased in pGS by 2 or more), Group B (changed in pGS within 1 point), Group C (increased in pGS by 2 or more).
Fig. 1. Hazard for biochemical recurrence of the three groups: Group A (decreased in pGS by 2 or more), Group B as a control group (changed in pGS within 1 point), and Group C (increased in pGS by 2 or more).
Hazard for biochemical recurrence
Time to recurrence (mos)
B
P = 0.0004
C
A
0 20 40 60 80 100 120 140 160
1.2
1.0
0.8
0.6
0.4
0.2
0.0
Table 4. Multivariate analysis of the clinicopathological factors of prostate cancer and the difference groups of bGS and pGS
Variables HR 95% CI P value
Age 0.988 0.966-1.010 0.277
Preoperative serum PSA 1.005 1.000-1.010 0.061
Biopsy-derived Gleason score (compared with 2-6) 7
8-10 1.439
2.038 0.967-2.140
1.143-3.634
0.051
Pathological Gleason score (compared with 2-6) 7
8-10 1.423
2.339 0.882-2.296
1.184-4.624
0.045
Clinical T stage (compared with cT1) cT2
cT3 1.297
1.222 0.975-1.725
0.863-1.732
0.173
Pathological T stage (compared with cT2 cT3
cT4 2.109
1.945 1.533-2.902
0.952-3.975
< 0.001
Surgical margin (compared with cancer-free margin)
Cancer involvement 1.538 1.145-2.065 0.004
Difference groups of bGS and pGS (compared with Group B) Group A
Group C 1.437
0.883 0.664-3.111
0.475-1.640
0.644
bGS, biopsy-derived Gleason score; pGS, pathological Gleason score; Group A (decreased in pGS by 2 or more), Group B (changed in pGS within 1 point), and Group C (increased in pGS by 2 or more); HR, Hazard ratio; CI, Confidence interval.
DISCUSSION
It has been noted that there is 20%-40% of discrepancy between bGS and pGS in the pathology of prostate cancer (6, 7, 9). Inter- estingly, in the univariate analysis, the result of current study demonstrated that the patients with this large difference be- tween GS of pre- and post-prostatectomy showed worse clini- copathological findings and worse prognosis in biochemical failure than the control group irrespective of increase or decrease of the pGS compared with bGS. A similar study to this, in which the patients were classified into three groups, namely, upgrad- ed, downgraded, and unchanged, proposed that GS upgrading was associated with adverse pathological outcome compared with downgraded and unchanged groups, which included high- er rates of extraprostatic extension, lymph node metastasis, pos- itive surgical margins, and seminal vesicle invasion (7). Of the patients who showed two or more points decreased in pGS from bGS, 50% was diagnosed as pT3a or higher. Some of them were diagnosed as pGS 5, however, pathological stage of most of them was pT2c or higher. One of the reasons of this discrepancy be- tween bGS and pGS may be sampling error in biopsy of hetero- genic and multicentric prostate cancer (10). Prostate cancer which showed uniform pattern histology was reported only 12%- 33% in several studies (11). Another reason can be considered as the presence of high grade of tertiary component. Needle bi- opsy specimen could be obtained mainly in high grade of ter- tiary component, which would be ignored in prostatectomy specimen. If the biopsy specimen contained small amount of high grade prostate cancer, the pathologists would be tend to diagnose needle biopsy specimen as more aggressive cancer. In a study, analyzing 101 completely sectioned whole-mounted
radical prostatectomy samples, the average number of different grades was 2.7 (range 1-5) (12). In an extended study with 155 tumors from 61 whole-mounted radical prostatectomy samples, 15% of tumors included three or more histological grades (13).
A recent meta-analysis revealed that the presence of tertiary grade correlated with pathological stage, PSA recurrence and clinical progression (14). In several studies, samples character- ized with pathological variables of poor outcome, such as extra- prostatic extension and positive surgical margins contained a high grade tertiary component with consistently higher frequen- cy (15, 16). Therefore bGS of the patients in group A rather than pGS may reflect prognosis and should be considered as one of the important prognostic factors together with pathological stage.
The patients who showed two or more points increase in pGS from bGS also demonstrated aggressive tumor burden and poor prognosis in biochemical failure. In these patients, the number of biopsy core was significantly smaller than other groups. A re- cent study of 301 patients with low-risk prostate cancer (clinical Stage T1c-T2a, PSA ≤ 10 ng/mL, and bGS ≤ 6) who underwent an extended (≥ 10-core) prostate needle biopsy, in men assessed with 10-12 cores, the rate of GS upgrading was 47.9%, which was significantly higher than 23.5% in 18 cores (17). In another study, the authors proposed that prostate size and number of sampling was associated with Gleason upgrading (18). The mean pros- tate volume of the patients in group C was smaller than that of control group. On the other hand, tumor volume in whole-mount prostate was bigger. Thus insufficient number of prostate sam- pling, especially in small prostate containing aggressive cancer might cause Gleason upgrading. However, multivariate analysis showed clinical significance not in the difference of bGS and pGS but in well-known prognostic factors of prostate cancer
such as sPSA, bGS or pGS itself, pT stage and surgical margin.
In the clinical settings, even if both of the clinicians and the pa- tients would be confused with the somewhat large discrepancy in bGS and pGS, it can be ignored compared with other well- known prognostic clinicopathological factors. However, the cli- nicians had better kept in mind that many of these patients who showed large discrepancy in bGS and pGS might have other unfavorable clinicopathological factors of prostate cancer.
Bias related with interobserver variation in the pathologic re- sult of Gleason score or Gleason sum would be one of major lim- itation of this kind of study. A considerable interobserver varia- tion in the Gleason scores of prostate cancer referred to several studies has been reported (19, 20). In addition, we did not review the tertiary component of prostate cancer specimen in group A, and survival analysis was not included due to the short follow- up period. Practically, the large Gleason score gap of 2 or more points in bGS and pGS rarely occurs. In the current study, the total number of reviewed patients was 1,582, however, the num- ber of focused patients was very small, which can be addressed as another limit point.
In summary, large difference between bGS and pGS shows poor prognosis even in the decreased group. However it is not an independent prognostic factor for biochemical failure.
REFERENCES
1. Edwards BK, Brown ML, Wingo PA, Howe HL, Ward E, Ries LA, Schrag D, Jamison PM, Jemal A, Wu XC, Friedman C, Harlan L, Warren J, An- derson RN, Pickle LW. Annual report to the nation on the status of can- cer, 1975-2002, featuring population-based trends in cancer treatment. J Natl Cancer Inst 2005; 97: 1407-27.
2. Jung KW, Park S, Kong HJ, Won YJ, Boo YK, Shin HR, Park EC, Lee JS.
Cancer statistics in Korea: incidence, mortality and survival in 2006-2007.
J Korean Med Sci 2010; 25: 1113-21.
3. Gleason DF, Mellinger GT. Prediction of prognosis for prostatic adeno- carcinoma by combined histological grading and clinical staging. J Urol 1974; 111: 58-64.
4. Lerner SE, Blute ML, Bergstralh EJ, Bostwick DG, Eickholt JT, Zincke H.
Analysis of risk factors for progression in patients with pathologically confined prostate cancers after radical retropubic prostatectomy. J Urol 1996; 156: 137-43.
5. Epstein JI, Partin AW, Sauvageot J, Walsh PC. Prediction of progression following radical prostatectomy. A multivariate analysis of 721 men with long-term follow-up. Am J Surg Pathol 1996; 20: 286-92.
6. Smith EB, Frierson HF Jr, Mills SE, Boyd JC, Theodorescu D. Gleason scores of prostate biopsy and radical prostatectomy specimens over the past 10 years: is there evidence for systematic upgrading? Cancer 2002;
94: 2282-7.
7. Moussa AS, Li J, Soriano M, Klein EA, Dong F, Jones JS. Prostate biopsy clinical and pathological variables that predict significant grading changes in patients with intermediate and high grade prostate cancer. BJU Int 2009; 103: 43-8.
8. Epstein JI, Allsbrook WC Jr, Amin MB, Egevad LL; ISUP Grading Com- mittee. The 2005 International Society of Urological Pathology (ISUP) Consensus Conference of Gleason grading of prostatic carcinoma. Am J Surg Pathol 2005; 29: 1228-42.
9. Köksal IT, Ozcan F, Kadioglu TC, Esen T, Kiliçaslan I, Tunç M. Discrep- ancy between Gleason scores of biopsy and radical prostatectomy speci- mens. Eur Urol 2000; 37: 670-4.
10. Catalona WJ, Stein AJ, Fair WR. Grading errors in prostatic needle biop- sies: relation to the accuracy of tumor grade in predicting pelvic lymph node metastases. J Urol 1982; 127: 919-22.
11. Müller HA, Ackermann R, Frohmüller HG. The value of perineal punch biopsy in estimating the histological grade of carcinoma of the prostate.
Prostate 1980; 1: 303-9.
12. Aihara M, Wheeler TM, Ohori M, Scardino PT. Heterogeneity of prostate cancer in radical prostatectomy specimens. Urology 1994; 43: 60-6.
13. Ruijter ET, van de Kaa CA, Schalken JA, Debruyne FM, Ruiter DJ. Histo- logical grade heterogeneity in multifocal prostate cancer. Biological and clinical implications. J Pathol 1996; 180: 295-9.
14. Harnden P, Shelley MD, Coles B, Staffurth J, Mason MD. Should the Glea- son grading system for prostate cancer be modified to account for high- grade tertiary components? A systematic review and meta-analysis. Lan- cet Oncol 2007; 8: 411-9.
15. Mosse CA, Magi-Galluzzi C, Tsuzuki T, Epstein JI. The prognostic signifi- cance of tertiary Gleason pattern 5 in radical prostatectomy specimens.
Am J Surg Pathol 2004; 28: 394-8.
16. van Oort IM, Schout BM, Kiemeney LA, Hulsbergen CA, Witjes JA. Does the tertiary Gleason pattern influence the PSA progression-free interval after retropubic radical prostatectomy for organ confined prostate can- cer? Eur Urol 2005; 48: 572-6.
17. Capitanio U, Karakiewicz PI, Valiquette L, Perrotte P, Jeldres C, Briganti A, Gallina A, Suardi N, Cestari A, Guazzoni G, Salonia A, Montorsi F. Bi- opsy core number represents one of foremost predictors of clinically sig- nificant Gleason sum upgrading in patients with low-risk prostate can- cer. Urology 2009; 73: 1087-91.
18. Turley RS, Terris MK, Kane CJ, Aronson WJ, Presti JC Jr, Amling CL, Freed- land SJ; SEARCH Database Study Group. The association between pros- tate size and Gleason score upgrading depends on the number of biopsy cores obtained: results from the Shared Equal Access Regional Cancer Hospital Database. BJU Int 2008; 102: 1074-9.
19. Allsbrook WC Jr, Mangold KA, Johnson MH, Lane RB, Lane CG, Epstein JI. Interobserver reproducibility of Gleason grading of prostatic carcino- ma: general pathologist. Hum Pathol 2001; 32: 81-8.
20. McLean M, Srigley J, Banerjee D, Warde P, Hao Y. Interobserver varia- tion in prostate cancer Gleason scoring: are there implications for the de- sign of clinical trials and treatment strategies? Clin Oncol (R Coll Radiol) 1997; 9: 222-5.
AUTHOR SUMMARY
Clinical Significance of a Large Difference (≥ 2 points) between Biopsy and Post-prostatectomy Pathological Gleason Scores in Patients with Prostate Cancer
Changhee Yoo, Cheol Young Oh, Jin Seon Cho, Cheryn Song, Seong Il Seo, Hanjong Ahn, Tae-Kon Hwang, Jun Cheon,
Kang Hyun Lee, Tae Gyun Kwon, Tae Young Jung, Moon Kee Chung, Sang Eun Lee, Hyun Moo Lee, Eun Sik Lee, Young Deuk Choi, Byung Ha Chung, Hyung Jin Kim, Wun-Jae Kim, Seok-Soo Byun, and Han Yong Choi
Large difference (≥ 2 points) between biopsy-derived (bGS) and post-prostatectomy Gleason scores (pGS) may confuse the clinicians in consulting the patients with prostate cancer. In the present study, we compared the prognosis of patients with the difference between pGS and bGS. When the pGS was changed from bGS by 2 points or above, such patients showed poor prognosis. Strikingly, even in the decreased group (pGS < bGS) showed poor prognosis. However the large difference between bGS and pGS was not an independent prognostic factor, and one should be cautious in the interpretation of the scoring values.