Environmental Science
Vol. 36, No. 3, pp. 199-206, September, 2020 https://doi.org/10.7747/JFES.2020.36.3.199
Assessment of Land Cover Changes from
Protected Forest Areas of Satchari National Park in Bangladesh and Implications for Conservation
Kazi Mohammad Masum and Md. Mehedi Hasan*
Department of Forestry and Environmental Science, Shahjalal University of Science & Technology, Sylhet 3114, Bangladesh
Abstract
Satchari National Park is one of the most biodiverse forest in Bangladesh and home of many endangered flora and fauna. 206 tons of CO2 per hectare is sequestrated in this national park every year which helps to mitigate climate issues. As people living near the area are dependent on this forest, degradation has become a regular phenomenon destroying the forest biodiversity by altering its forest cover. So, it is important to map land cover quickly and accurately for the sustainable management of Satchari National Park. The main objective of this study was to obtain information on land cover change using remote sensing data. Combination of unsupervised NDVI classification and supervised classi- fication using maximum likelihood is followed in this study to find out land cover map. The analysis showed that the land cover is gradually converting from one land use type to another. Dense forest becoming degraded forest or bare land. Although it was slowed down by the establishment of ‘National Park’ on the study site, forecasting shows that it is not enough to mitigate forest degradation. Legal steps and proper management strategies should be taken to mitigate causes of degradation such as illegal felling.
Key Words: land cover change, forest land, protected area, remote sensing
Received: February 22, 2020. Revised: June 20, 2020. Accepted: June 21, 2020.
Corresponding author: Md. Mehedi Hasan
Department of Forestry and Environmental Science, Shahjalal University of Science & Technology, Sylhet 3114, Bangladesh Tel: 8801786914995, Fax: 880-821-716312/715257, E-mail: [email protected]
Introduction
Protected areas (example: national Parks) concepts are the foundations of all regional biodiversity conservation ap- proaches (Masum et al. 2016). But establishment of Protected Area was not followed by effectual management and enforcement of regulations (UNEP 2007). Thus, driv- ers of global change such as land cover and land use change remain active in these important conservation areas, and consequently affect their biodiversity (Akber and Shrestha 2015; Masum et al. 2017; Humayun-Bin-Akram and Masum 2020). The global biodiversity situation is now threatened more than any time in its history (Food and
Agricultural Organization [FAO] 2016).
Satchari National Park is one of protected forest area in Bangladesh and home of many endangered flora and fauna.
But due to anthropogenic disturbances its land cover is changing on a continuous basis. Satchari National Park (SNP), also known as ‘The Forest of Seven Streams’ is a tropical mixed evergreen Hill Forest situated in Chunarughat Upazila in Habigonj District in Sylhet (Fox et al. 2007;
Mukul et al. 2017). SNP is in the South-West Monsoon climatic area and consists of hillocks extended from North India. Hillocks are separated by the streams flowing through the forest (Mukul et al. 2012). This creates a unique climate. Heavy rainfall occurs during June-
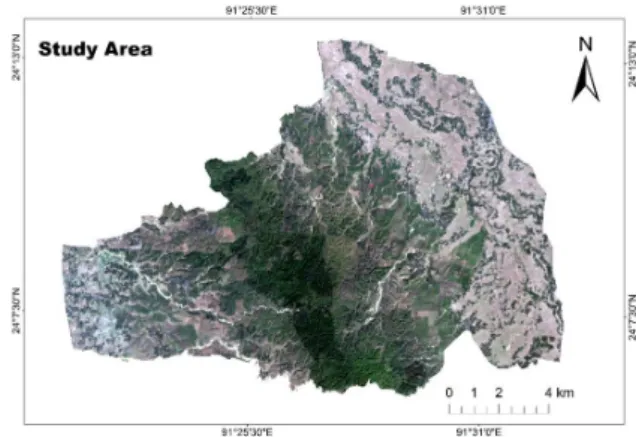
Fig. 1. Map of the study area (combination of band 2, 3 and 4 of landsat 8 OLI image).
September with an annual average of 4,160 mm (Uddin et al. 2013). This type of Hill Forest can also be found in Chittagong, Chittagong Hill Tracts and Cox’s Bazar other than Sylhet (Khan et al. 2007). SNP stands out among oth- er Hill Forests because of its ecosystem services and biodiversity. SNP sequestrates a hopping 266 tons CO2 per hectare per year. Over 200 species of flora and 264 species of fauna is reported to be in SNP. Many of them are en- demic, endangered or vulnerable (Nishorgo 2004).
Sustainable developments could be achieved ensuring con- servation and livelihood of forest dependent people by tak- ing appropriate management steps for SNP (Mukul et al.
2012). To find out changes of SNP along with its impact area over the past years, land use mapping for with regular interval is necessary. Using remote sensing images is pref- erable for this purpose as it is far more flexible and efficient than conventional survey (Redowan et al. 2014).
SNP was established in 2005 with an area of 243 hectares. SNP is threatened because of illegal felling, en- croachment and environmental hazards. These events not only affect the SNP itself but also the surrounding area (adjacent forest of Raghunandan reserve and dependent community area) termed as ‘Impact Area’. The total land- scape area associated with SNP has been estimated as 17,788.94 ha comprising 242.30 ha national park or core zone, 1552.60 ha of adjacent reserved forests or buffer zone, and about 15994.03 ha of impact area (Nishorgo Support Project 2016).
Forest land cover detection and estimation is the pre- requisite of forest management (Park et al. 2017b). Patches of bare land or lands with very low vegetation indicates weak health of forest. Forestry sector of Bangladesh esti- mates land cover manually by visiting the forest plots often including ocular estimates. This process is labor intensive and less accurate. Besides, gathered data soon become ob- solete and the necessity of repeating the process arises. This can be a daunting task for a huge forest like SNP. To ach- ieve more accurate result with less effort and to forecast, sat- ellite images of the area can be used (Park et al. 2017a). A digital land cover map was created by analyzing the satellite images of SNP and surrounding area which would help au- thorities to understand the trend of land cover changes and also to take timely action to save biodiversity of SNP. It will also aids in taking better management decision.
Materials and Methods
Study area
SNP in Chunarughat Upazila of Habiganj District is lo- cated nearly 130 km east-northeast of Dhaka and approx- imately 60 km southwest from Srimongal on the erstwhile Dhaka-Sylhet highway (Fig. 1) (Fox et al. 2013). This road forms the northern Park boundary starting from near Satchari Beat Office to the border of Chaklapunji Tea Estate. SNP was a part of Raghunandan Hill Reserve Forest. In October 2005, 243 hectares of forest in Satchari Beat within Raghunandan Hill Reserve Forest was de- clared as a National Park through Gazette Notification.
SNP is one of the most beautiful and bio- diverse forest.
The name Satchari came from the streams flowing through the forest. In Bengali, ‘Satchari’ means ‘Seven Streams’.
There are seven streams flowing in this jungle, thus the name. Stand structure of SNP is a mixture of tropical ever- green and semi-evergreen species. Land cover of SNP mainly includes Forests, Grasslands, Wetlands, Agricultural Lands and Settlements. SNP consists of 112 ha of planta- tion and 120 ha of natural forest. The plantations consist of Acacia (Acacia sp.), Akashmoni (Acacia auriculilormis), Mangium (Acacia mangium), Eucalyptus (Eucalyptus ca- maldulensis) and Malacanna (Albizia falcataria). Natural forest is dominated by Chapalish (Artocarpus chaplasha), Civit (Swintonia floribunda), Shimul (Bombax insignis), Fig (Ficus spp.) and Bamboo (Bambusa spp.). Over 245 species of flora and 264 species of fauna is found in SNP. In
Fig. 2. Flow chart of the research approach.
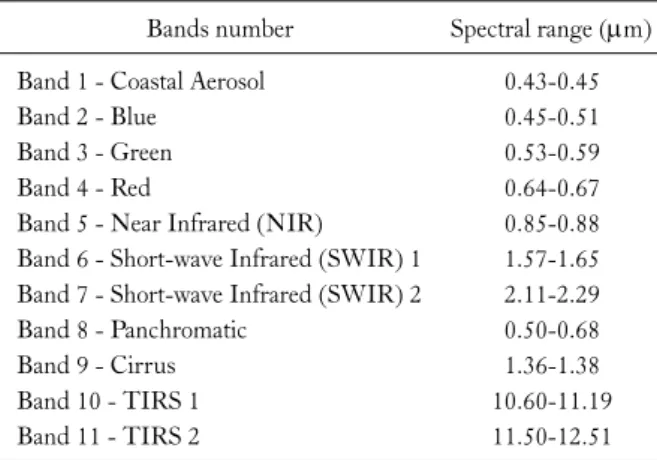
Table 2. Characteristics of landsat 8 OLI image bands
Bands number Spectral range (m) Band 1 - Coastal Aerosol 0.43-0.45
Band 2 - Blue 0.45-0.51
Band 3 - Green 0.53-0.59
Band 4 - Red 0.64-0.67
Band 5 - Near Infrared (NIR) 0.85-0.88 Band 6 - Short-wave Infrared (SWIR) 1 1.57-1.65 Band 7 - Short-wave Infrared (SWIR) 2 2.11-2.29
Band 8 - Panchromatic 0.50-0.68
Band 9 - Cirrus 1.36-1.38
Band 10 - TIRS 1 10.60-11.19
Band 11 - TIRS 2 11.50-12.51
Table 1. Characteristics of landsat 5 TM image bands Bands number Spectral range (m)
Band 1 - Blue 0.45-0.52
Band 2 - Green 0.52-0.60
Band 3 - Red 0.63-0.69
Band 4 - Near Infrared 0.77-0.90 Band 5 - Short-wave Infrared 1.55-1.75 Band 6 - Thermal Infrared 10.40-12.50 Band 7 - Short-wave Infrared 2.09-2.35 case of floral diversity, 73 species represented by trees, 46 by shrubs, 86 by herbs, 3 by epiphytes and 37 by climbers (Arefin et al. 2011). For fauna on the other hand, about 24 species represented by mammals, 38 by reptiles, 19 by am- phibian and 183 by bird (Nishorgo 2004).Also, a few threatened species of flora (Amomum aromaticum Roxb., Cymbidium aloifolium L., Rauvolfia serpentina L., Cyathea gigantea) and fauna (Hoolock Gibbons, Capped Langur and Pig-tailed Macaque) was found in here (Khan et al. 2001; Fox et al. 2013). To protect this invaluable bio- diversity, any changes especially land cover changes in SNP should be taken seriously. Fig. 1 depicts the map of the study area.
Satellite image acquisition
For this study, Landsat 5 satellite images of SNP were acquired from USGS for 1993 (dated 27 November) and 2006 (dated 31 December), and Landsat 8 satellite image for 2019 (dated 05 December). The resolution of both Landsat 5 and Landsat 8 is 30 m. The image possessed
good visibility and were free of cloud. The image projection system was UTM (Universal Traverse Mercator) 46N with datum WGS84. Characteristics of Landsat 5 and Landsat 8 images are listed in Table 1 and Table 2 respectively.
Methodology
Research approach and image processing procedure was done as shown on flow chart (Fig. 2).
Correction and subsetting
Radiometric correction and geometric correction were done before classification to reduce error and correct map coordinates respectively. Then the area of interest (AOI) was clipped with “Clip (Data Management)” tool in ArcGIS Pro. This process was repeated for all the images.
Calculation of vegetation index (VI)
Normalized Difference Vegetation Index (NDVI) was
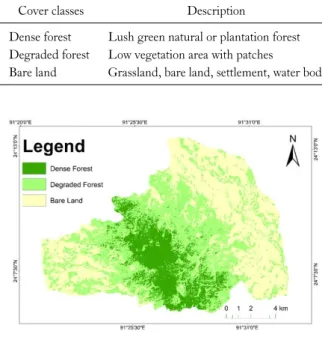
Fig. 4. Supervised classified image of SNP in 2019.
Fig. 3. NDVI image of SNP in 2019.
Fig. 5. Supervised classified image of SNP in 2006.
Table 3. Characteristics of land cover classes
Cover classes Description
Dense forest Lush green natural or plantation forest Degraded forest Low vegetation area with patches
Bare land Grassland, bare land, settlement, water body used to calculate the vegetation index for clipped images.
Unsupervised classification for NDVI value was done for 2019 Landsat OLI image to obtain rough idea about the land cover of the study site (Fig. 3). NDVI is the normal- ized ratio of reflectance value at red and near infrared part of the spectrum. NDVI value ranges from -1 to +1.
Negative value of NDVI indicates the presence of non-ve- getated surface like water body, bare land, settlements etc.
Zero (0) represents no-vegetation while 1 represents dense forest. NDVI is widely used because it only requires red and near infrared band and is applicable to multispectral data (Weier and Herring 2000).
Formula to Calculate NDVI:
NDVI=(NIR−Red)/(NIR+Red)
Ground truthing
Ground truthing is important to verify remotely sensed
data with field data. A total of 45 randomly selected sample points were taken during the ground survey to improve the accuracy of remotely sensed data. Any noticeable difference between field data and unsupervised classified NDVI value was examined to improve the accuracy of interactive su- pervised classification.
Supervised classification and land cover map
Supervised classification requires prior and first-hand knowledge of ground data and geographic reference about the study area (Redowan et al. 2014). Without proper first-hand knowledge, supervised classification can’t be done. Supervised classification of 2019 landsat 8 OLI im- age were done with ArcGIS taking the results from un- supervised classification into account (Fig. 4). The un- supervised classification was then reclassified in 3 major land cover type viz. dense forest, degraded forest and bare land (Table 3). 2006 and 1993 Landsat 5 TM images were also classified following the same category A signature file had been generated from the supervised classification which was then applied for maximum likelihood algorithm in 2006 (Fig. 5) and 1993 (Fig. 6) images to generate land cover map. Finally accuracy assessment was done to justify the acceptability of the interpreted image. Accuracy assess-
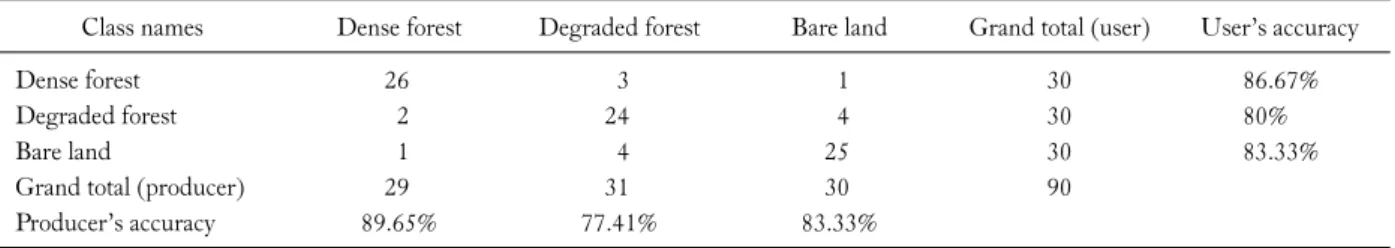
Table 5. Error matrix produced by supervised classification of 1993 landsat 5 TM image
Class names Dense forest Degraded forest Bare land Grand total (user) User’s accuracy
Dense forest 26 3 1 30 86.67%
Degraded forest 2 24 4 30 80%
Bare land 1 4 25 30 83.33%
Grand total (producer) 29 31 30 90
Producer’s accuracy 89.65% 77.41% 83.33%
Overall accuracy is 83.33%.
Fig. 6. Supervised classified image of SNP in 1993.
Table 4. Land cover change scenario for Satchari National Park
Year 1993 2006 2019 Changes from
1993-2006
Changes from 2006-20019
Forecasted value for 2032
Dense forest 4638.96 2864.97 1670.67 38.2% (-) 41.6% (-) 89.91
Degraded forest 5884.20 7391.79 8192.97 25.62% (+) 10.84% (+) 9465.09
Bare land 7264.62 7531.02 7924.14 3.66% (+) 5.22% (+) 8232.78
Total 17787.78 17787.78 17787.78 17,787.78 17787.78
ment establishes the information value of the resulting data to a user. The overall accuracy of the classified image com- pares how each of the pixels is classified versus the definite land cover conditions obtained from their corresponding ground truth data (Rwanga and Ndambuki 2017). Producer accuracy refers to the probability that a certain land-cover of an area on a ground is classified as such, on the other hand user’s accuracy refers to the probability that a pixel labelled as a certain land-cover class in the map is true (Hamzah et al. 2013).
Land cover change projection
A simple projection was made for the next epoch (thirteen-year interval) of 2032 based on the assumption that the rate of land cover will continue at the average rate seen between 1993, 2006 and 2019 (Table 4). A simple stat- istical relationship between the dependent variable, Y (deforestation and increase of urban area), and the in- dependent variable, X (epochs) was established. Trend lines were displayed on an Excel chart in “linear” setting accord- ing to Eq. (1).
Y=A+BX (1)
where-
A= and
Results
Accuracy assessment
Error matrixes (Confusion matrix) were generated to as- sess the accuracy of this study. Ninety random points were generated automatically by the analysis software accuracy measurement utility for all three images. All generated ran- dom points for each image was identified accordingly by its type and finally checked with the referenced data by the
Table 6. Error matrix produced by supervised classification of 2006 landsat 5 TM image
Class names Dense forest Degraded forest Bare land Grand total (user) User’s accuracy
Dense forest 25 2 3 30 83.33%
Degraded forest 1 25 4 30 83.33%
Bare land 1 5 24 30 80%
Grand total (producer) 27 32 31 90
Producer accuracy 92.59% 78.13% 77.14%
Overall accuracy is 82.22%.
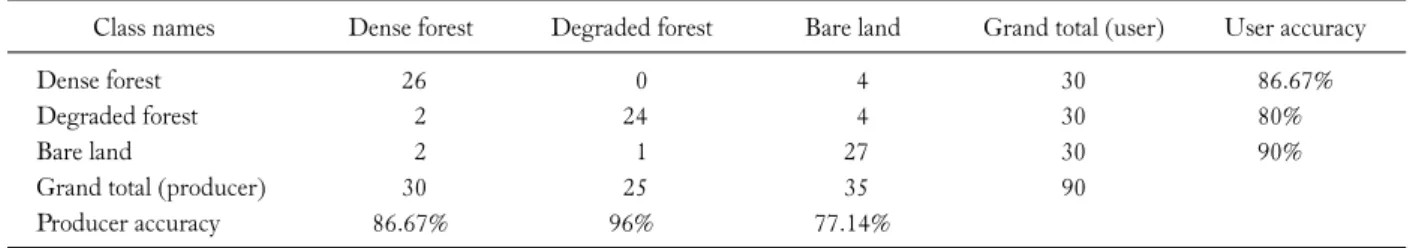
Table 7. Error matrix produced by supervised classification of 2019 landsat 8 OLI image
Class names Dense forest Degraded forest Bare land Grand total (user) User accuracy
Dense forest 26 0 4 30 86.67%
Degraded forest 2 24 4 30 80%
Bare land 2 1 27 30 90%
Grand total (producer) 30 25 35 90
Producer accuracy 86.67% 96% 77.14%
Overall accuracy is 85.56%.
software. Error matrix for the year of 1993, 2006 and 2019 images has been shown in Table 5, Table 6 and Table 7 respectively.
For 1993 Map, 75 of 90 validation ground point were perfectly classified. 3 validation points on dense forest was classified as degraded forest and 1 as bare land. 2 validation points on degraded forest was classified as dense forest and 4 as bare land. In case of bare land, 1 validation point was classified as dense forest and 4 as degraded forest. Overall accuracy was 83.33% (Table 5).
For 2006 Map, 74 of 90 validation ground point were perfectly classified. 2 validation points on dense forest was classified as degraded forest and 3 as bare land. 1 validation point on degraded forest was classified as dense forest and 4 as bare land. In case of bare land, 1 validation point was classified as dense forest and 5 as degraded forest. Overall accuracy was 82.22% (Table 6).
For 2019 Map, 77 of 90 validation ground point were perfectly classified. 4 validation points on dense forest was classified as bare land. 2 validation points on degraded for- est was classified as dense forest and 4 as bare land. In case of bare land, 2 validation points was classified as dense for- est and 1 as degraded forest. Overall accuracy was 85.56%
(Table 7).
Summary statistics of land cover in SNP
Summary was extracted from the attribute tables of su- pervised classified images of 1993, 2006 and 2019.
For the period of 1993 to 2006 (Table 4), it is clearly seen that dense forest decreased from 4638.96 ha to 2864.97 ha (38.2% Decrease). Degraded forest increased from 5884.2 ha to 7391.79 ha (25.62% Increase). Similarly, bare land in- creased from 7264.62 ha to 7531.02 ha (3.66% Increase).
Similarly, for the period of 2006 to 2019 (Table 4), dense forest decreased from 2864.97 ha to 1670.67 ha (41.6%
Decrease). Degraded forest increased from 7391.79 to 8192.97 ha (10.84% Increase) and bare land increased from 7531.02 ha to 7924.14 ha (5.22% Increase).
It is noticeable that forest degradation rate is higher in 1993 to 2006 period than in 2006 to 2019.Declaration as a National Park in late 2005 maybe a driver for less forest degradation.
Land cover forecast
Microsoft Excel ‘Forecast’ function was used to estimate future land cover of SNP. The forecast shows that dense forest will be decreased down to only 89.91 ha while de- graded forest and bare land will increase to 9465.09 ha and
8232.78 ha respectively (Table 4).
Discussion
Almost similar patterns in change occurred in both su- pervised and NDVI classification. During 1993-2006, dense forest was decreased heavily (38.2%) and both de- graded forest and bare land increased in area (25.62% and 3.66% respectively). Illegal felling and climatic hazard were very common during this period which clarifies the higher rate of increase in degraded forest.
During 2006-2019, the change of forest degradation is lower compared to 1993-2006 although still to be worried about. Changes had become slightly higher for dense forest (41.6%) and bare land (5.22%) but decreased for degraded forest (10.84%). Rate of change might have become lower for degraded forest because of the updated policy and man- agement implementation under the newly formed national park. Newly created core zone and the buffer zone slowed down the change. Climatic hazard increased to a noticeable extent because of commercial harvesting of sands from the streams within the forest. Illegal felling is a common issue in SNP which explains the decrease of dense forest (R. I.
Chowdhury, n.d.). However, increaset of bare land during this period indicates growing pressure of population and urbanization.
If land cover change occurs at this rate, dense forest will be reduced to only 89.91 ha rest being degraded forest or bare land within 2032. It will cause biodiversity and ecosys- tem service losses if not addressed properly.
Conclusion
In this study, Land Cover Change in and around SNP were mapped every 13-year (epoch) interval (1993, 2006, 2019). Firstly, SNP was mapped after being declared a
‘National Park’ for the period of 2006-2019. Then for the period of 1993-2006 when it was not a national park rather a part of Raghunandan Hill Reserve Forest. This was done intentionally to measure the land cover changes before and after the establishment as national park. Supervised and NDVI image classification were applied on acquired Landsat imageries for this purpose. It is clear from the study that a change on forest degradation tends to higher
before being declared as national park. At the current rate, dense forest will be degraded within next 13 years and will eventually be lost. Most of the protected areas including SNP lacks integration at policy level which is a threat to bi- odiversity conservation and hinders new project im- plementation (Chowdhury et al. 2014). Appropriate land use plan must be undertaken to prevent the loss.
Acknowledgements
We are thankful to the support of Wildlife Management and Nature Conservation Division, Moulvibazar, Forest Department, Bangladesh. We acknowledge Md. Humayun- Bin-Akram for his help in field level data collection in this study.
References
Akber MA, Shrestha RP. 2015. Land use change and its effect on biodiversity in Chiang Rai province of Thailand. J Land Use Sci 10: 108-128.
Arefin MK, Rahman MM, Uddin MZ, Hassan MA. 2011.
Angiosperm Flora of Satchari National Park, Habiganj, Bangladesh. J Plant Taxon 18: 117-140.
Chowdhury MSH, Nazia N, Izumiyama S, Muhammed N, Koike M. 2014. Patterns and extent of threats to the protected areas of Bangladesh: the need for a relook at conservation strategies.
Parks 20: 91-104.
Chowdhury RI. 2013. Attitudes Towards Co-Management: is Satchari National Park a Suitable Model for Bhawal National Park? In: Connecting Communities and Conservation: Co- Management Initiatives Implemented by IPAC in Wetlands and Forests of Bangladesh (Fox J, Mustafa MG, Bushley BR, Brennan SM, Durand L, eds). USAID, Dhaka, pp 24-43.
FAO. 2006. Global Forest Resources Assessment 2005: Progress Towards Sustainable Forest Management. FAO, Rome, 320 pp.
Fox J, Bushley BR, Dutt S, Quazi SA. 2007. Making Conservation Work: Linking Rural Livelihoods and Protected Area Management in Bangladesh. Nishorgo Program of the Bangladesh Forest Department, Dhaka, pp 110-130.
Fox J, Mustafa MG, Bushley BR, Brennan SM, Durand L. 2013.
Connecting Communities and Conservation: Co-Management Initiatives Implemented by IPAC in Wetlands and Forests of Bangladesh. USAID, Dhaka, 206 pp.
Hamzah KA, Idris AS, Parlan I. 2013. Classification of Degraded Peat Swamp Forest for Restoration Planning at Landscape Level Using Remote Sensing Technique. J For Environ Sci 29:
49-57.
Humayun-Bin-Akram M, Masum KM. 2020. Forest Degradation
Assessment of Ratargul Special Biodiversity Protection Area for Conservation Implications. Forestist 70: 77-84.
Khan MASA, Uddin MB, Uddin MS, Chowdhury MSH, Mukul SA. 2007. Distribution and Status of Forests in the Tropics: Bangladesh Perspective. Proc Pakistan Acad Sci 44:
145-153.
Khan MS, Rahman MM, Ali MA. 2001. Red Data Book of Vascular Plants of Bangladesh. Bangladesh National Herbarium, Dhaka, 179 pp.
Masum KM, Islam MN, Saha N, Hasan MZ, Mansor A. 2016.
Assessment of Land Grabbing from Protected Forest Areas of Bhawal National Park in Bangladesh. Landsc Res 41: 330-343.
Masum KM, Mansor A, Sah SAM, Lim HS, Hossain MK.
2017. Effect of Differential Forest Management on Biodiversity in a Tropical Hill Forest of Malaysia and Implications for Conservation. Biodivers Conserv 26: 1569-1586.
Mukul SA, Rashid AZMM, Quazi SA, Uddin MB, Fox J. 2012.
Local peoples' responses to co-management regime in protected areas: a case study from Satchari National Park, Bangladesh.
For Trees Livelihoods 21: 16-29.
Mukul SA, Sohel MSI, Herbohn J, Inostroza L, König H. 2017.
Integrating ecosystem services supply potential from future land-use scenarios in protected area management: a Bangladesh case study. Ecosyst Serv 26: 355-364.
Nishorgo Support Project. 2016. Management Plan For Sathchari National Park, Bangladesh Forest Department, Dhaka, Bangladesh.
Park J, Park J, Lee J. 2017a. Prediction of Land Use/Land Cover Change in Forest Area Using a Probability Density Function. J For Environ Sci 33: 305-314.
Park J, Yim J, Lee J. 2017b. Evaluation of a Land Use Change Matrix in the IPCC’s Land Use, Land Use Change, and Forestry Area Sector Using National Spatial Information. J For Environ Sci 33: 295-304.
Redowan M, Akter S, Islam N. 2014. Analysis of Forest Cover Change at Khadimnagar National Park, Sylhet, Bangladesh, Using Landsat TM and GIS Data. J For Res 25: 393-400.
Rwanga SS, Ndambuki JM. 2017. Accuracy Assessment of Land Use/Land Cover Classification Using Remote Sensing and GIS. Int J Geosci 8: 611-622.
Nishorgo. 2004. Satchari National Park. http://nishorgo.org/proj- ect/satchari-national-park/
Uddin MB, Steinbauer MJ, Jentsch A, Mukul SA, Beierkuhnlein C. 2013. Do environmental attributes, disturbances and pro- tection regimes determine the distribution of exotic plant species in Bangladesh forest ecosystem? For Ecol Manage 303: 72-80.
United Nations Environment Programme. 2007. Section B: State and Trends of the Environment: 1987-2007. In: Global Environment Outlook: GEO 4 Environment for Development (United Nations Environment Programme, ed). United Nations Environment Programme, Valetta, pp 115-156.
Weier J, Herring D. 2000. Measuring vegetation (NDVI & EVI).
NASA Earth Observatory. http://earthobservatory. nasa.
gov/Features/MeasuringVegetation/, site consultado a. 2015;15.