Vol. 28, No. 3, pp. 152-157, August, 2012 http://dx.doi.org/10.7747/JFS.2012.28.3.152
Monitoring of Deforestation and Fragmentation in Sarawak, Malaysia between 1990 and 2009 Using Landsat and SPOT Images
Kamlisa Uni Kamlun1,*, Mia How Goh1, Stephen Teo1,2, Satoshi Tsuyuki3 and Mui-How Phua1
1School of International Tropical Forestry, Universiti Malaysia Sabah, Sabah, Malaysia
2Forest Department Sarawak, Level 5, Wisma Sumber Alam, 92660 Kuching, Sarawak, Malaysia
3Laboratory of Global Forest Environmental Studies, Department of Global Agricultural Sciences, Graduate School of Agricultural and Life Sciences, The University of Tokyo, Bunkyo, Tokyo, Japan
Abstract
Sarawak is the largest state in Malaysia that covers 37.5% of the total land area. Multitemporal satellite images of Landsat and SPOT were used to examine deforestation and forest fragmentation in Sarawak between 1990 and 2009.
Supervised classification with maximum likelihood classifier was used to classify the land cover types in Sarawak. The overall accuracies of all classifications were more than 80%. Our results showed that forests were reduced at 0.62%
annually during the two decades. The peat swamp forest suffered a tremendous loss of almost 50% between 1990 and 2009 especially at coastal divisions due to intensified oil palm plantation development. Fragmentation analysis revealed the loss of about 65% of the core area of intact forest during the change period. The core area of peat swamp forest had almost completely disappeared during the two decades.
Key Words: land cover change, fragmentation, remote sensing, GIS, Borneo
Received: June 14, 2012. Revised: August 8, 2012. Accepted: August 9, 2012.
Corresponding author: Kamlisa Uni Kamlun
School of International Tropical Forestry, Universiti Malaysia Sabah, UMS Road, Kota Kinabalu, Sabah 88400, Malaysia Tel: 6088320118, Fax: 6088320876, E-mail: [email protected]
Introduction
Deforestation is a long term or permanent loss of forest cover, which is converted to other land use that is caused ei- ther by natural or human causes (FAO 2007). It accounts for 17% of total anthropogenic greenhouse gases (GHGs) emission (IPCC 2007), with the major source from defor- estation at an unprecedented rate in the tropics (Defries et al. 2007). Deforestation not only increases the GHGs emis- sions but also changes the landscape configuration that leads to habitat fragmentation (Skole and Tucker 1993).
Habitat fragmentation is the breakup of a habitat or cover type into smaller and less connected areas which commonly
referred to as patches (Turner et al. 2001). Fragmentation is associated with the fluxes of species, energy and matter af- fecting the ecological conditions of the remaining forests (Gasparri and Grau 2009). Continuation of fragmentation will initiate threats to biodiversity of a natural ecosystem (Abdullah and Nakagoshi 2006).
Deforestation is obvious to observe but associated frag- mentation is a different dimension of forest changes that is equally important to monitor. A combination of remote sensing and Geographic Information System (GIS) pro- vide a dynamic information system for land use planning and developing national development policy (Sohel et al.
2011). Multitemporal monitoring of forest changes that are
linked to fragmentation analysis are invaluable techniques of assessing the degree of threats to a forest ecosystem (Sader et al. 2001). Landscape metrics have been used to monitor the pattern of forest changes that is not readily visi- ble to human eye or easily detectable by human analysis (Frohn 1998). Riitters et al. (2000) developed a forest frag- mentation model that classifies forest pixels into six catego- ries based on forest density and connectivity. This model has been useful to multitemporal monitoring of fragmenta- tion of peat swamp forest in Sabah, Malaysia (Phua et al.
2008).
Sarawak is the largest state (12.3 million ha) in Malaysia that occupies 37.5% of the total land. One of the driven forces of land cover change is the dependency on state econ- omy of forestry that contributes to 52% of state revenue (Hansen 2005). Land cover change in Sarawak has been monitored for recent decades with Landsat data, which were affected by clouds and shadows. Expansion of agricul- tural land especially for oil palm plantation was the main cause of deforestation in recent years (Tsuyuki et al. 2011).
In this paper, we provide an update on land cover changes in the recent two decades and monitor fragmentation of the forest types that suffer highest area loss. We used satellite images of Landsat and SPOT for monitoring deforestation in Sarawak at a landscape scale between 1990 and 2009.
Based on the land cover classifications, patterns of forest fragmentation were monitored using the forest fragmenta- tion model of Riitters et al. (2000).
Materials and Methods
Study area
Sarawak is the largest state of Malaysia that is situated in Borneo Island. It is located between 0o 50’ and 5o 00’ latitude and 109o 35’ and 115o 40’ longitude. The total area of Sarawak is 123,300 km2 and about 720 km from Peninsular Malaysia. Sarawak is categorized as humid tropical region with a wet season from October to February. The topography is flat and undulating. Hilly area is found in the southern part, near the border between Sarawak and Kalimantan.
There are five main natural forest types in Sarawak namely; hill mixed Dipterocarp forest, peat swamp forest, mangrove forest, kerangas forest (heath forest) and mon- tane forest. Distributions of these forest types depend on al-
titude, soil conditions and water regime. While there are still large tracts of forests remain, the inland areas have been modified by shifting cultivation activities. Recent agricul- tural development especially oil palm plantation dominates the coastal plains of Sarawak.
Data acquisition and pre-processing
Multi-temporal Landsat satellite images between 1990 and 2009 were the main data for monitoring deforestation in Sarawak. A total of nine scenes were needed to cover the whole area of Sarawak. Nine images of Landsat5-TM ac- quired in 1990 were downloaded from USGS website.
Multiple Landsat7-ETM+ images in 2009 were down- loaded for each of the nine scene areas for correcting the missing line errors. The Landsat7-ETM images contained 5% to 40% cloud covers. For each scene area, the best-qual- ity image with least cloud cover was placed on top while the remaining images were used to fill the missing lines. A mi- nority filter (3x3) followed by a median filter (5x5) was used to eliminate the linear residues resulted from the miss- ing line correction. In addition, three SPOT 4-HRVIR images acquired in 2010 were used to fill in areas that were heavily affected by clouds.
Deforestation rates and pattern
Post-classification comparison approach was used to identify the land cover change in Sarawak between 1990 and 2009. Most of the land cover change studies adopt ei- ther supervised or unsupervised classification in determin- ing the spectrally distinctive land cover classes (Smits et al.
1999). In this study, all the preprocessed satellite images were classified using supervised classification with max- imum likelihood algorithm. Ten land cover classes were de- fined; intact forest, degraded forest, peat swamp forest (PSF), mangrove, rubber, oil palm, grassland, bareland, water and cloud were classified. 5x5 majority filtering was applied on the land cover classification maps to reduce the salt and pepper effect. Digital Elevation Model (DEM) of the Shuttle Radar Topography Mission (SRTM) data was used to correct forest areas above an elevation of 60m that were misclassified as PSF. The areas covered by clouds were masked out from both images.
For land cover classification of 1990, reference data were generated from historical land use maps with scales of
0 40 60
20 80 100
0
20 100 40 60 80
Connectivity [%]
Density [%]
Patch Transitional
Edge Perforated
Interior Core
No Forest
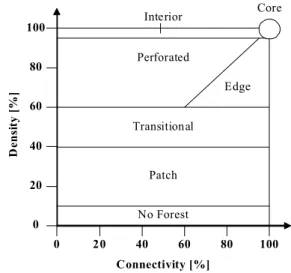
Fig. 1. Forest fragmentation categories.
1:50,000 and 1:25,000 from the Department of Survey and Mapping, Malaysia. The maps covered areas of Nanga Tamin, Tian, Sibu, Sarikei, Serantok and Kuching. We generated 660 points using user defined point for assessing the accuracy of the land cover classification of 1990. For land cover classification of 2009, 450 points were collected for accuracy assessment. Of these reference points, 105 points were collected in the field works in December 2009 and July 2010. The remaining ground truth points were obtained from high-resolution quick-looks images in Google Earth.
Annual deforestation rate can be calculated as follows (Puyravaud 2003),
P
Where A1 and A2 are the forest cover at time t1 and t2 re- spectively (the unit indicates per year or percentage per year).
Fragmentation analysis
Two key parameters in the Riitters model are forest den- sity (Pf) and forest connectivity (Pff). Both parameters are calculated for a focal pixel based on neighborhood analysis.
Pf within a moving window is calculated as follows,
pixels water non all of number
pixels forest of number Pf=
Similarly, Pff is calculated from the neighborhood with the following formula:
forest pixel one least at with pairs pixel of number
forest pixels both with pairs pixel of number Pff=
Based on the two parameters, the fragmentation model identifies six categories of fragmentation classes of interior, undetermined, perforated, edge, transitional and patch.
The calculated Pf and Pff were converted to percentage with a multiplication factor of 100. Using density and con- nectivity, each pixel can be assigned to one of six forest frag- mentation classes. If we express the density and con- nectivity ratios as percentages by multiplying it with factor 100, the fragmentation classes can be defined as follow,
i. interior, if density=100%
ii. undetermined, if density>60% and density=con- nectivity
iii. perforated, if density>60% and density>con- nectivity
iv. edge, if density>60% and density<connectivity v. transitional, if density is between 40% and 60%
vi. patch, if density<40%
Forest fragmentation classes can be differentiated using different threshold values. The interior classis defined with density above 90% and core pixels with density of 100%.
Any remaining pixels, although rare, is labelled as un- determined (Fig. 1).
In this study we examined the fragmentation for intact forest, peat swamp forest and mangrove forest. These forest types were extracted from the land cover classifications of 1990 and 2009 for forest fragmentation analysis using the Riitters model in SAGA-GIS. The connectivity values were calculated with an immediate neighborhood, 3x3 moving windows.
Results and Discussion
Land cover classification accuracy assessment Accuracies of land cover classifications in 1990 and 2009 were assessed using separate sets of reference points. The overall accuracies of land cover classifications of 1990 and 2009 were 86% and 80% respectively. Land cover classi- fication accuracy that is higher than 80% is considered ac- curate and reliable (Swain and Davis 1978). We also calcu- lated the kappa accuracy for each of the land cover classifications. The Kappa accuracy was 0.84 and 0.75 for land cover classification in 1990 and 2009 respectively. The
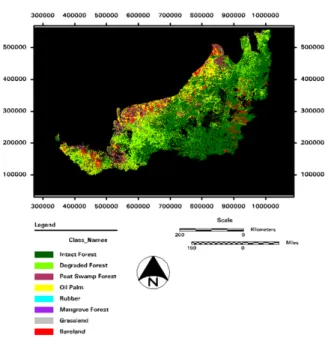
Fig. 2. Land cover classification of 1990.
Fig. 3. Land cover classification of 2009.
Fig. 4. Coastal Mukah area shows conversion of peat swamp forest to other land use from 1990 image satellite to 2009 image satellite.
missing lines in Landsat7-ETM+ data were likely the cause of the lower accuracy in the land cover classification of 2009.
Land cover change and deforestation
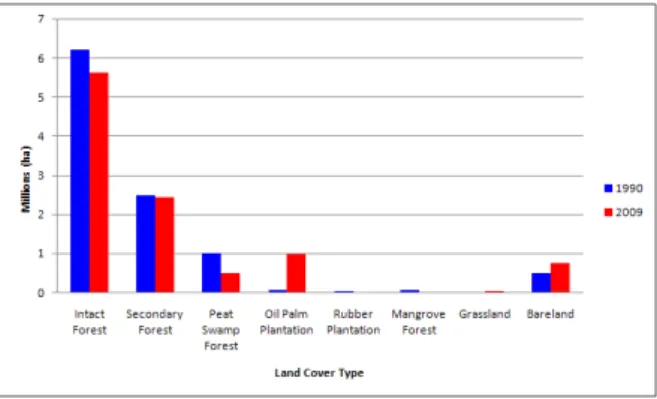
Fig. 2. shows that the intact forest, with more than 6 mil-
lion ha, was the largest land cover type in 1990. Although it remained as the largest land cover type in 2009, more than 550,000 ha were deforested (Fig. 3). Half a million ha of peat swamp forest was cleared from 1990 to 2009 (Fig. 5).
The forests of Sarawak have been pressured by large-scale expansion of oil palm development (Tsuyuki et al. 2011).
Our results showed that the forests (intact forest, degraded forest, peat swamp forest and mangrove forest) were re- duced at 0.62% annually during the two decades. The oil palm was the fastest growing agricultural crop in Sarawak.
Oil palm plantation increased about 70% annually between 1990 and 2008 (Mohd Basri and Mohd Arif 2009). Our results indicated an annual increment of 77.4% for the oil palm plantation. The Sarawak state government had tar- geted in 2007 to develop about 1 million ha of oil palm plantation by 2010 (MPOB 2007). Our findings showed that Sarawak’s oil palm plantation has reached about 1 mil- lion ha in 2009. These recent oil palm plantation develop- ments took place at the peat swamp forest, mainly located at the coastal divisions of Sibu, Mukah, Bintulu and Miri (Fig. 4).
In 1980, 1.6 million ha of peat swamp forest was re- ported (Wong 1991). Our results indicated that only about
Fig. 5. Land cover types of Sarawak in 1990 and 2009.
Fig. 6. Forest fragmentation from 1990 to 2009 (ha).
1 million ha of the peat swamp forest was found in 1990 and almost half a million ha was cleared in the following two decades. Oil palm planters prefer peatland for planting oil palm because of the higher yield of production (Phillips 1998). In addition, planting oil palm on flat plain provides better harvest management. The deforestation rate of peat swamp forest between 1990 and 2009 was calculated at 2.6% per year. With Moderate-resolution Imaging Spectoradiometer (MODIS) data (250 m), Miettinen et al.
(2011) found that peatlands in Sarawak have been drasti- cally reduced with an annual rate of 8% between 2000 and 2010. The difference could be attributable to the differ- ences in spatial resolution and change period.
Fragmentation of intact forest
Applying the Riitters model of fragmentation in SAGA-GIS showed that the intact forest in Sarawak has become more fragmented in 2009, compared to 1990. The core area had declined more than 600,000 ha from year 1990 to 2009 (Fig. 6). Over the two decades, the patch areas had reduced about half. Such rapid disappearance in- dicates that the patches are converted to other land cover types (Manier and Laven 2001).
For peat swamp forest, 95% of the core area was lost dur- ing the two decades. There was a reduction of 58872 ha from 1990 to 2009 for the patch category, which indicates very high degree of fragmentation. Due to the high demand of timber products, both within and outside of Malaysia, overall timber production of Sarawak had been driven to its peak capacity (Majid-Cooke 1999). Deforestation in Sarawak is often associated with logging and reclassi-
fication of the state forest area to allow conversion to oil palm plantations especially in peat swamp forest area (Hansen 2005). The commercial loggers were identified as the main culprits of major forest fragmentation in Sarawak but not shifting cultivators (Nor Rasidah 2010).
The core class for mangrove forest was only 35ha in 1990 and completely lost in 2009. The producer and user accuracies of the classification of mangrove forest in 2009 were relatively low. Mangrove is difficult to classify due to spectral confusion with other types of wetlands (Ozesmi and Bauer 2002). However, the trends of rapid defor- estation and fragmentation were clear for the mangrove forest.
Conclusions
Rapid deforestation in the tropics threatens biodiversity and accelerates carbon emissions into the atmosphere. We classified the land cover typesof Sarawak in 1990 and 2009 using Landsat and SPOT data for land cover change analysis. The intact forest shrank more than half a million ha during that period. The peat swamp forest lost half dur- ing the change period. Overall, forests were cleared at 0.62% per year in the two decades mainly for oil palm plan- tation, which increased more than 70% per year in the two decades. The intact forest had become very fragmented.
The peat swamp forest had become critically fragmented and the core area almost completely disappeared. It was at- tributed to recent intensified oil palm development in the peat swamp forest. The deforestation and fragmentation
during the two decades reflect the emphasis of agricultural development over sustainable forestry in the largest state of Malaysia. Similar trend is expected to continue unless more forests are gazetted as permanent forest reserves.
Acknowledgements
We thank Sarawak Forestry Department for support and cooperation. This study was supported from the Grant of Asia Pacific Network for Global Change Research (ARCP2010-02CMY-Phua) and Postgraduate Research Grant of Universiti Malaysia Sabah (GPS0016).
References
Abdullah SA, Nakagoshi N. 2006. Forest fragmentation and its correlation to human land use change in the state of Selangor, peninsular Malaysia. Forest Ecology and Management 241:
39-48.
DeFries R, Achard F, Brown S, Herold M, Murdiyarso D, Schlamadinger B, de Souza Jr C. 2007. Earth observations for estimating greenhouse gas emissions from deforestation in de- veloping countries. Environmental Science and Policy 10:
385-394.
FAO. 2007. Definitional issues related to reducing emissions from deforestation in developing countries. Forest and Climate Change Working Paper. Vol. 5.
Frohn RC. 1998. Remote Sensing for Landscape Ecology: New Metrics for Monitoring, Modeling, and Assessment of Ecosy- stems. Lewis Publishers, Florida.
Gasparri NI, Grau HR. 2009. Deforestation and fragmentation of Chaco dry forest in NW Argentina (1972-2007). Forest Ecol Manage 258: 913-921.
Hansen TS. 2005. Spatio-temporal aspect of land use and land cov- er change in the niah catchment, Sarawak, Malaysia. Singapore J Trop Geogr 26: 170-190.
IPCC. 2007. Climate Change 2007: Synthesis report. Intergovern- mental Panel on Climate Change (IPCC). http://www.ipcc.ch.
Accessed 24 Dec 2011.
Majid-Cooke F. 1999. The challenge of sustainable forests: forest resource policy in Malaysia, 1970-1995.
Malaysian Palm Oil Board (MPOB). 2007. Sarawak Sasar 1 Juta Hektar 2010.
Malaysia Oil Palm Board (MPOB). 2007. Industri Sawit Tingkatkan Sosioekonomi. Malaysia Palm Oil Board. http://mpob.gov.
my/html/05_pi/gfx_bs/bs66_01a.jpg. Accessed 18 Aug 2012 Manier DJ, Laven RD. 2001. Changes in landscape patterns asso-
ciated with the persistence of aspen (Populus tremuloides Michx.) on the westernslope of the Rocky Mountains, Colorado.
Forest Ecology and Management 167: 263-284.
Miettinen J, Shi C, Liew SC. 2011. Deforestation rates in insular Southeast Asia between 2000 and 2010. Global Change Biology 17: 2261-2270.
Mohd Basri W, Mohd Arif S. 2009. Issues related to Production Cost of Palm Oil in Malaysia. Oil Palm Industry Economic Journal 9: 1-12.
Nor Rasidah H. 2010. Analyzing long-term landscape changes in a borneon forest reserve using. Aerial photographs. Open Geogr J 3: 161-169.
Ozesmi SL, Bauer ME. 2002. Satellite remote sensing of wetlands.
Wetlands Ecology and Management 10: 381-402.
Phillips VD. 1998. Peatswamp ecology and sustainable develop- ment in Borneo. Biodiversity and Conservation 7: 651-671.
Phua MH, Conrad O, Kamlisa UK, Fischer M, Böhner J. 2008.
In: Multitemporal Fragmentation Analysis of Peat Swamp Forest in the Klias Peninsula, Sabah, Malaysia using GIS and Remote Sensing Techniques (Böhner J, Blaschke T, Montanare- lla L, eds). Hamburger BeiträgezurPhysischenGeographie und Landschaftsökologie, Universität Hamburg Institutfür Geo- graphie, Hamburg, pp 81-90.
Puyravaud JP. 2003. Standardizing the calculation of the annual rate of deforestation. Forest Ecology and Management 177:
593-596.
Riitters K, Wickham J, O'Neill R, Jones B, Smith E. 2000.
Global-scale patterns of forest fragmentation. Conservation Ecology 4: 3.
Sader SA, Hepinstall DJH, Coan M, Soza C. 2001. Forest change monitoring of a remote biosphere reserve. Int J Rem Sens 22:
1937-1950.
Skole D, Tucker C. 1993. Tropical deforestation and habitat frag- mentation in the Amazon: satellite data from 1978 to 1988.
Science 260: 1905-1910.
Smits PC, Dellepiane SG, Schowengerdt RA. 1999. Quality as- sessment of image classification algorithm for land-cover map- ping: review and a proposal for a cost- based approach. Int J Rem Sens 20: 1461-1486.
Sohel MSI, Rana MP, Islam AZMZ, Akhter S. 2011. Monitoring land-use changes by remote sensing and GIS techniques: case study of barind tract, Bangladesh. Journal of Forest Science 27:
73-79.
Swain PH, Davis SM. 1978. Remote sensing: the quantitative approach. McGraw-Hill, New York.
Tsuyuki S, Goh MH, Teo S, Kamlisa UK, Phua MH. 2011.
Monitoring deforestation in Sarawak, Malaysia using multi- temporal landsat data. Kanto For Res J 62: 87-90.
Turner MG, Gardner RH, O'Neill RV. 2001. Landscape Ecology in Theory and Practice: Pattern and Process. Springer Science, New York.
Wong MH. 1991. The Distribution Characteristics and Agricul- tural Utilization of Peat in Sarawak. Kuching, Malaysia.
Sarawak Agriculture Department, Kuching.