Environmental Science
Vol. 31, No. 1, pp. 14-23, February, 2015 http://dx.doi.org/10.7747/JFES.2015.31.1.14
Properties of Soils under Different Land Uses in Chittagong Region, Bangladesh
Md. Akhtaruzzaman1*, K.T. Osman1 and S. M. Sirajul Haque2
1Department of Soil Science, University of Chittagong, Chittagong-4331, Bangladesh
2Institute of Forestry and Environmental Sciences, University of Chittagong, Chittagong-4331, Bangladesh
Abstract
In this study, we investigated the effects of three land uses on soil properties in two soil layers; surface soil (0∼15 cm) and subsoil (15∼30 cm). Soil samples were collected from planted forest, barren lands and cultivated lands from different areas in Chittagong Cox’s Bazar and analyzed for some physical and chemical properties. Results showed that soil textural class varied from sandy clay loam in planted forest and barren land site to sandy loam in cultivated soils. Maximum water holding capacity was higher in forest followed by barren land and the lowest in cultivated lands. At both soil depths, soils of cultivated land showed the highest values of bulk density (1.42 to 1.50 g cm-3), followed by barren lands (1.37 to 1.46 g cm-3) and the least (1.32 to 1.45 g cm-3) in forest soils. Total porosity decreased with depth ranging from 40.24% to 41.53% in subsoils and from 42.04 to 43.23% in surface soil of cultivated and of planted forest sites respectively. The result further revealed that organic carbon (OC) and total nitrogen (TN) contents were higher in the planted forest soil than in other two land uses. The soils of all land uses under study are acidic in nature and the lowest pH was found in both surface and subsoils of barren land. Cultivated soil contained the highest amount of available P, Ca, Mg and K in both surface soil and subsoils. In contrast, barren site had the lowest contents of available P, Ca, Mg and K in both layers. The soil organic carbon (SOC) and total N storage were higher in planted forest than in barren and cultivated land uses.
Key Words: land use types, soil physical properties, soil chemical properties, soil carbon storage, total nitrogen storage
Received: June 29, 2014. Revised: August 13, 2014. Accepted: August 24, 2014.
Corresponding author: Md. Akhtaruzzaman
Department of Soil Science, University of Chittagong, Chittagong-4331, Bangladesh Tel: 88-031-716552-Extn. 4296, Fax: 88-031-2606014, E-mail: [email protected]
Introduction
Soil nutrient status can be changed due to the change of the natural forest to different land use type. Rapid pop- ulation growth in the country like Bangladesh creates ex- treme pressure on its forest resources. As a result of increas- ing demand for firewood, timber, pasture, shelter and food, forests are being clear cut at an alarming rate. This results in destruction of natural forest ecosystems and loss of soil quality.
Most of the cleared forest lands have been used for crop
production, but if the land is kept fallow, clear felling is fol- lowed by natural generation of herbs, shrubs and grasses.
The conversion of forest into other land uses affects soil properties in many ways. Land use changes may influence many natural phenomena and ecological processes includ- ing soil nutrient and soil water change (Fu et al. 1999;
2000). Land use/land cover changes (degradation of natu- ral forest and subsequent cultivation of soils) resulted in surface compaction and significant decreases in silt and clay contents, porosity and aggregate stability (Islam and Weil 2000). The conversion of natural forest ecosystems into cul-
tivation and monoculture plantations can change the nu- trient cycling processes through changes in plant cover and species composition owing to differential patterns among plant species in litter production and turnover and nutrient accumulation (Lugo 1992). Frequent harvesting of forest plantations result in long-term decline in soil organic car- bon (SOC) and nutrient content due to disruption of the flow of carbon and nutrients through litter, removal of large amounts of nutrients from the soil through biomass and al- so losses by erosion and leaching (Zech and Drechsel 1998). However, the continuous conversion of vegetal areas to non-vegetal surfaces reduces soil productivity as a result of increased soil erosion and changes in moisture content.
SOC loss caused by the conversion of natural to culti- vated vegetation is well documented (Yan et al. 2012).
Globally, 24% of the SOC stock has been lost through the conversion of forestland to cropland (Murty et al. 2002).
Land-use change is also associated with changes in land cover and C stocks (Bolin and Sukumar 2000). Each soil has an equilibrium C storage potential that is determined by the nature of vegetation, climatic conditions, and phys- icochemical properties of the soil (Six et al. 2002).
Cultivation can alter soil physical, chemical, and bio- logical properties (Grant and Lafond 1993). Several studies have reported the negative impacts of tillage, crop rotation, inappropriate agricultural management and indiscriminate supply of nutrients on soil quality (Angers 1992; Ismail et al. 1994). Soil nutrient status can be changed where forest is cleared for agricultural cultivation, allowed to revert to nat- ural vegetation or replanted to perennial vegetation (Fu et al. 2001). In most cases, more soil nutrients are removed from the system by leaching, gaseous losses, soil erosion and through crop uptake than are returned to the soil in the form of litter fall or crop residues. Such variation in land cover may have an impact on soil properties. Changes in land use cover have significant effect on the amount and di- versity of biomass returned to the soil, which was also re- lated to the nutrient pool restored to the soil. There is strong rational for predicting that land cover would have a significant influence on soil properties and nutrient condi- tions. A few reports or information on changes in soil prop- erties after forest clearing are available in the literature.
There is a need for determining soil properties due to the effect of land use change from forest to the cultivated land.
On this background, the present study was undertaken to determine some physicochemical properties of land with different cover that can be used as a baseline for refor- estation and soil management.
Materials and Methods
Study area
The soils under present investigation are at hilly region and have similar soil parent materials (Tertiary sediments), parent rocks (Tertiary rocks) and climate. Topography and slope gradient of the study sites are more or less similar.
The soils under study are classified as Brown Hill Soils as general soil type.
Chittagong region has a sub-tropical climate, with annu- al temperatures varying from 13oC in January to 32oC in April, May. Chittagong receives on an average 2735 mm of precipitation annually. The dry season, prevailing from November to February, is cool and dry and receives about 2% of the total annual rainfall, mostly occasionally drizzles.
Hill soil has developed from tertiary sediments of Dupi Tila formation. The Dupi Tila series is also characterized by the presence of inter-bedding of sandstones and shales and local occurrence of fossilized or silicified wood frag- ments and conglomerate. Ringbong plantation forest situ- ated at Chakaria forest beat in Faissakhali range under Chittagong South Forest Division. The forest comprises mainly dhaki jam (Syzygium grande) and garjan (Dipterocarpus turbinatus, Dipterocarpus alatus) species (planted in 1979).
The barren site and nearby cultivated site under study were located at inside and outside of Chittagong University, Hathazari upazilla of Chittagong district respectively. The three locations (i.e. planted forest land, barren land and cul- tivated land) were selected for soil sampling (Fig. 1). The basic site information of three land use types was given in Table 1.
Sampling method
There were three 10×10 m plots chosen in each land use. Soil samples were taken from two layers of 0∼15 and 15∼30 cm at four corners of each plot as described above.
Before collecting samples, first the ground litter and grassy materials were removed. The soil samples were then col- lected in three replicates from each depth mixed thoroughly
Fig. 1. Study area of Chittagong region, Bangladesh.
Table 1. Land use of different sites under study
Land use type Latitude (N) Longitude (E) Land use Topography Slope (%)
Planted forest land 21o40΄07″ 092o05΄02″ Syzygium grande, Dipterocarpus turbinatus, Dipterocarpus alatus
High land Nearly level (3%)
Barren land 22o27΄97″ 91o46΄81″ Herbs, shrubs, grasses High land Nearly level (2%) Cultivated land 22o28΄69″ 91o47΄71″ Summer crops- Fallow- Winter crops Medium High land Nearly level (2%)
to form a composite soil sample and brought to the labo- ratory in labeled poly bag. Each sample was air-dried and sieved through a 2 mm screen. Samples were stored at room temperature for the determination of soil physical and chemical properties.
Particle size distribution of the soils was determined by hydrometer method (Day 1965). Maximum water holding capacity (MWHC) and bulk density of different soil layers
were measured using a stainless steel core of 100 cm3 vol- ume by weight method: the weight of soil in the core and its dry weight after oven-drying at 105oC were measured. In case of MWHC, the weight of soil in the core under satu- ration with water was measured before getting dry weight.
The pH was measured in soil-water suspension (1:2.5) using a corning glass electrode pH-meter. Organic carbon and total nitrogen were determined by wet-oxidation meth-
Table 2. Textural class of soils under investigation
Soil layer Location Sand Silt Clay Texture*
Surface soil (0∼15)
Planted forest land 60a (0.58) 17a (1.73) 23a (1.20) Sandy clay loam
Barren land 62a (1.15) 18a (1.55) 20b (0.67) Sandy clay loam
Cultivated land 63a (1.73) 20b (1.15) 17ab (0.88) Sandy loam Subsoil
(15∼30)
Planted forest land 51a (0.67) 20a (1.53) 29a (5.20) Sandy clay loam
Barren land 55b (1.00) 20a (1.00) 25b (4.62) Sandy clay loam
Cultivated land 58c (1.53) 21a (2.60) 21cb (3.46) Sandy loam
Each value is the mean of soil samples of three plots in each land use. Values in the parentheses are standard deviations of samples. Values with different lowercase (a∼c) letters are significantly different in the same soil layers at different land-use systems (p<0.05).
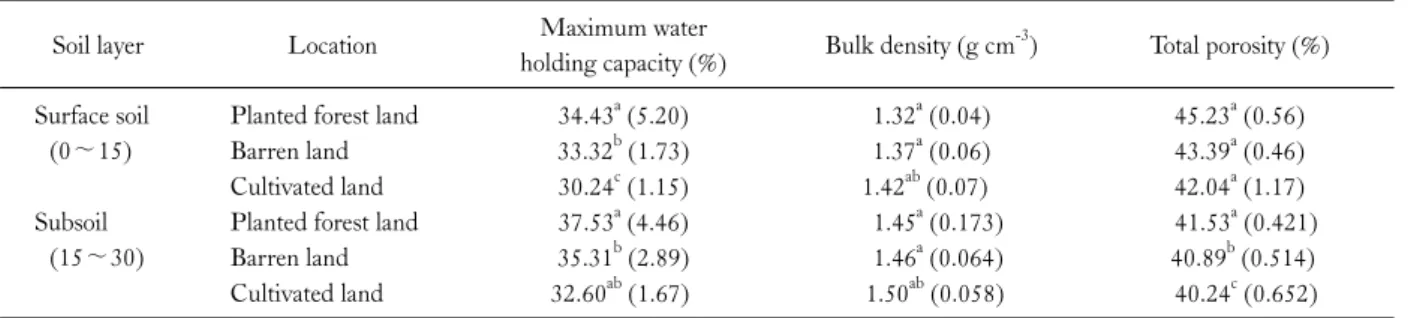
Table 3. Soil physical characteristics under different land use systems
Soil layer Location Maximum water
holding capacity (%) Bulk density (g cm-3) Total porosity (%) Surface soil
(0∼15)
Planted forest land 34.43a (5.20) 1.32a (0.04) 45.23a (0.56)
Barren land 33.32b (1.73) 1.37a (0.06) 43.39a (0.46)
Cultivated land 30.24c (1.15) 1.42ab (0.07) 42.04a (1.17)
Subsoil (15∼30)
Planted forest land 37.53a (4.46) 1.45a (0.173) 41.53a (0.421)
Barren land 35.31b (2.89) 1.46a (0.064) 40.89b (0.514)
Cultivated land 32.60ab (1.67) 1.50ab (0.058) 40.24c (0.652)
Each value is the mean of soil samples of three plots in each land use. Values in the parentheses are standard deviations of samples. Values with different lowercase (a∼c) letters are significantly different in the same soil layers at different land-use systems (p<0.05).
od of Walkley-Black (1934) and micro-Kjeldahl’s method (Jackson 1973) respectively. Available phosphorus was ex- tracted with Bray and Kurtz no.2 extractant and measured by SnCl2 reduced molybdophosphoric blue color method using spectrophotometer (Jackson 1973). Available cal- cium, magnesium and potassium were extracted with 1N NH4OAC and determined by an atomic absorption spectrophotometer. Significant differences in soil properties due to effects of planted forest land, barren land and culti- vated land uses was tested by paired t test using Minitab (1996). Total storage (Mg ha-1) of soil organic carbon (SOC) and total nitrogen (TN) at each soil depth was cal- culated according to Guo and Gifford (2002).
Results
Soil physical characteristics
Table 2 showed that sand was the dominant particle and showed no significant difference in the surface layers while in subsoil it differed significantly within the different land
use types. Cultivated land had significantly higher content of silt at the surface and subsoil than planted forest and bar- ren land. Clay contents in Planted forest were significantly higher than in fallow site at surface soils and than in fallow and cultivated sites at subsoil (Table 2).
Maximum water holding capacity (MWHC) of soils ranged from 30.24 to 34.43% and from 32.60 to 37.53% in the surface of cultivated and subsoils of planted forest sites respectively (Table 3). MWHC was found to increase with depth under the three different land uses. Planted forest land had higher values than barren land and cultivated land. MWHC varied significantly in surface soils among three land uses while significantly differed in subsoils be- tween planted forest land and barren land uses (Table 3).
The bulk density of soils varied from 1.32 g cm-3 to 1.42 g cm-3 and 1.45 g cm-3 to 1.50 g cm-3 and at the surface of planted forest sites and at subsoil in cultivated sites re- spectively (Table 3). Both surface soil and subsoil of culti- vated site had significantly higher bulk density than that of planted and fallow land sites. The bulk density of soils in all
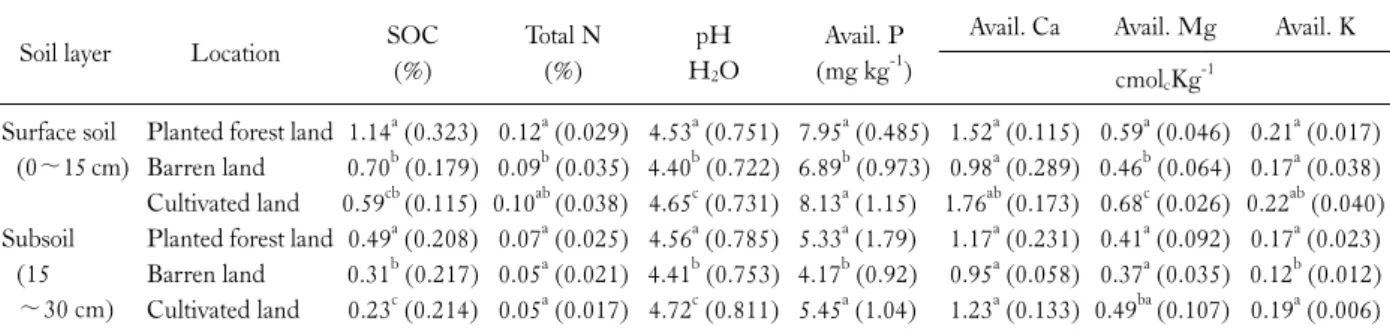
Table 4. Chemical properties of soils under different land use systems
Soil layer Location SOC
(%)
Total N (%)
pH H2O
Avail. P (mg kg-1)
Avail. Ca Avail. Mg Avail. K cmolcKg-1
Surface soil (0∼15 cm)
Planted forest land 1.14a (0.323) 0.12a (0.029) 4.53a (0.751) 7.95a (0.485) 1.52a (0.115) 0.59a (0.046) 0.21a (0.017) Barren land 0.70b (0.179) 0.09b (0.035) 4.40b (0.722) 6.89b (0.973) 0.98a (0.289) 0.46b (0.064) 0.17a (0.038) Cultivated land 0.59cb (0.115) 0.10ab (0.038) 4.65c (0.731) 8.13a (1.15) 1.76ab (0.173) 0.68c (0.026) 0.22ab (0.040) Subsoil
(15
∼30 cm)
Planted forest land 0.49a (0.208) 0.07a (0.025) 4.56a (0.785) 5.33a (1.79) 1.17a (0.231) 0.41a (0.092) 0.17a (0.023) Barren land 0.31b (0.217) 0.05a (0.021) 4.41b (0.753) 4.17b (0.92) 0.95a (0.058) 0.37a (0.035) 0.12b (0.012) Cultivated land 0.23c (0.214) 0.05a (0.017) 4.72c (0.811) 5.45a (1.04) 1.23a (0.133) 0.49ba (0.107) 0.19a (0.006) Each value is the mean of soil samples of three plots in each land use. Values in the parentheses are standard deviations of samples. Values with different lowercase (a∼c) letters are significantly different in the same soil layers at different land-use systems (p<0.05).
Fig. 3. Effect of different land-uses on total N storage at surface soil and subsoil.
Fig. 2. Effect of different land-uses on Soil OC storage at surface soil and subsoil.
profiles increased with depth (Table 3).
Soil porosity of all soil samples were found to be ranged from 42.04% to 45.23% in surface soils and 40.24% to 41.53% in subsoils of cultivated site and planted forest site respectively (Table 3). Unlike bulk density, porosity de- creases with depth of soil profiles. Soil porosity showed sig- nificant difference in surface soils at the three land uses.
Soil chemical characteristics
Table 4 showed planted forest land contained sig- nificantly higher amount of soil organic carbon (SOC) than the other sites in both surface and subsoils. SOC ranged from 0.59% to 1.14% at the surface soil and 0.23% to 0.49% at the subsoil of cultivated soil and planted forest soil respectively. At surface soil SOC varied non significantly between barren land and cultivated land. The SOC was
higher in the upper soil depths than in the lower depths in the land uses studied. Total nitrogen at both surface and subsoil in planted forest was found to be higher than in bar- ren and cultivated sites and differed significantly only from the barren sites in surface soil (Table 4).
SOC storage in planted forest differed significantly from the upper soils of barren land and cultivated land and from the lower soils of barren land at. The significant difference in total N storage was found only in planted forest and bar- ren land soils at subsoil. Total organic carbon and nitrogen storage were higher in topsoils across the three land uses than in lower soils (Fig. 2 and 3).
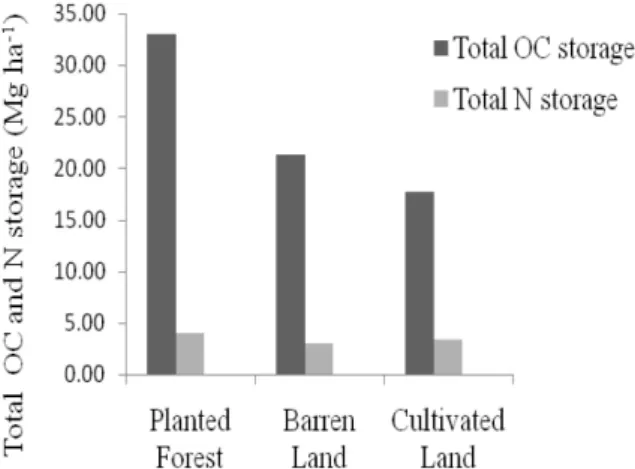
Fig. 4 showed total SOC (soil organic carbon) storage and total N storage in a total depth of 0∼30 cm. Total SOC (soil organic carbon) storage and total N storage at both layers in planted forest were observed higher in comparison
Fig. 4. Total soil organic carbon sand nitrogen storage at the total depth of 0
∼30 cm under different land-use types.
to other two land uses (Fig. 4).
The values of total SOC storage in the depth of 0∼30 cm decreased in the order: planted land > barren land >
cultivated land .While TN storage in 0∼30 cm depth fol- lowed the decreasing order: planted land > cultivated land
> barren land (Fig. 4). TOC storage in cultivated soils was lower compared to other land uses. Unlike total SOC stor- age, total N storage in cultivated soils was higher compared to barren soils although intensive crop cultivation and crop removal occurred in cultivated land.
The soils under study are acidic in reaction. The pH val- ues varied significantly from 4.40 to 4.65 of surface soil and 4.41 to 4.72 in subsoil at barren and cultivated lands re- spectively (Table 4). The pH values at both surface and subsoils of cultivated site were significantly higher as com- pared to that of other two land uses. Available phosphorus contents varied from 6.89 mg kg-1 to 8.13 mg kg-1 in sur- face soils and 4.17 mg kg-1 to 5.45 mg kg-1 in the subsoils of barren land and planted forest site respectively (Table 4).
Cultivated soil contained the highest amounts of avail- able P while, barren soils had the lowest contents in both surface and subsoils. Available P in barren site varied sig- nificantly from planted forest land and cultivated sites in two depths.
The dominant soluble cation was Ca and followed by Mg and K in land use types studied (Table 4).The concen- trations of available Ca, Mg and K were observed higher in both surface soils and subsoils of the cultivated site than in planted forest and barren sites. The soluble K contents were
slightly higher in both layers of cultivated land than in planted site. Available Ca contents differed significantly at the surface soils of barren land and cultivated sites while subsoils showed no significant difference among the three sites. On the other hand, available Mg at surface soils varied significantly among three sites and at subsoil differed sig- nificantly between planted and cultivated sites. Available K contents in barren land site were significantly lower as com- pared to cultivated site at both surface and subsoil and also to planted site at subsoil. Available Ca, Mg and K showed the decreasing trends with depths in all land use types.
Discussion
Soil physical characteristics
The present investigation showed that sand was the dominant soil particle in both depths. Brammer (1971) re- ported that sand is the dominant particle in brown hill soils because they developed from sandstone parent materials..
Lower contents of clay at both layers of barren land and cultivated land sites might be due to intensive loss of clay fraction from the upper layer through leaching, surface runoff and soil erosion during bare condition. Jaiyeoba (2003) reported that clay contents of deeper depths in- creased during cultivation might be due to either by clay translocation from the surface horizon or by removal of clay from the surface runoff. The clay and silt contents increased whereas the sand contents decreased with depths in all land use systems. This could be due to the smaller soil particle move more easily through soil. An increase in clay and de- crease in sand particle with depth in hill soil has been re- ported by several workers (Brammer 1971; Rahman 2005).
MWHC might be affected by clay, organic matter con- tents and soil depth among the land use systems. The in- creasing trend of soil moisture with depth under different land uses was possibly related to clay increment with depth.
Similar results were also reported by Gupta et al. (2010).
Higher bulk density at both depths in the cultivated land could be due to the coarser texture, low organic matter con- tent and tillage operation of the cultivated soils. Bulk den- sity might be related to the presence of organic matter and clay content (Evrendilek et al. 2004), soil aggregate stabil- ity and porosity (Yan et al. 2009). The bulk density of soils in all land uses increased with depth (Table 3) could be at-
tributed to the greater compaction in the lower depths of the soils under study with time. The results of this study are in consistent with the findings of other studies (Lee et al.
2009; Gupta et al. 2010).
The higher porosity at both surface and subsoils of plant- ed forest land could be explained by the presence of higher amount of organic matter and clay in planted forest soils.
Gupta et al. (2010) observed the same results and reported a positive correlation between porosity with organic carbon and clay content. For cultivated land, the lower porosity was mainly attributed to cultivation. Kizilkaya and Dengiz (2010) reported that long-term cultivation without appropriate soil management enhances rapid organic matter degradation and finally results in soil compaction and lower porosity.
Soil chemical characteristics
Planted forest types had significantly higher amounts of soil organic carbon (SOC) in both layers as compared to the other sites can be ascribed to addition of organic carbon from plant cover (Table 4). Lowest amount of organic mat- ter was observed in cultivated soils because tillage operation accelerates decomposition of organic matter. Similar ob- servation was reported previously by a number studies (Hajabbasi et al. 1997; Pulleman et al. 2005) that agricul- tural practices accelerated decomposition of soil organic matter and finally led to a net loss of soil organic matter from the cultivated soils. Kizilkaya and Dengiz (2010) re- ported that most of soil organic matter produced in the cul- tivated lands was removed with harvest while crop residues left over the soils and were placed under the soil with plough. Post and Mann (1990), and Lal et al. (1995) ob- served that agricultural management practices increased aeration and the loss of carbon to the atmosphere. The up- per soils had the higher SOC might be attributed to higher accumulation of organic matter on the topsoil.
Higher amount of total nitrogen at both surface and sub- soil in planted forest than in barren and cultivated sites might be attributed to the canopy cover that helped in nitro- gen accretion in the soil. The lowest content of total nitrogen was observed at barren soils because of few and scattered growth of vegetation (e.g. herbs, shrubs and grasses) that could enhance soil nutrient loss through surface erosion and leaching during rainy season. The bare condition also accel- erated the loss of nitrogen from barren soils through
volatilization.
In case of cultivated site, a considerable amount of nitro- gen is taken up by the crops from added fertilizer and very little is returned to soils. The losses of total nitrogen in cul- tivated soils might also be enhanced by leaching and volati- lization during wet condition and dry fallow period respec- tively. Moreover, very little organic residues left upon the soil after harvesting. Patrick and Smith (1975) reported that total tree harvesting caused the nutrient, including ni- trogen, to be removed up to three times compared to con- ventional logging.
Total SOC or TN storage in soils of different land uses could mainly be associated with quantity, quality of organic material, types of plant species, soil bulk density, human in- terference, management practices etc. in the sites. Dube et al. (2009) found that variation in SOC stock at different land-use types might be caused due to quantity and quality of plant material as well as soil bulk densities under differ- ent land-uses. Total organic carbon and nitrogen storage were higher in upper soils than in lower soils. Previous stud- ies reported that about 60% of SOC (Arevalo et al. 2009) and N (Chen and Lee 2003) are stored in topsoil layers.
The plant litter played the vital role in C and N storage in planted land. In case of cultivated land the management ac- tivities and nitrogen-fixing species (e.g. bean plants) are important in TN storage. Many studies have found that ni- trogen-fixing species can significantly increase soil N levels (Youngberg and Wollum 1976; Binkley 1992).
At the same time, cultivated soils contained the lowest TOC storage. The possible explanation is that burning, plowing and intense management activities, such as remov- ing plants on the forest floor; increased loss of soil C.
The results showed that all soils under study were acidic in nature. Acidic nature of hill soil was enhanced by in- tensive leaching of bases through the soils. CERDI (1983) also found that brown hill soil is strongly acidic in reaction throughout the entire profile. The higher pH in both layers of cultivated land might be associated with management practices (e.g. ash application during ploughing and plant- ing) that were adopted by the farmers.
The highest content of available phosphorus in culti- vated soils could be due to phosphate fertilizer application during cultivation. A number of studies reported that brown hill soils in Bangladesh are poor in available phos-
phorus (CERDI 1983; Chowdhury et al. 2007). The con- centrations of P in soils depend on a combination of factors including plant uptake, adsorption-desorption and dis- solution precipitation of inorganic P, the mineralization of organic P and microbial immobilization and fertilizer addi- tion (Perrott et al. 1990; Frossard et al. 2000).
The hill soils of Bangladesh are rich in sesquioxides (Brammer 1996) that promote higher fixation of phospho- rus under acid environment. The similar results have been reported by others (Ishizuka et al. 1998; Akbar et al. 2010).
Lower amounts of available P in the subsoils of the three land uses studied might be ascribed to the lower amount of organic matter and higher fixation of phosphorus in subsoils.
The cultivated soils had the higher contents of available Ca, Mg and K in both surface soils and subsoils than in soils of other two land uses. This might be explained as cul- tivated soils under study received more available Ca and Mg and K from applied ash (a part of management practi- ces) during cultivation. No substantial change in soluble K was observed in both layers of cultivated and planted sites.
Soto and Diazfierros (1993) reported that K released by de- composition of organic residues might have leached easily into the deep layer of soil. Higher contents of available Ca, Mg and K in the top soils were probably associated with bi- ological accumulation from plants (Soto and Diazfierros 1993; Akbar et al. 2010).
Planted forest land use has shown better physical and chemical properties compared to barren and cultivated land uses. The possible reasons are: continuous addition of litter in planted forest land plays an important role in improving soil aggregation, soil porosity, water holding capacity and concentrations of SOC and TN. On the other hand, bare ground or agricultural activity reduces soil porosity, water holding capacity. Removal of vegetation increases top soil erosion that results in a direct loss of soil organic matter. In addition, cultivation accelerates organic matter decom- position, nitrogen mineralization and their losses from soil media. Higher temperature under bare condition is also as- sociated with the depletion of organic matter and nitrogen through rapid decomposition.
Conclusion
The result showed that the soils under study are sand
textured with poor physical properties. Planted forest had higher nutrient content in most cases than barren and culti- vated land uses. Available phosphorus, calcium, magne- sium and potassium were slightly higher in cultivated site than that of other two land uses. Our study also shows that in soils of planted forest sites, higher content of OC and TN was stored compared to barren and cultivated land uses. Cultivation system and barren condition has sig- nificantly affected soil physical and chemical properties in these two land uses. Soil physical and chemical properties may be deteriorated if such condition continued further in barren land uses although soil properties (i.e. soil texture, OC, TN etc.) might also be affected in cultivated. Agro- forestry or plantation may be considered as the appropriate method to reduce soil degradation in barren land. On the other hand, cultivation is an important and traditional prac- tice of crop production in the region. For the continuation of cultivation, some measurements such as minimum till- age, use of crop residues and rotation techniques are ex- pected to increase soil organic matter by minimizing the loss of nutrients through soil erosion and leaching. Further research is to be needed to find out the ways to upgrade soil health and to increase or maintain soil carbon and other nu- trient storage.
References
Akbar MH, Ahmed OH, Jamaluddin AS Nik Ab, Majid NM, Abdul-Hamid H, Jusop S, Hassan A, Yusof KH, Arifin A.
2010. Differences in soil physical and chemical properties of re- habilitated and secondary forests. Am J Appl Sci 7: 1200-1209.
Angers DA. 1992. Changes in Soil aggregation and organic carbon under corn and alfalfa. Soil Sci Soc Am J 56: 1244-1249.
Arevalo CBM, Bhatti JS, Chang SX, Sidders D. 2009. Ecosystem carbon stocks and distribution under different land-uses in north central alberta, canada. For Ecol Manage 257: 1776-1785.
Binkley D. 1992. Mixtures of nitrogen-fixing and non-nitrogen fixing tree species. In: The Ecology of Mixed-Species Stands of Trees (Cannell MGR, Malcolm DC, Robertson PA, eds). The British Ecological Society, Oxford.
Bolin B, Sukumar R. 2000. Global perspective. In: Stabilization mechanisms of soil organic matter: Implications for C-satu- ration of soils (Watson RT, Noble IR, Bolin B, Ravindranath NH, Six J, Conant RT, Paul EA, Paustian K, eds). Plant Soil, pp 155-176.
Brammer H. 1971. Bangladesh Land Resources Technical Report-3. AGL: SF, Pak-6, FAO, Rome.
Brammer H. 1996. The geography of the soils of Bangladesh. The University Press Limited, Bangladesh.
CERDI (Central Extention Resoures Development Institute).
1983. Soils of Bangladesh. published by CERDI, Joydevpur, Dhaka.
Chen X, Li BL. 2003. Change in soil carbon and nutrient storage after human disturbance of a primary korean pine forest in northeast china. For Ecol Manage 186: 197-206.
Chowdhury MSH, Biswas S, Halim MA, Haque SMS, Muhammed N, Koike M. 2007. Comparative analysis of some selected macronutrients of soil in orange orchard and degraded forests in chittagong hill tracts, bangladesh. J For Res 18: 27-30.
Day PR. 1965. Particle fraction and particle size analysis. In:
Methods of soil analysis. Part, 1. American Society of Agronomy (Black CA, eds). Madison, Wisconsin, pp 45-56.
Dube F, Zagal E, Stolpe N, Espinosa M. 2009. The influence of land-use change on the organic carbon distribution and micro- bial respiration in a volcanic soil of the chilean patagonia. For Ecol Manage 257: 1695-1704.
Evrendilek F, Celik I, Kilic S. 2004. Changes in soil organic carbon and other physical soil properties along adjacent Mediterranean forest, grassland, and cropland ecosystems in Turkey. J Arid Environ 59: 743-752.
Frossard E, Conron LM, Oberson A, Sinaj S, Fardeau JC. 2000.
Processes governing phosphorus availability in temperate soils. J Environ Qual 29: 15-23.
Fu BJ, Chen LD, Ma KM, Zhou HF, Wang J. 2000. The relation- ships between land use and soil conditions in the hilly area of the loess plateau in northern Shaanxi, China. Catena 39: 69-78.
Fu BJ, Guo XD, Chen LD, Ma KM, Li JR. 2001. Soil nutrient changes due to land use changes in Northern China: a case study in Zunhua County, Hebei Province. Soil Use and Manage 17:
294-296.
Fu BJ, Ma KM, Zhou HF, Chen LD. 1999. The effect of land use structure on the distribution of soil nutrients in the hilly area of the loess plateau, china. Chin Sci Bul 44: 732-736.
Grant CA, Lafond GP. 1993. The effects of tillage systems and crop sequences on soil bulk density and penetration resistance on a clay soil in southern Saskatchewan. Can J Soil Sci 73: 223-232.
Guo LB, Gifford RM. 2002. Soil carbon stocks and land use change: a meta analysis. Glob Change Bio 8: 345-360.
Gupta RD, Arora S, Gupta GD, Sumberia NM. 2010. Soil phys- ical variability in relation to soil erodibility under different land uses in foothills of Siwaliks in N-W India. Trop Ecol 51:
183-197.
Haghdoost N, Akbarinia M, Hosseini SM. 2013. Land-use change and carbon stocks: A case study, Noor County, Iran. J For Res 24: 461-469.
Hajabbasi MA, Jalalian A, Karimzadeh HR. 1997. Deforestation effects on soil physical and chemical properties, lordegan, iran.
Plant and Soi 190: 301-308.
Ishizuka S, Tanaka S, Sakurai K, Hirai H, Hirotani H, Ogino K,
Lee HS, kendawang JJ. 1998. Characterization and distribution of soils at lambir hills national park in sarawak, malaysia, with special reference to soil hardness and soil texture. Tropics 8:
31-44.
Islam KR, Weil RR. 2000. Land use effects on soil quality in a tropical forest ecosystem of Bangladesh. Agric Ecosys Environ 79: 9-16.
Ismail I, Blevins RL, Frye WW. 1994. Long-term no-tillage effects on soil properties and continuous corn yields. Soil Sci Soc Am J 58: 193-198.
Jackson ML. 1973. Soil Chemical Analysis. Prentice-Hall Inc., Englewood Cliffs, N. Jersey, USA, pp 205-226.
Jaiyeoba IA. 2003. Changes in soil properties due to continuous cultivation in nigerian semiarid savannah. Soil Till Res 70:
91-98.
Kizilkaya R, Dengiz O. 2010. Variation of land uses and land cover effects on some physic-chemical characteristics and soil enzyme activities. Zemdirbyste-Agric 97: 15-24.
Lal R, Kimble J, Stewart B. 1995. World soils as a source or sink for radiatively active gas-es. In: Soil Management and Greenhouse Effect (Lal R, Kimble J, Levine E, et al, eds). Boca Raton Florida, Lewis Publishers, pp 1-8.
Lee YL, Osumanu HA, Nik Muhamad Ab M, Jalloh MB. 2009.
Organic Matter, Carbon and Humic Acids in Rehabilitated and Secondary Forest Soils. Am Appl Sci 6: 824-828.
Lugo AE. 1992. Comparison of tropical tree plantations with sec- ondary forests of similar age. Ecol Mon 62: 1-41.
Minitab Inc. 1996. Minitab user’s guide, release 11. Minitab, State College, PA.
Murty D, Kirschbaum MUF, McMurtrie RE, McGilvray H.
2002. Does conversion of forest to agricultural land change soil carbon and nitrogen? A review of the literature. Glob Change Bio 8: 105-123.
Patrick JH, Smith DW. 1975. Forest management and nutrient cy- cling in Eastern hardwoods. USDA For. Serv. Res. Pap. ME- 4.
Northeast For. Exp. Stat. Broomal, PA.
Perrott KW, Sarathchandra SU, Waller JE. 1990. Seasonal storage and release of phospho-rus and potassium by organic matter and the microbial biomass in a high-producing pas-toral soil. Aus J Soil Res 28: 593-608.
Post WM, Mann LK. 1990. Change in soil organic matter and ni- trogen as a result of culti-vation. In: Soil and the Greenhouse Effect (Bouman AF, eds). Chichester, John Wiley Publi-cation.
Pulleman MM, Six J, van Breemen N, Jongmans AG. 2005. Soil organic matter distribution and microaggregate characteristics as affected by agricultural management and earthworm activity.
Eur J Soil Sci 56: 453-467.
Rahman MR. 2005. Soil of Bangladesh. Dorpon Publications, BanglaBazar, Dhaka.
Six J, Connant RT, Paul EA, Paustian K. 2002. Stabilization mech- anisms of soil organic matter: implications for C-saturation of soils. Plant and Soil 241: 155-176.
Soto B, Diazfierros F. 1993. Interactions between plant ash leach- ates and soil. Inter J Wild Fir 3: 207-216.
Walkley A, Black IA. 1934. An examination of the degtjareff meth- od for determining soil organic matter, and a proposed mod- ification of the chromic acid titration method. Soil Sci 37: 29-38.
Yan J, Zhu X, Zhao JH. 2009. Effects of grassland conversion to cropland and forest on soil organic carbon and dissolved organic carbon in the farming-pastoral ecotone of inner mongolia. Acta Ecol Sin 29: 150-154.
Yan Y, Tian J, Fan MS, Zhang FS, Li XL, Christie P, Chen HQ, Lee J, Kuzyakov Y, Six J. 2012. Soil organic carbon and total ni-
trogen in intensively managed arable soils. Agric Ecosys Environ 150: 102-110.
Youngberg CT, Wollum AG. 1976. Nitrogen accretion in develop- ing Ceanothus velutinus stands. Soil Sci. Soc. Am. J.40, 109-112.
Zech W, Drechsel P. 1998. Nutrient disorders and nutrient man- agement in fast growing plantations. In: Soils of Tropical Forest Ecosystems: Characteristics, Ecology and Management (Schulte A, Ruhiyat D, eds). Berlin, Heidelberg, Springer Berlin Heidelberg, pp 90-106.