J F E S
Journal of Forest and Environmental Science
Journal of Forest and Environmental Science Vol. 33, No. 4, pp. 295-304, November, 2017 https://doi.org/10.7747/JFES.2017.33.4.295
Evaluation of a Land Use Change Matrix in the IPCC’s Land Use, Land Use Change, and Forestry Area Sector Using National Spatial Information
Jeongmook Park1, Jongsu Yim2 and Jungsoo Lee1,*
1Department of Forest Management, College of Forest and Environmental Sciences, Kangwon National University, Chuncheon 24341, Republic of Korea
2Forest Geographic Information System Remote Sensing, Korea Forest Research Institute, Seoul 02455, Republic of Korea
Abstract
This study compared and analyzed the construction of a land use change matrix for the Intergovernmental Panel on Climate Change’s (IPCC) land use, land use change, and forestry area (LULUCF). We used National Forest Inventory (NFI) permanent sample plots (with a sample intensity of 4 km) and permanent sample plots with 500 m sampling intensity. The land use change matrix was formed using the point sampling method, Level-2 Land Cover Maps, and forest aerial photographs (3rd and 4th series). The land use change matrix using the land cover map indicated that the annual change in area was the highest for forests and cropland; the cropland area decreased over time. We evaluated the uncertainty of the land use change matrix. Our results indicated that the forest land use, which had the most sampling, had the lowest uncertainty, while the grassland and wetlands had the highest uncertainty and the least sampling.
The uncertainty was higher for the 4 km sampling intensity than for the 500 m sampling intensity, which indicates the importance of selecting the appropriate sample size when constructing a national land use change matrix.
Key Words: IPCC, LULUCF, NFI, land use change matrix, point sampling
Received: October 30, 2017. Revised: November 10, 2017. Accepted: November 14, 2017.
Corresponding author: Jungsoo Lee
Department of Forest Management, College of Forest and Environmental Sciences, Kangwon National University, Chuncheon 24341, Republic of Korea Tel: 82-33-250-8334, Fax: 82-33-259-5617, E-mail: [email protected]
Introduction
According to the 5th Intergovernmental Panel on Climate Change (IPCC) Assessment Report ratified in 2014, “human influence on the climate system is clear... with the impact in- tensifying, and observed across all continents and seas of the Earth” (KIEP 2015). The total greenhouse gas emis- sions from Korea was 699 million tons of CO2Eq (carbon dioxide equivalents) in 2010, ranking it 6th in the world;
among the Organization for Economic Cooperation and Development (OECD) nations, Korea ranks fourth follow- ing the United States, Japan, and Germany and seventh in per capita emissions. In 2011, Korea set its highest reduc-
tion target based on the recommendations for developing countries (15-30% range over the “business-as-usual” [BAU]
baseline levels), and it opted to lower emissions to 30% be- low BAU in 2020. It is important to create a comprehensive reduction strategy to meet this target (Yu et al. 2015).
To meet the national greenhouse gas reduction targets, it is important to accurately identify national emission volumes.
Currently, the Korean national greenhouse gas inventory is calculated and reported under the energy; industrial proc- esses and product use; agriculture; land use, land use change, and forestry (LULUCF); and waste sectors. LULUCF is a sink, resulting in net removal of CO2Eq emissions. It is an important area of research as greenhouse gas absorption
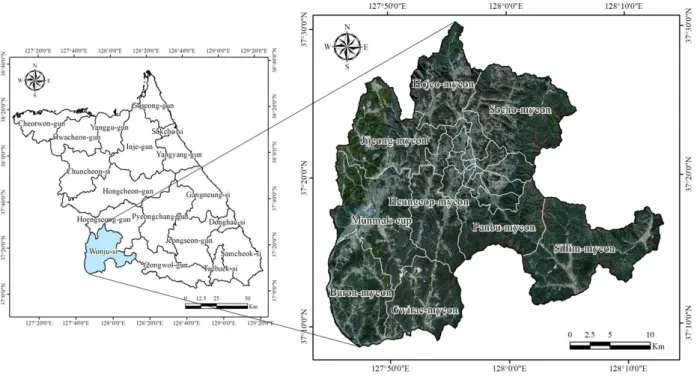
Fig. 1. Location of study area.
sector (GIR 2016), and it uses the IPCC guidelines to cal- culate greenhouse gas emissions. The 1996 IPCC Guidelines and the 2003 Good Practice Guidance for the LULUCF sector (IPCC 2003) provide recommendations for calculat- ing greenhouse gas statistics for each country.
The IPCC (2006) presents three methods for construct- ing a land use change matrix: using administrative data, point sampling-based sample data, and spatial information analysis using long-range exploration and GIS information.
Japan uses administrative data for their national greenhouse gas inventory report, and it uses samples to evaluate and monitor forest management activities at sample plots based on aerial photographs (under the forest management man-
each institution focuses their research on emission factors, and research on the construction of land use change ma- trixes, as a part of data collection (e.g., land area), is limited (Yim et al. 2015; Park et al. 2016). This study addresses this gap; we used the National Forest Inventory (NFI) per- manent sample plots to estimate six types of land use, and we constructed a land use change matrix for Wonju City.
Materials and Methods
Study Area
The study area was Wonju City, Gangwon-do Province, Republic of Korea. Since 2006 it has experienced increasing
Fig. 2. Method of Study.
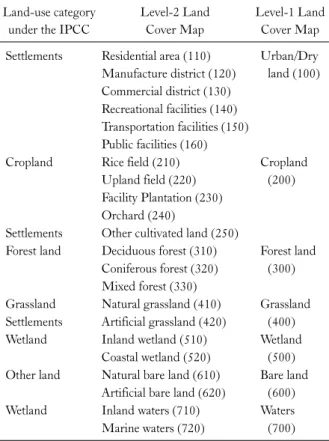
Table 1. Reclassificarion Standard of Level-2 Land Cover Map under the IPCC
Land-use category under the IPCC
Level-2 Land Cover Map
Level-1 Land Cover Map Settlements Residential area (110) Urban/Dry land (100) Manufacture district (120)
Commercial district (130) Recreational facilities (140) Transportation facilities (150) Public facilities (160)
Cropland Rice field (210) Cropland
(200) Upland field (220)
Facility Plantation (230) Orchard (240)
Settlements Other cultivated land (250)
Forest land Deciduous forest (310) Forest land (300) Coniferous forest (320)
Mixed forest (330)
Grassland Natural grassland (410) Grassland (400) Settlements Artificial grassland (420)
Wetland Inland wetland (510) Wetland (500) Coastal wetland (520)
Other land Natural bare land (610) Bare land (600) Artificial bare land (620)
Wetland Inland waters (710) Waters (700) Marine waters (720)
land use change and increasing population; it is designated as an Innovation City and a Corporate City (Lee and Lee 2012). Wonju City is located at latitude 37°17′-37°24′N and longitude 127°54′-128°03′E, with a total area of 86 707 ha. It is divided into 16 administrative neighborhoods, eight myeons (townships), and one eup (town) (Fig. 1).
Method
For the land use change matrix, land cover maps and the forest aerial photographs (3rd and 4th series) were com- pared with NFI permanent sample plots, reclassified under the IPCC standards for the LULUCF sector. The land cover maps were reclassified while the forest aerial photo- graphs were analyzed under a series of guidelines. The land use change matrixes constructed in this study were com- pared for uncertainty and compatibility (Fig. 2).
National Forest Inventory (NFI)
The National Forest Inventory (NFI) is a method of an- alyzing national forests; it uses a scientific method to re- search, evaluate, and gather basic statistics on forests. NFI began in 1972, and from the fifth edition of NFI (2006–
2010), the methodology changed to systematic cluster sam- pling supplemented by field studies (KFRI 2011; Yoo et al.
2011).
Based on the NFI permanent sample plots with a sample intensity of 4 km (NFI_4 km), we created sample plots with a 500 m sample intensity (NFI_500 m). There are 6264 NFI_4 km plots in Korea; in our the study area of Wonju City, there were 55 NFI_4 km plots and 3463 NFI_500 m plots.
Construction of the land use change matrix
Construction of the land use change matrix using land cover maps: The land cover map is a database of spatial information that classifies the land cover and lays it out in a map (ME 2013). This study used a Level-2 Land
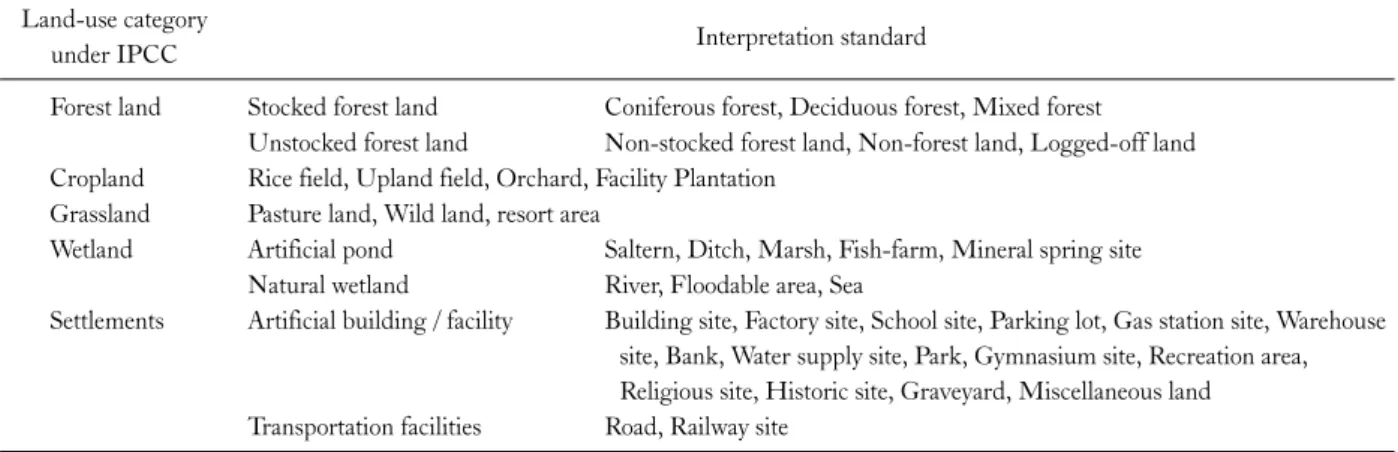
Table 2. Interpretation Standard of forest aerial photograph under the IPCC Land-use category
under IPCC Interpretation standard
Forest land Stocked forest land Coniferous forest, Deciduous forest, Mixed forest Unstocked forest land Non-stocked forest land, Non-forest land, Logged-off land Cropland Rice field, Upland field, Orchard, Facility Plantation
Grassland Pasture land, Wild land, resort area
Wetland Artificial pond Saltern, Ditch, Marsh, Fish-farm, Mineral spring site Natural wetland River, Floodable area, Sea
Settlements Artificial building / facility Building site, Factory site, School site, Parking lot, Gas station site, Warehouse site, Bank, Water supply site, Park, Gymnasium site, Recreation area, Religious site, Historic site, Graveyard, Miscellaneous land
Transportation facilities Road, Railway site Enforce ment decree of the act on the establishment, management, etc. of spatial data.
the basic elements of tone, pattern, texture, size, shape, and shadow and in accordance with the basic characteristics of each land use type (KRIHS 2002). The evaluation criteria of the six land use types in the forest aerial photographs were in accordance with the LULUCF land use types from IPCC based on land cover and land use (Table 2).
Uncertainty Assessment for Land-use Change: The area of each land use type based on the NFI permanent sample plot sampling method was calculated using Equation (1), which used the permanent sample plot ratio;
the uncertainty of the estimated area for each land use type was evaluated using Equations (2) and (3). Uncertainty is defined as the level of uncertainty on the accuracy of the measured value; lower uncertainty leads to a higher cer- tainty of having an accurately measured value (Ogle et al.
2003).
×
eq. 1
=Standard error of an area estimate for land-use category
Cadastral statistics from the Ministry of Land, Infra- structure and Transport were used to verify the compati- bility of the area data calculated using the land cover maps and forest aerial photographs, depending on sample in- tensity (MOLIT 2000; MOLIT 2007; MOLIT 2010).
Results and Discussion
Land use change matrix using land cover maps Using Level-2 Land Cover Maps we constructed a land use change matrix from 2000 to 2007 (Fig. 3). Results from the point sampling method with NFI_4 km indicated that the area maintained as forest was approximately 61,569 ha, while the conversion to other land uses was approximately 5%. There was no changes to other land use types, such as cropland, grassland, wetlands, settlements, and “other lands.”
Fig. 3. Land-use map using NFI and Level-2 Land Cover Map.
Table 3. Land-use change matrix using NFI_4 km and level-2 land cover map (Area, ha)
Land-use category Level-2 land cover map (‘00)
Forest land Cropland Grassland Wetland Settlements Other land Total Level-2 land
cover map (‘07)
Forest land 61,569 - - - - - 61,569
Cropland 3,157 14,208 - - - - 17,366
Grassland - - 3,157 - - - 3,157
Wetland - - - 3,157 - - 3,157
Settlements - - - - 1,579 - 1,579
Other land - - - - - - -
Total 64,727 14,208 3,157 3,157 1,579 - 86,828
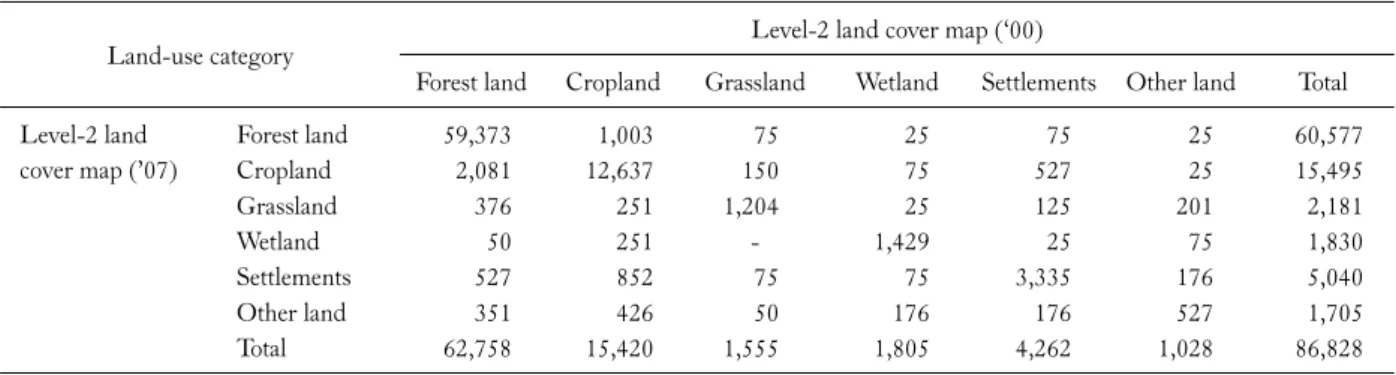
Table 4. Land-use change matrix using NFI_500 m and level-2 land cover map (Area, ha)
Land-use category Level-2 land cover map (‘00)
Forest land Cropland Grassland Wetland Settlements Other land Total Level-2 land
cover map (’07)
Forest land 59,373 1,003 75 25 75 25 60,577
Cropland 2,081 12,637 150 75 527 25 15,495
Grassland 376 251 1,204 25 125 201 2,181
Wetland 50 251 - 1,429 25 75 1,830
Settlements 527 852 75 75 3,335 176 5,040
Other land 351 426 50 176 176 527 1,705
Total 62,758 15,420 1,555 1,805 4,262 1,028 86,828
Fig. 4. Land-use map using NFI and Forest Aerial Photograph.
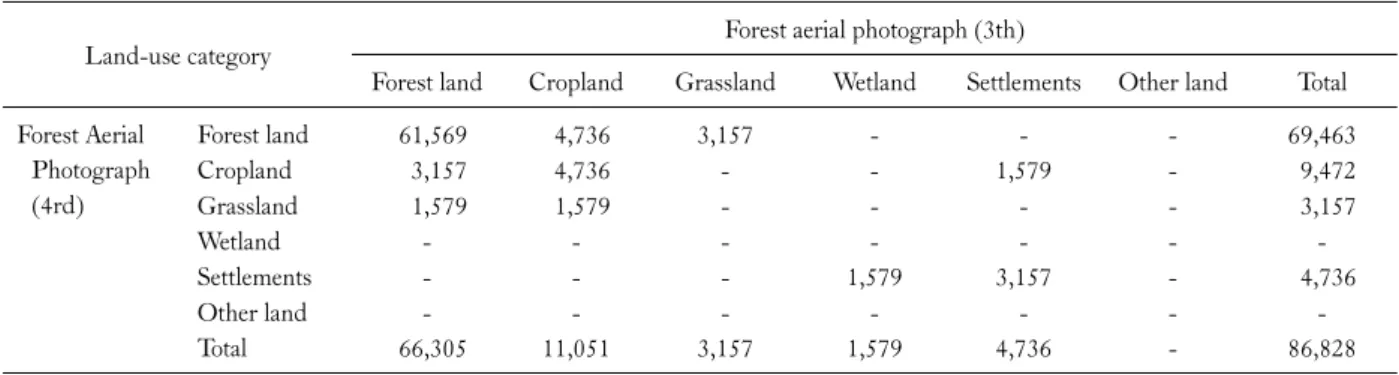
Table 5. Land-use change matrix using NFI_4 km and forest aerial photograph (Area, ha)
Land-use category Forest aerial photograph (3th)
Forest land Cropland Grassland Wetland Settlements Other land Total Forest Aerial
Photograph (4rd)
Forest land 61,569 4,736 3,157 - - - 69,463
Cropland 3,157 4,736 - - 1,579 - 9,472
Grassland 1,579 1,579 - - - - 3,157
Wetland - - - - - - -
Settlements - - - 1,579 3,157 - 4,736
Other land - - - - - - -
Total 66,305 11,051 3,157 1,579 4,736 - 86,828
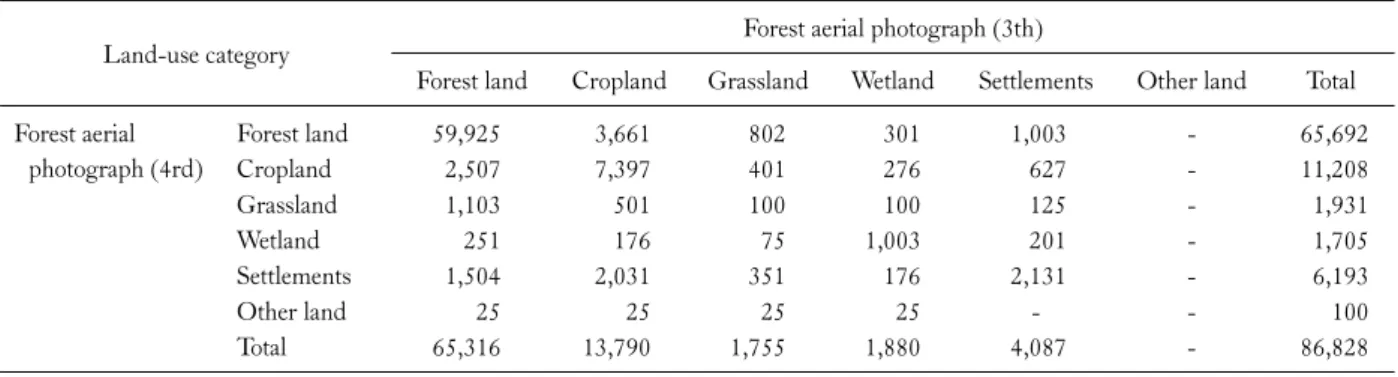
Table 6. Land-use change matrix using NFI_500 m and forest aerial photograph (Area, ha)
Land-use category Forest aerial photograph (3th)
Forest land Cropland Grassland Wetland Settlements Other land Total Forest aerial
photograph (4rd)
Forest land 59,925 3,661 802 301 1,003 - 65,692
Cropland 2,507 7,397 401 276 627 - 11,208
Grassland 1,103 501 100 100 125 - 1,931
Wetland 251 176 75 1,003 201 - 1,705
Settlements 1,504 2,031 351 176 2,131 - 6,193
Other land 25 25 25 25 - - 100
Total 65,316 13,790 1,755 1,880 4,087 - 86,828
Table 7. Comparative analysis of land-use estimated area and cadastral statistical area
Classification Year Sampling intensity Forest land Cropland Grassland Wetland Settlements Other land Total Level-2 land
cover map
2007 NFI_4 km 71% 20% 4% 4% 2% - 100%
NFI_500 m 70% 18% 3% 2% 6% 2% 100%
Cadastral Statistics 73% 16% 0% 4% 5% 1% 100%
2010 NFI_4 km 75% 16% 4% 4% 2% - 100%
NFI_500 m 72% 18% 2% 2% 5% 1% 100%
Cadastral Statistics 73% 15% 0% 4% 6% 1% 100%
Forest aerial photograph
4th (1996-2005) NFI_4 km 80% 11% 4% - 5% - 100%
NFI_500 m 76% 13% 2% 2% 7% - 100%
Cadastral Statistics 74% 16% 0% 4% 5% 1% 100%
verted to other land use types, representing the smallest change in land use (Fig. 4). Using the NFI_500 m point sampling method, the area maintained as forest was the highest; the area maintained as grassland was the lowest, and this was similar to the results from the NFI_4 km point sampling methodology. In contrast, the area maintained as wetlands increased by 53% using the NFI_500 m point sampling method. This result was different from the area of wetlands from the NFI_4 km point sampling method. This difference may be because the area occupied by streams is low since the study area is inland; however, the increase in the number of point samples in the NFI_500 m method would have led to an increase in the proportion of area maintained as wetland (Table 5, Table 6).
Evaluation of uncertainty in land use change The NFI_4 km and NFI_500 m type-specific area pro- portions from the 2007 Level 2 Land Cover Map were ap- proximately 2-3% lower for the forests and settlements compared to the cadastral statistics (Table 7); they were ap-
proximately 1-2% higher for cropland and grassland.
However, the NFI_4 km type-specific area proportions from the 2010 Level 2 Land Cover Map showed approx- imately 1-4% higher areas for forests, cropland, and gra- ssland. The type-specific area proportion for NFI_500 m was lower for forests, wetlands, and settlements when com- pared to the cadastral characteristics; for cropland and grassland, they were higher. The type-specific area pro- portions for NFI_4 km and NFI_500 m obtained from the 4th series forest aerial photographs were approximately 2-4% higher than the cadastral statistics for forests and grasslands, but approximately 3-5% lower for croplands.
We calculated the standard error (SE) and relative standard error (RSE) of the estimated area of land use change by land use type (Table 8). By area, forests and croplands had a range of approximately 0.9-4.4% for NFI_500 m and approximately 6.0-43.0% for NFI_4 km, regardless of the spatial data. These land use types were al- most two times as accurate as the other land use types. By sample intensity, NFI_500 m represented an almost a five-
500 m 1.1 3.7 12.6 11.7 7.5 15.5 Forest Aerial
Photograph
3rd SE (ha) 4 km 5,020 3,938 2,212 1,579 2,683 -
500 m 637 539 208 215 313 -
RSE (%) 4 km 7.6 35.6 70.1 100.0 56.7 -
500 m 1.0 3.9 11.8 11.4 7.6 -
4th SE (ha) 4 km 4,371 3,397 2,212 - 2,212 -
500 m 633 495 218 205 380 50
RSE (%) 4 km 6.0 43.0% 70.1 - 70.1 -
500 m 1.0 4.4% 11.3 12.0 6.1 50.0
fold increase in accuracy when compared to NFI_4 km for both the Level 2 Land Cover Map and the forest aerial photographs. While individual years were different for the spatial data, the estimation of area using reclassified land cover maps was more accurate than estimations using forest aerial photographs.
Conclusion
This study divided NFI permanent sample plots into sample intensities of 4 km and 500 m, and we examined a land use change matrix in accordance with IPCC’s LULUCF sector standards. According to the IPCC guidelines, land use changes should be measured by classifying the land use maintained and land use converted to other uses; however, Korea’s national statistics only pertain to national land use areas, presenting limitations for calculating these con- versions. To overcome this limitation, this study used land cover maps and forest aerial photographs to construct a land use change matrix for the six land use types in the LULUCF sector.
The land use change matrix indicated that forests had the most samples for all matrixes, followed by cropland. With the passage of time, the number of samples of cropland tended to decrease, while the number of samples for settle-
ments increased. This appears to be due to the progression of the Korean economy into secondary and tertiary in- dustries from an economy dominated by the primary sector.
The land use change matrix using the Level 2 Land Cover Map showed that the area maintained as forest using the point sampling method for NFI_4 km was the smallest change in land use with approximately 95% of its area maintained, but the NFI_500 m method showed the high- est area at 95%. This difference in results was likely due to the differences in the number of sampling points; the area maintained as forest was the highest because the forest area was greatest at the start of the study period. The land use change matrix from the aerial maps showed that the area maintained as forests was the highest for the point sampling method NFI_4 km and NFI_500 m (with 93% and 92%, respectively). The difference between the Level 2 Land Cover Map and the land use matrix from the aerial photos likely stemmed from differences in scale; the Level 2 Land Cover Map was 1:25,000 scale, while the aerial photos had a 1:5,000 scale. This resulted in more accurate land use classifications and consequent changes in matrix results.
The uncertainty analysis of the land use change matrix showed that uncertainty of the forest area, with many sam- ples, was lowest; the uncertainty for grassland and wetlands, with a lower number of samples, was higher. As the 500 m
sampling intensity had greater accuracy than the 4 km sam- pling intensity, this study confirmed that lower uncertainty is associated with a higher number of samples.
The land area for forests and cropland from the land use change matrix were most similar to the national statistics that apply the LULUCF sector; these land use types had large areas and a large sample size. Grassland and wetlands were over- or under-represented and had smaller areas and smaller sample sizes. The area by land use type in the land use change matrix constructed from aerial photographs tended to be similar to the areas in the matrix constructed from land cover maps (although the “other lands” was an exception).
For future research, using more detailed national-level statistics, spatial multimedia information, and NFI perma- nent sample plots would lead to a more accurate and com- prehensive land use change matrix in line with IPCC’s LULUCF sector guidelines. This would lead to more ac- curate calculations of greenhouse gases emissions and absorption.
Acknowledgements
This study was carried out with the support of ‘R&D Program for Forest Science Technology (Project No.
2017045A00-1720-BB01)’ provided by Korea Forest Service (Korea Forestry Promotion Institute).
References
Bae YJ, Bae SJ, Seo IH, Seo K, Lee JJ, Kim GY. 2013. Estimation of uncertainty on greenhouse gas emission in the agriculture sector. J Korean Soc Rural Plan 19: 125-135. (in Korean with English abstract)
Federal Environment Agency (FEA). 2017. Submission under the United Nations Framework Convention on Climate Change and the Kyoto Protocol 2017. pp. 540-648.
Greenhouse Gas Inventory & Research Center (GIR). 2016.
National Greenhouse Gas Inventory Report of Korea. pp.
255-300. (in Korean)
Intergovernmental Panel on Climate Change (IPCC). 2003. Good practice guidance for land Use, land-use change and forestry.
Institute for Global Environmental Strategies, Hayama, Kanagawa, pp 2.7-2.17.
Intergovernmental Panel on Climate Change (IPCC). 2006. 2006 IPCC Guidelines for National Greenhouse Gas Inventories.
Institute for Global Environmental Strategies, Hayama, Kana- gawa, pp 1.1-1.21.
Korea Forest Research Institute (KFRI). 2011. The 6th National Forest Inventory and Forest Health Monitoring-Field Manual-.
Korea Forest Service, Seoul, pp 59. (in Korean)
Korea Institute for International Economic Policy (KIEP). 2015.
Comparative analysis on climate support: key findings and implications. Korea Institute for International Economic Policy, Sejong, pp 23-29. (in Korean with English abstract)
Korea Research Institute for Human Settlements (KRIHS). 2002.
Land use/cover classification method for individual land parcel in high spatial resolution remotely sensed imagery. Korea Research Institute for Human Settlements, Sejong, pp 57-66.
(in Korean with English abstract)
Lee GH, Lee JS. 2012. Extraction and accuracy assessment of de- forestation area using GIS and remotely sensed data. J Korean For Soc 101: 365-373. (in Korean with English abstract) Ministry of Environment (ME). 2013. Guidelines for Land Cover
Mapping. (in Korean)
Ministry of Land, Infrastructure and Transport (MOLIT). 2000.
Statistical Year Book of MOLIT 2000. (in Korean with English abstract)
Ministry of Land, Infrastructure and Transport (MOLIT). 2007.
Statistical year book of MOLIT 2007. Ministry of Land, Infrastructure and Transport, Sejong. (in Korean with English abstract)
Ministry of Land, Infrastructure and Transport (MOLIT). 2010.
Statistical year book of MOLIT 2010. Ministry of Land, Infrastructure and Transport, Sejong. (in Korean with English abstract)
Ministry of the Environment, Japan (MEJ). 2017. National greenhouse gas inventory report of Japan. Center for Global Environmental Research, Onogawa, Tsukuba, Ibarak.
Ogle SM, Breidt FJ, Eve MD, Paustian K. 2003. Uncertainty in estimating land use and management impacts on soil organic carbon storage for US agricultural lands between 1982 and 1997. Global Change Biol 9: 1521-1542.
Park SJ, Lee CH, Kim MS, Yun SG, Kim YH, Ko BG. 2016.
Calculation of GHGs emission from LULUCF-cropland sec- tor in South Korea. Korean J Soil Sci Fert 49: 826-831. (in Korean with English abstract)
Statistics Finland (SF). 2017. Greenhouse gas emissions in Finland 1990 to 2015. National Inventory report under the UNFCCC and the Kyoto Protocol, Helsinki, pp 264-361.
Swedish Environmental Protection Agency (SEPA). 2017. National Inventory report Sweden 2017. Naturvårdsverket, Stockholm, pp 338-375.
Yim JS, Kim RH, Lee SJ, Son YM. 2015. Land-use change as- sessment by permanent sample plots in national forest inventory.
J Clim Change Res 6: 33-40. (in Korean with English abstract) Yoo SH, Heo J, Jung JH, Han SH, Kim KM. 2011. Estimation of
aboveground biomass carbon stock using landsat TM and ratio