Chemotherapy
Infect Chemother 2016;48(2):108-117
ISSN 2093-2340 (Print) · ISSN 2092-6448 (Online)
Received: April 23, 2016 Revised: June 4, 2016 Accepted: June 7, 2016 Corresponding Author : Sun Hee Park, MD, PhD, MPH
Division of Infectious Diseases, Department of Internal Medicine, Daejeon St Mary’s Hospital, College of Medicine, The Catholic University of Korea, 64, Daeheung-ro, Jung- gu, Daejeon 34943, Korea
Tel: +82-42-220-9296, Fax: +82-42-220-7925 E-mail: [email protected]
This is an Open Access article distributed under the terms of the Creative Commons Attribution Non-Commercial License (http://creativecommons.org/licenses/by-nc/3.0) which permits unrestricted non-commercial use, distribution, and repro- duction in any medium, provided the original work is properly cited.
Copyrights © 2016 by The Korean Society of Infectious Diseases | Korean Society for Chemotherapy
www.icjournal.org
Epidemiologic Parameters of the Middle East Respiratory Syndrome Outbreak in Korea, 2015
Sun Hee Park
1, Woo Joo Kim
2, Jin-Hong Yoo
1, and Jung-Hyun Choi
11Division of Infectious Diseases, Department of Internal Medicine, College of Medicine, The Catholic University of Korea; 2Division of In- fectious Diseases, Department of Internal Medicine, Guro Hospital, Korea University College of Medicine, Seoul, Korea
Background: Epidemiologic parameters are important in planning infection control policies during the outbreak of emerging infections. Korea experienced an outbreak of Middle East Respiratory Syndrome coronavirus (MERS-CoV) infection in 2015, which was characterized by superspreading events in healthcare settings. We aimed to estimate the epidemiologic parameters over time during the outbreak to assess the effectiveness of countermeasures.
Materials and Methods: Publicly available data pertaining to the MERS outbreak in Korea were collected. We estimated the incubation periods of 162 cases whose sources of exposure were identified and the temporal trend was evaluated. Factors influ- encing incubation duration were analyzed. The generational reproduction number (Rg) and case reproduction number (Rc) were estimated over time.
Results: The estimated median incubation period was 7.4 days (95% CI, 6.9-8.0). Median incubation periods tended to be lon- ger over time as the disease generation progressed: 6.16 days (95% CI, 5.38-6.97), 7.68 days (95% CI, 7.04-8.44), and 7.95 days (95% CI, 6.25-9.88) in the first, second, and third generations, respectively. The number of days of illness in the source cases at the time of exposure inversely correlated with the incubation periods in the receiving cases (HR 0.91 [95% CI, 0.84- 0.99] per one illness day increase; P=0.026). This relationship was consistent (HR 0.83 [95% CI, 0.74-0.93] per one illness day increase) in the multivariable analysis incorporating clinical characteristics, the order of generation, and a link to superspread- ers. Because the third generation cases were exposed to their source cases in the early stage (median one day) compared to the second generation cases (median 6 days), the temporal trend of incubation periods appears to be influenced by early isolation of symptomatic cases and reduction of potential exposure to source cases in the later stage. Rg declined rapidly from 28 to 0.23 in two generations. Rc dropped below the epidemic threshold at one on May 31, 2015, which approximately coincided with the initiation of the stringent countermeasures.
Conclusions: Despite the initial delay, the stringent countermeasures targeted towards second generation cases appeared to effec- tively contain the MERS outbreak in Korea as suggested by the decline of Rc shortly after implementation. Except for superspread- ing events, the transmission potential for MERS-CoV seems to be low. Further research should be focused on characterizing super- spreaders in comparison to non-transmitting cases with regard to environmental, behavioral, and virologic and host genetic factors in order to better prepare for future outbreaks of MERS-CoV.
Key Words: Reproduction number; Incubation period; Middle East Respiratory Syndrome; Korea; Countermeasures
Introduction
In 2015, there was a nationwide outbreak of Middle East Re- spiratory Syndrome coronavirus (MERS-CoV) infection in Ko- rea, initiated by a single case returning from the Middle East and eventually, resulting in 186 laboratory-confirmed cases and 38 deaths [1]. This outbreak was sparked by delayed rec- ognition of the primary case, ineffective contact tracing and suboptimal control measures, and delayed disclosure of af- fected healthcare facilities by the Korean Government during the early stage of the epidemic [2, 3]. Additionally, the poten- tial for superspreading events of MERS-CoV infection in healthcare facilities was underestimated [4]. Despite the inad- equate initial response, stringent countermeasures were im- plemented and laboratory testing increased beginning in early June of 2015 [5, 6], leading to a sharp decline in the number of new cases of MERS-CoV infection and eventual containment of this outbreak within two months.
When deciding on infection control policies, epidemiologic parameters play an important role. The incubation period, de- fined as the time from infection to the onset of symptoms, is used to determine the duration of quarantine or monitoring of exposed individuals and to identify the potential sources of infection [7]. Defined as the average number of secondary cases caused by a primary case, the reproduction number quantifies transmission potential of a disease within a popula- tion to help determine the effort needed in order to contain the epidemic and to monitor the effectiveness of countermea- sures [8].
However, these parameters are not constant, and are influ- enced by multiple factors. Incubation periods have inter-indi- vidual variations, which are largely attributable to the initial infective dose and inoculation route of the pathogen, the rep- lication rate within the host, and host susceptibility [7]. The reproduction number also changes over time and depends on environmental and cultural factors, crowding, and health sta- tus of the population [9]. Moreover, the value of the reproduc- tion number reflects the effectiveness of countermeasures during the epidemic [10].
The MERS outbreak in Korea was characterized by super- spreading events in the healthcare setting [4], which were like- ly the results of different combinations of individual variations (e.g. high viral shedding and behaviors), pathogens and envi- ronmental factors (e.g. crowded conditions, contamination by fomites or close contact in healthcare settings) [11]. Such het- erogeneity in transmission might mistakenly lead to overesti- matinge the transmissibility of MERS-CoV in the community
or other settings. A wide range of variability in incubation pe- riods raised a controversy regarding the effectiveness of the countermeasures including a 14-day quarantine for exposed individuals. Therefore, a detailed understanding of key epide- miologic parameters is essential to prepare for any MERS-CoV epidemics that may occur in the future.
This study aimed to explore change in the incubation period and reproduction number over time and to identify the factors influencing the length of incubation periods during the epi- demic of MERS-CoV infection epidemic in Korea in 2015.
Materials and Methods
1. Sources of Data
Publically available data were retrieved from the Korea Cen- ters for Disease Control, the Korean Ministry of Health and Welfare [1], the World Health Organization [12], and pub- lished literature [2, 4, 6, 13-18]. In addition, data were collect- ed from a series of conference proceedings [19-21], published government or hospital reports the MERS outbreak in Korea and local Korean news reports from May 2015 to February 2016. The latest published articles and conference proceed- ings were regarded as the most reliable resources followed by the government documents, and news reports. The available data concerning each case include age, sex, presence of co- morbidities, date of symptom onset, date of laboratory confir- mation, date of hospitalization, mortality, most likely source of exposure, and the possible locations where transmission might have occurred. This analysis included cases with proba- ble or identified epidemiologic links; cases with multiple po- tential sources of exposure or unidentified sources were ex- cluded.
2. Definitions
MERS-CoV infection was confirmed by positive real-time reverse transcriptase polymerase chain reaction assays as in the guidelines for laboratory diagnosis of MERS-CoV in Korea [22].
The date of symptom onset was defined as the first date of fever (≥37.5°C) or any relevant clinical symptoms among symptomatic patients [23]. When patients had no symptoms or symptoms were not clearly identified or reported, the symptom onset was defined as the date of the first positive laboratory test. In source cases, the number of days of illness
was defined as the time from the symptom onset in source cases to the first date of exposure in their secondary cases.
The MERS outbreak in Korea comprised three generations of disease. The index case was defined as the Generation Zero, with the first generation including secondary cases of this genera tion. Likewise, the subsequent generation comprised secondary cases of the previous generation: i.e. the second generation comprised secondary cases of the first generation of infection and the third generation comprised secondary cases of the second generation [2]. Superspreaders were de- fined as cases who were responsible for transmitting the virus to 5 or more individuals [6].
MERS countermeasures were taken chronologically as fol- lows. Initial interventions included quarantining only contacts who shared the same room with the primary case and health- care workers who cared for him/her. As of May 29, the opera- tional definition of close contacts was broadened and all con- tacts were vigorously traced and quarantined in an institution or at home for 14 days. Since June 3, laboratory testing has ex- panded and has become available in commercial laboratory testing centers, university hospitals, and local health and envi- ronmental institutes. On June 7, names of affected healthcare facilities were disclosed to the public and Drug Utilization Re- view (DUR) information was used to inform healthcare facili- ties of any possible points of contact [5]. Infection control practices in healthcare facilities were intensified, such as ap- propriate use of personal protective equipment, environmen- tal disinfection, complete/partial closure of the affected wards and quarantine of exposed patients in hospital. Updated in- fection control guidelines were issued. As of June 8, the Rapid Response Team was organized to take decisive action on countermeasure strategies and determine the extent and du- ration of quarantine for affected hospitals, in collaboration with the Ministry of Health and Welfare, hospital administra- tors, and local public health centers [24]. Fever clinics were set up to screen possible MERS cases and patients with pneumo- nia were preemptively isolated until they tested negative for MERS-CoV infection. As of June 10, nationwide pneumonia surveillance was also carried out in order to detect unidenti- fied MERS cases [6].
3. Statistical Analysis
1) The incubation period and serial interval
The incubation period was calculated by identifying the ear- liest and latest possible date of exposure and the date of symp- tom onset for each case. Because the data are interval cen-
sored, we used non-parametric and parametric methods to estimate the incubation period. First, we calculated the ob- served (non-parametric) incubation period per each case, de- fined as the time interval between the midpoint of exposure period and the date of symptom onset. Kaplan-Meier analysis was used to estimate the median value of the observed incu- bation periods. Second, we fitted the data to a gamma distri- bution and identified the maximum-likelihood estimates of the incubation period. The parametric distribution was com- pared with empirical cumulative density functions of the ob- served incubation period.
To identify the variables associated with observed incuba- tion period length, the Cox proportional hazard function was used. In addition, the fitted distributions of incubation periods were compared by bootstrapping the difference in means to verify the results of the univariate analysis. Multivariate analy- sis was performed by incorporating significant variables in the univariate analysis (P<0.1) and other potential confounders such as age, sex, and underlying diseases.
The serial interval was estimated by identifying the infec- tor-infectee pairs and the onset of symptoms of each pair.
Cases with unidentifiable symptom onset or asymptomatic cases were excluded from estimating the serial interval. For sensitivity analysis, various definitions of exposures and symptom onsets were used to evaluate the difference among groups. Data analyses were performed using R version 3.2.5 (R Foundation for Statistical Computing, Vienna, Austria) and coarseDataTools in R [25].
2) The effective reproduction number
Because of the transmission heterogeneity, early esti mates of basic reproduction number can be inappropriate. The ef- fective reproduction number (R), the actual average number of secondary cases per primary case, is commonly used to characterize transmissibility and to assess the effectiveness of countermeasures during an epidemic, given that R less than the epidemic threshold at 1 suggests an epidemic under con- trol [26]. Countermeasures implementation affects contact rates and transmissibility, and consequently, the value of R can change over time. Taking this effect into account, we esti- mated R using three methods: the reproduction number at disease generation (Rg), the case reproduction number (Rc), and the time varying instantaneous reproduction number (Rt)
Rg was calculated by averaging the number of secondary cases caused by each primary case in each time of disease generation [27]. Rc is the average number of secondary cases that individuals with symptom onset at time t can expect to
infect. This was estimated by applying a likelihood-based method by Wallinga and Teunis [10]. Rt is the average number of secondary transmissions occurring at time t [26, 28]. Rt was estimated by applying Bayesian statistical inference incorpo- rating uncertainty in the distribution of the serial interval [26].
We used the mean serial interval (12.9 days ± 4.4 days) esti- mated from this study, the serial interval (12.6 days ± 2.8 days) from the previous analysis was also used for sensitivity analysis [16]. Daily Rc and Rt were estimated over a one-day window using EpiEstim in R [26].
4. Ethical Considerations
This study analyzed the publicly available data with private information deidentified, so this study was not subject to the approval of the Institutional Review Board.
Results
1. Description of Transmission
Data were collected from a total of 186 cases. Beginning from the Generation Zero (the primary case), there were 28 cases, 124, and 29 cases in the first, second, and third genera- tion, respectively. There were four cases for which generation was not classified; three of them could have been exposed to either the first or second generation cases and one did not have any identifiable epidemiologic link with confirmed cas- es. A total of 150 cases (81.1%) were linked to 5 superspread- ers. The demographic and clinical characteristics of these cas- es are summarized in Table 1.
We estimated the incubation periods of 162 cases with a sin- gle source of exposure (28, 113, and 21 cases in the first, sec- ond, and third generation, respectively). Among these 162 cases, dates of symptom onset were not validated in 9 cases in the second generation, so the serial intervals were estimated with the data of 153 cases. The overall median incubation pe- riod was estimated to be 7.4 days (95% confidence interval [CI], 6.9-8.0) with less than 2.9 days in 5% of cases and less than 15.3 days in 95% of them (Fig. 1A). The median serial in- terval was estimated to be 12.9 days (95% CI, 12.2-13.5) with less than 6.9 days in 5% of cases and less than 21.5 days in 95%
(Fig. 1B). The temporal trends of incubation periods and serial intervals are depicted in Figure 2. The time from onset to labo- ratory confirmation was shortened over time during the MERS outbreak (Fig. 2).
2. The Incubation period and associated factors
The incubation periods did not significantly differ according to age, sex, or the presence of comorbidities. Instead, they were different according to the order of disease generation, links to superspreaders, and the days of illness in source cases when transmission occurred (Fig. 3, Table 2, supplementary Table 1).
The first generation cases had significantly shorter incuba- tion periods than those of the second or third generation.
Moreover, cases linked to superspreaders tended to have
Figure 1. The distribution of incubation periods (A) and serial intervals (B) in the Middle East respiratory syndrome outbreak in Korea in 2015.
The estimation included 162 cases with a single source of exposure for incuba- tion periods and 153 cases with identified onset of symptoms for serial intervals.
The fitted distributions are plotted against the empirical cumulative density function of observed incubation periods (midpoint of exposure to symptom onset) and se- rial intervals (black line). The 95% confidence intervals for the 5th, 50th, and 95th percentiles of these fitted distributions are also plotted. Bootstrapped estimates are in grey shading.
A
B
shorter incubation periods than those without any links to su- perspreaders.
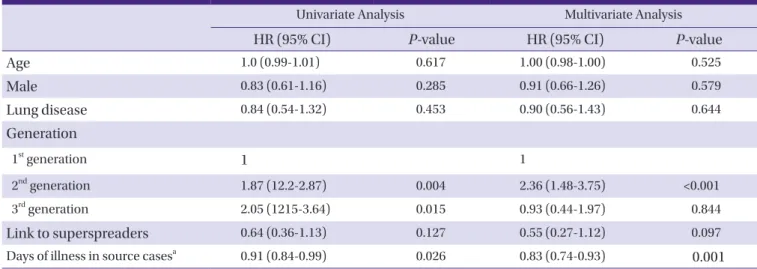
We found that the days of illness in source cases were in- versely correlated with the incubation periods of their second- ary cases (hazard ratio [HR], 0.91 [95% CI, 0.84-0.99] per one illness day increase; P=0.026). There was a trend toward short- er incubation periods for receiving cases when source cases had been ill for longer when the exposure occurred. Incuba- tion periods were significantly longer in cases who were ex- posed to their source cases in ≤ 3 days of illness (median 8.9 days [95%CI, 7.2-10.7]) as compared to those whose source cases had been ill for ≥4 days (median 6.8 days [95% CI, 6.3- 7.4]) whereas those exposed to infectors who had been ill for
≥7 days had shorter incubation period (median 5.9 [95%CI 4.8-7.3] days).
In the multivariate analysis, this inverse relationship was not changed (HR, 0.83 [95% CI, 0.74-0.93] per increase of one ill- ness day; P=0.001) whereas the effect of the generation order on the length of incubation periods was attenuated (Table 2).
In the MERS outbreak in Korea, the third generation cases were exposed to their source cases in the early stage of dis- ease as compared to case of other generations. The median days of illness in source cases were one day among the third generation cases whereas the second generation cases were exposed to those undergoing a median 6 days of illness. As the epidemic progressed, the time from symptom onset to laboratory confirmation was becoming shorter as illustrated in Figure 2, which indicated early detection and isolation of MERS cases once they had symptoms during the late phase of the epidemic.
Table 1. Demographic and clinical characteristics of confirmed cases according to the disease generation during the Middle East respiratory syndrome outbreak in Korea in 2015.
1st generation
(N = 28)
2nd generation
(N = 124)
3rd generation
(N = 29) P- valuea Age, mean years
(SD) 52 (14.9) 56.6 (16.0) 48.4 (17.6) 0.03
Gender 0.68
Male 16 (57.1) 75 (60.5) 15 (51.7) Female 12 (42.9) 49 (39.5) 14 (48.3)
Case classification <0.01
Patient 13 (46.4) 62 (50) 8 (27.6) HCW 4 (14.3) 12 (9.7) 15 (51.7) Othersb 11 (39.3) 50 (40.3) 6 (20.7) Comorbid
conditions
17 (60.7) 66 (53.2) 10 (34.5) 0.11
Diabetes 5 (17.9) 17 (13.7) 2 (6.9) 0.46 CKD 1 (3.6) 11 (8.9) 1 (3.45) 0.43 Liver disease 3 (10.7) 12 (9.7) 1 (3.45) 0.53 Malignancy 4 (14.3) 20 (16.1) 3 (10.3) 0.73 Lung disease 6 (21.4) 18 (14.5) 1 (3.45) 0.13 Case fatality 4 (14.3) 32 (25.8) 2 (6.9) 0.05 Link to
superspreaders
28 (100) 110 (88.7) 11 (37.9) <0.01
Number of identified source cases
1 5 9
SD, standard deviation; HCW, healthcare workers; CKD, chronic kidney disease
aFor age, one-way ANOVA test was performed. For categorical variables, Chi- squared test for trend was performed; bOthers included family members, visitors, and paid caregivers.
Figure 2. The temporal trend of incubation periods (A), serial intervals (B) and time form symptom onset to confirmation (C) during the Middle East res- piratory syndrome outbreak in Korea in 2015.
In the box plots, the box extends from the 25th to 75th percentile (interquartile range, IQR) of observations with the center line indicating the median. The bars define the upper (75th percentile + 1.5 IQR) and lower values (25th percentile-1.5IQR). In (C), the gray bars indicate the mean days from symptom onset to confirmation with stand- ard errors.
A B C
3. The reproduction number over time
The generational reproduction number was estimated with the data of 182 cases with identified generations. Despite the zero generation (the primary case) generating 28 cases (Rg
28), a rapid decline in Rg was noted from 4.43 (124/28) in the first generation to 0.23 (29/124) in the second generation.
When reanalyzing only cases associated with non-super- spreaders, the value of Rg was estimated to be <1 in the first generation (0.56, 14/25).
Such findings were consistent with the estimated Rc. The ep- idemic curve was converted into the time course of effective reproduction numbers (Fig. 4). Rc was estimated to be 3.99 on May 19 and plateaued for a week, then declined thereafter. Rc began to fall below the epidemic threshold level at a value of 1 on May 31 and then declined towards 0 through June. This date coincided with the highest peak in the incidence of
MERS-CoV infection in the epidemic curve. Estimation of Rt
showed two peaks coinciding with occurrence of the initial and subsequent superspreading events. Afterwards, Rt de- creased steadily and fell below a value of 1 on June 12. Rc was ahead of Rt by approximately 13 days (the mean serial inter- val), meaning that decreased transmissibility on June 12 was attributable to the low transmission potential in cases who had the symptom onset on May 31.
Discussion
This study explored the effectiveness of the countermea- sures and their impact on incubation periods and reproduc- tion number during the MERS outbreak in Korea in 2015. As the epidemic progressed, the incubation periods became lon- ger, which was partially attributable to the stringent counter-
Table 2. Factors associated with the longer duration of incubation periods of Middle East respiratory syndrome-coronavirus infection in Korea
Univariate Analysis Multivariate Analysis
HR (95% CI) P-value HR (95% CI) P-value
Age 1.0 (0.99-1.01) 0.617 1.00 (0.98-1.00) 0.525
Male 0.83 (0.61-1.16) 0.285 0.91 (0.66-1.26) 0.579
Lung disease 0.84 (0.54-1.32) 0.453 0.90 (0.56-1.43) 0.644
Generation
1st generation 1 1
2nd generation 1.87 (12.2-2.87) 0.004 2.36 (1.48-3.75) <0.001
3rd generation 2.05 (1215-3.64) 0.015 0.93 (0.44-1.97) 0.844
Link to superspreaders 0.64 (0.36-1.13) 0.127 0.55 (0.27-1.12) 0.097
Days of illness in source casesa 0.91 (0.84-0.99) 0.026 0.83 (0.74-0.93) 0.001
HR, hazard ratio; CI, confidence interval
aHazard ratio was estimated per 1 illness day increase.
Figure 3. Differences in distributions of incubation periods according to the disease generation (A), a link to superspreaders (B), and days of illness in source cases (C).
B C
A
measures which were implemented since the second epidem- ic wave. The effectiveness of countermeasures was suggested by the decline in the reproduction number in late May and early June.
Although the variations in incubation periods are often con- sidered to be intrinsic to the pathogens and hosts [29], envi- ronmental factors also play an important role in determining their duration. Because the infective dose can be influenced by the disease status of infectors and route of transmission, the infection control interventions, such as early detection and isolation of symptomatic cases and use of protective equipment, could influence incubation duration by reducing the chance of exposure to higher viral loads. This phenome- non was observed in the MERS outbreak in Korea where the
incubation periods tended to be longer as the order of the dis- ease generation increased.
During the MERS outbreak in Korea, the time from symp- tom onset to confirmation decreased over time as the labora- tory tests became widely available. As cases were more readily identified during the outbreak, the third generation cases could have fewer chances to be exposed to infectors in the lat- er stage of illness and have longer incubation periods as a re- sult. The inverse relationship between the days of illness in source cases and incubation periods in their secondary cases in this study also supports this finding. Moreover, a recent study showed that the timing and intensity of viral shedding in MERS cases was similar to that of severe acute respiratory syndrome (SARS) with the peak shedding after 10-12 days Figure 4. The epidemic curve of the Middle East respiratory syndrome outbreak in Korea in 2015 (A) and daily estimates of the case repro- duction number Rc (B) and the instantaneous reproduction number Rt (C). Rc is depicted with 95% confidence intervals (vertical bars) where the grey region indicates Rc below 1 (B). Rt is shown with 95% credible intervals in grey shading and a dotted line indicates Rt at 1(C).
A
B
C
from symptom onset [30]. However, the information on the vi- ral shedding kinetics of MERS-CoV is still limited [31] and there were exceptional cases with the highest viral loads in the early stage [30]. Therefore, future research should be focused on the kinetics of viral shedding in order to gain concrete knowledge on the transmission dynamics of MERS-CoV. Be- sides the effect of countermeasures, the incubation period could have been affected by different exposure settings, ade- quate use of personal protective equipment, behavioral change with the increase in public awareness, and by stochas- tic effect.
Despite the inappropriate response during the initial stage of the MERS outbreak in Korea, tremendous efforts were later made to contain the epidemic. The study results suggest that these stringent countermeasures effectively brought this epi- demic under control. The results of all estimated R were con- sistent. Despite the initial surge in Rg due to the early super- spreading event linked to the primary case, Rg rapidly declined to <1 in the second generation which coincided with the time when the value of Rc dropped below a value of 1 on May 31. Rt
also followed the temporal trend with a 13-day delay. Al- though it is difficult to separate the effect of interventional component, the combination of vigorous contact tracing and strict quarantine targeted towards second generation cases was considered to play a key role in lowering the transmissi- bility in this epidemic.
However, given that the basic reproduction number R0 for MERS-CoV was estimated to be < 1 in the previous literature [32] and considering the low transmissibility among close contacts with non-superspreaders in the MERS outbreak in Korea [33], questions were raised regarding the necessity of such stringent interventions to this degree. In Korea, among 16,752 quarantined contacts, 1.1 % were confirmed to have MERS-CoV infection [1]. In the present study, Rg for cases not linked to superspreaders was estimated to be 0.56, indicating that without superspreading events, transmissibility of MERS- CoV was substantially low. A decline in Rc immediately after implementation of the stringent interventions also suggests the low transmissibility of MERS-CoV. Nonetheless, the poten- tial of superspreading events should not be underestimated in dealing with MERS-CoV infection. For this reason, it is crucial to identify the factors contributing to such events.
Studies have been performed to characterize superspread- ers in the MERS outbreak in Korea. Supersperaders tended to have pneumonia and severe cough at the diagnosis, suggest- ing higher viral shedding [6]; they also tended to make multi- ple contacts via multiple facilities [33]. However, there were
non-superspreading or non-transmitting cases who had simi- lar characteristics. In order to gain a better understanding of the issues at hand, in-depth research on both cases should be performed taking into account multiple perspectives includ- ing those relating to the environment, behavior, virology, and host genetic factors.
This study has several limitations. First, a detailed investiga- tion is currently underway, so “who-infected-whom” pairs and the dates of exposure and onset of symptoms will be subject to change in the future. Thus, the estimated epidemiologic pa- rameters will be subject to change as well. Second, viral loads shed from infectors, the routes of transmission through drop- lets or contacts, and detailed information on comorbid condi- tions were not available. As these factors can also affect trans- missibility and incubation duration, further further analysis should be performed once such information is open to re- searchers. Third, there were no serologic data of asymptomat- ic contacts to this point. Because confirmatory tests were not performed on asymptomatic contacts, it is possible that as- ymptomatic cases had not been detected. Without this infor- mation, the transmission potential could be underestimated.
Despite these limitations, this explorative study provides valu- able insight into the effectiveness of countermeasures and change in the incubation periods over time during the MERS outbreak in Korea.
As the MERS outbreak in Korea has ended, the question aris- es regarding how we can use the lessons learnt from MERS to improve countermeasure strategies against future outbreaks of MERS and introduction of new infectious diseases. Our analy- sis shows that the implementation of stringent countermea- sures rapidly limited the impact of the epidemic despite the de- layed response in the initial stage. Timely estimation of the transmission potential can help to establish the efforts needed to contain the epidemic. For future research, the impact of each intervention needs to be evaluated through proper modelling of the MERS outbreak in Korea.
Conflicts of Interest
No conflicts of interest
ORCID
Sun Hee Park http://orcid.org/0000-0001-5648-9237 Woo Joo Kim http://orcid.org/0000-0002-4546-3880
Supplementary material
Supplementary data including one table can be found with
this article online http://www.icjournal.org/src/sm/ic-48- 108-s001.pdf.
References
1. Ministry of Welfare and Health. MERS statistics. Available at: http://www.mers.go.kr/mers/html/jsp/Menu_C/list_
C 4 . j s p ? m e n u I d s = & f i d = 5 7 6 7 & q _ t y p e = & q _ v a l - ue=&cid=65327&pageNum=1. Accessed 25 Feb 2016.
2. Kim KM, Ki M, Cho SI, Sung M, Hong JK, Cheong HK, Kim JH, Lee SE, Lee C, Lee KJ, Park YS, Kim SW, Choi BY. Epi- demiologic features of the first MERS outbreak in Korea:
focus on Pyeongtaek St. Mary's Hospital. Epidemiol Health 2015;37:e2015041.
3. Chun BC. Definition and management of the close con- tacts with Middle East respiratory syndrome cases: reflec- tion and lessons in 2015 Korean outbreak. J Korean Med Assoc 2015;58:692-9.
4. Ki M. 2015 MERS outbreak in Korea: hospital-to-hospital transmission. Epidemiol Health 2015;37:e2015033.
5. Lee C, Ki M. Strengthening epidemiologic investigation of infectious diseases in Korea: lessons from the Middle East Respiratory Syndrome outbreak. Epidemiol Health 2015;37:e2015040.
6. Korea Centers for Disease Control and Prevention (KCDC). Middle East Respiratory Syndrome coronavirus outbreak in the Republic of Korea, 2015. Osong Public Health Res Perspect 2015;6:269-78.
7. Nishiura H. Early efforts in modeling the incubation peri- od of infectious diseases with an acute course of illness.
Emerg Themes Epidemiol 2007;4:2.
8. Anderson RM, May RM. Infectious disesaes of humans:
dynamics and control. Oxford, United Kingdom: Oxford University Press; 1991.
9. Fisman DN, Leung GM, Lipsitch M. Nuanced risk assess- ment for emerging infe ctious dis eas es. Lancet 2014;383:189-90.
10. Wallinga J, Teunis P. Different epidemic curves for severe acute respiratory syndrome reveal similar impacts of con- trol measures. Am J Epidemiol 2004;160:509-16.
11. Lloyd-Smith JO, Schreiber SJ, Kopp PE, Getz WM. Super- spreading and the effect of individual variation on disease emergence. Nature 2005;438:355-9.
12. World Health Organization (WHO). Coronavirus infec- tions: disease outbreak neews. Available at: http://www.
who.int/csr/don/archive/disease/coronavirus_infec-
tions/en/. Accessed 1 December 2015.
13. Choi JH, Yoo B, Lee SY, Lee EG, Ki M, Lee W, Jung JR, Chang K. Epidemiological investigation of the 119th con- firmed Middle East Respiratory Syndrome coronavirus case with an indefinite mode of transmission during the Pyeongtaek outbreak in Korea. Epidemiol Health 2015;37:e2015054.
14. Chang K, Ki M, Lee EG, Lee SY, Yoo B, Choi JH. MERS epi- demiological investigation to detect potential mode of transmission in the 178th MERS confirmed case in Pyeo- ngtaek, Korea. Epidemiol Health 2015;37:e2015036.
15. Park HY, Lee EJ, Ryu YW, Kim Y, Kim H, Lee H, Yi SJ. Epi- demiological investigation of MERS-CoV spread in a sin- gle hospital in South Korea, May to June 2015. Euro Sur- veill 2015;20:1-6.
16. Cowling BJ, Park M, Fang VJ, Wu P, Leung GM, Wu JT. Pre- liminary epidemiological assessment of MERS-CoV out- break in South Korea, May to June 2015. Euro Surveill 2015;20:7-13.
17. Oh M, Choe PG, Oh HS, Park WB, Lee SM, Park J, Lee SK, Song JS, Kim NJ. Middle East Respiratory Syndrome Coro- navirus superspreading event involving 81 persons, Korea 2015. J Korean Med Sci 2015;30:1701-5.
18. Kim SG. Healthcare workers infected with Middle East re- spiratory syndrome coronavirus and infection control. J Korean Med Assoc 2015;58:647-54.
19. Chun BC. Epidemiology of the MERS outbreak in Korea in 2015. Intensive Course for Infection Control for Health- care-associated infections. Seoul: Korean Society for Healthcare-associated Infection Control; 2015.
20. Park SH. The same MERS-CoV but different hopspital epi- demiology. International Interscience Conference on In- fection and Chemotherapy. Seoul: The Korean Society of Infectious Diseases; 2015.
21. Choi WS. Clinical characteristics and treatment outcomes of MERS patients in Korea. The Korean Association of In- ternal Medicine 2015 Fall Conference. Seoul: The Korean Association of Internal Medicine; 2015.
22. Lee H, Ki CS, Sung H, Kim S, Seong MW, Yong D, Kim JS, Lee MK, Kim MN, Choi JR, Kim JH; Korean Society for Lab- oratory Medicine MERS-CoV Task Force. Guidelines for the laboratory diagnosis of Middle East Respiratory Syn- drome Coronavirus in Korea. Infect Chemother 2016;48:61- 9.
23. Korea Centers for Disease Control and Prevention (KCDC). Guide- line for management of MERS. Available at: http://cdc.go.kr/
CDC/info/CdcKrHealth0295.jsp?menuIds=HOME001-MNU1132-
MNU1013-MNU1509-MNU1915&fid=5747&q_type=&q_
value=&cid=63292&pageNum=. Accessed 3 September 2015.
24. Korean Society of Infectious Diseases, and Korean Society for Healthcare-associated Infection Control and Preven- tion. The same Middle East Respiratory Syndrome-Coro- navirus (MERS-CoV) yet different outbreak patterns and public health impacts on the Far East expert opinion from the Rapid Response Team of the Republic of Korea. Infect Chemother 2015;47:247-51.
25. Reich NG, Lessler J, Cummings DAT, Brookmeyer R. Esti- mating incubation period distributions with coarse data.
Stat Med 2009;28:2769-84.
26. Cori A, Ferguson NM, Fraser C, Cauchemez S. A new framework and software to estimate time-varying repro- duction numbers during epidemics. Am J Epidemiol 2013;178:1505-12.
27. Chowell G, Abdirizak F, Lee S, Lee J, Jung E, Nishiura H, Viboud C. Transmission characteristics of MERS and SARS in the healthcare setting: a comparative study. BMC Med 2015;13:210.
28. Fraser C. Estimating individual and household reproduction numbers in an emerging epidemic. PLoS One 2007;2:e758.
29. Fine PEM. The Interval between successive cases of an in- fectious disease. Am J Epidemiol 2003;158:1039-47.
30. Corman VM, Albarrak AM, Omrani AS, Albarrak MM, Far- ah ME, Almasri M, Muth D, Sieberg A, Meyer B, Assiri AM, Binger T, Steinhagen K, Lattwein E, Al-Tawfiq J, Müller MA, Drosten C, Memish ZA. Viral shedding and antibody response in 37 patients with Middle East Respiratory Syn- drome Coronavirus infection. Clin Infect Dis 2016;62:477- 83.
31. de Sousa R, Reusken C, Koopmans M. MERS coronavirus:
data gaps for laboratory preparedness. J Clin Virol 2014;59:4-11.
32. Breban R, Riou J, Fontanet A. Interhuman transmissibility of Middle East respiratory syndrome coronavirus: estima- tion of pandemic risk. Lancet 2013;382:694-9.
33. Nishiura H, Endo A, Saitoh M, Kinoshita R, Ueno R, Nakao- ka S, Miyamatsu Y, Dong Y, Chowell G, Mizumoto K. Iden- tifying determinants of heterogeneous transmission dy- namics of the Middle East respiratory syndrome (MERS) outbreak in the Republic of Korea, 2015: a retrospective epidemiological analysis. BMJ Open 2016;6:e009936.