2013 KSDF 1229-0033/2013-03/1-6
ⓒ
〈Research Paper〉
1. Introduction
Electrochemistry is one of the important chemical studies to determine molecular chemical properties. In electrochemistry field, the energy level’s calculation has been reported by many researchers1,2). These energy levels are related to HOMO (Highest Occupied Mole- cular Orbital) and LUMO (Lowest Unoccupied Mole- cular Orbital) values. In this regard, HOMO and LUMO values have received great attention with molecular orbital and electron distributions. These values are useful for the electro-chemistry study with related to quantum chemistry calculation and redox/oxidation deter- mination to estimate chemical potentials3,4). In this context, cyclicvoltammogram and computational calculation are mainly used for analyzing molecular energy levels.
In this study, rhodamine 6G-Naphthaldehyde chemo- sensor (RNCS) was investigated by cyclicvoltammetric and computational calculation for HOMO and LUMO energy levels. In this approach, reduction and oxidation potentials were calculated and its findings were com- pared to the simulated energy states of the prepared chemosensor.
†Corresponding author: Young-A Son ([email protected]) Tel.: +82-42-821-6620 Fax.: +82-42-823-8870
2. Experimental
2.1 Rhodamine 6G-naphthaldehyde Chemo- sensor (RNCS)
The scheme was represented to the synthesis of RNCS, which was refered to the part of our previous study5). The outline was shown in Figure 1.
RNCS was synthesized through 2step reaction with rhodamine 6G hydrazide and 2-hydroxy-1-naphthal- dehyde. Rhodamine 6G hydrazide is prepared according to the literature method6 8)‐ . Rhodamine 6G hydrazide (1.5mmol, 0.6437g) and 2-hydroxy-1-naphthaldehyde (1.5 mmol, 0.2582g) were dissolved in absolute EtOH.
The mixture solution was mixed and added 3 drops of acetic acid. After 8h, reaction mixture cooled to room temperature, yellow precipitate was filtered off, washed with EtOH. Obtained solid was recrystallized from MeCN/water to give RNCS as 0.6620g (76%
yield). 1H N‐ MR (400MHZ, CDCl3) : 12.12 (1H, s), 9.64 (1H, s), 7.89 (1H, d), 7.65 (1H, d), 7.52 (2H, t), 7.39 (2H, t), 7. 30 (1H, t), 7.14(1H, t), 6.99 (1H, t), 6.94 (1H, d), 6.32 (2H, s), 6.19 (2H, s), 3.35 (2H, s), 3.05 (4H, q), 1.72 (6H, s), 1.14 (6H, t). MS: 582 (M+).
Abstract: Nowdays, the computational simulation of molecular energy potentials and the empirical evidence using electrochemical reduction/oxidation values are very significant factors to predict of molecule’s energy potentials. The prepared chemosensor herein consists of spirolactam ring system in the structure, providing intra structural change with metal cation‐ binding. In this study, rhodamine 6G Naphthaldehyde chemosensor was determined and compared with HOMO/LUMO energy‐ levels by computational calculation and cyclic voltammogram method.
Keywords: chemosensor, HOMO, LUMO, Rhodamine 6G, naphthaldehyde, cyclicvoltammogram, absorption, electron distribution
Characteristics of HOMO and LUMO Energy Potentials toward Rhodamine 6G-Naphthaldehyde Chemosensor
Hyungjoo Kim, Do-Hyun Lee1 and Young-A Son†
Department of Advanced Organic Materials and Textile System Engineering, Chungnam National University, Daejeon, Korea
1Korea Dyeing Technology Center, Daegu, Korea
(Received: February 28, 2013 / Revised: March 12, 2013 / Accepted: March 21, 2013)
O N
O
NH N
H NH2
O N
O O
NH HCl
NH2 H2N
MeOH, Reflux EtOH, Reflux
O N
O
NH N
H N
HO HOO
RNCS Scheme 1. The Scheme for RNCS
2.2 Measurements
Absorption and fluorescence spectra of the prepared RNCS were measured with and Agilent 8453 spectro- photometer and a Shimadzu RF 5301PC‐ fluorescent spectrophotometer, respectively. The electro chemistry‐ properties were examined with Versa STAT 3 using a platinum wire served as a working electrode, and Ag/Ag+ electrode served as a reference electrode and a carbon served as a counter electrode. The scan rate was 50mV/s. The optimized geometry structure and molecular energy potentials were calculated with Materials studio 4.3.
3. Results and Discussion
As shown in Figure 1 and Figure 2, Absorption and emission spectra of RNCS were investigated to observe the effect of metal bindings. In absorption spectrum, there is no specific intensity with RNCS (10 M) onlyμ in absorbing behavior. Upon the addition of Cu2+
(10 M), strong absorption intensity appreared at 523μ nm, indicating 9-folds increased intensity compared to RNCS only. In addition, emission intensity also in- creased by adding Cu2+. It was about 40 folds. These‐ drastic changes in absorption and emission can be explained by the spirolactam closed-open ring sys- tem9 11)‐ . When spirolactam ring is closed, colorless and non fluorescence effects are observed from RNCS‐ molecule. After adding Cu2+, RNCS may react with this metal cation: consisting of ligand binding position and making spirolactam ring open. Color and fluor- escence effects are increased and appeared as shown in Figure 1 and Figure 2.
Through these results, RNCS molecule can exist two different molecular structural forms by spirolactam ring system and metal ligand binding position.
Wavelength(nm)
480 500 520 540 560 580 600
Absorbance
0.00 0.02 0.04 0.06 0.08 0.10
RNCS
RNCS + Cu2+
Figure 1. UV-Vis spectra of RNCS (10 M) upon additionμ of Cu2+ ions (10 M) in MeCN.μ
Wavelength(nm)
540 560 580 600 620
Fluorescence Intensity
0 10 20 30 40
RNCS + Cu2+
RNCS
Figure 2. Fluorescence spectra of RNCS (10 M) uponμ addition of Cu2+ ions (10 M) in MeCN.μ
In addition, The binding ratio between RNCS and Cu2+ was also determined by Job’s plot method as shown in Figure 3. The result indicated 1:1 ratio reaction between RNCS and Cu2+. Through the result, the structure of RNCS + Cu2+ was proposed in scheme 2, which was introduced in the reported work12,13).
In absorption and emission spectra changes of RNCS and RNCS + Cu2+, it is concluded that two different
[Cu2+]/[Cu2+]+[RNCS]
0.0 0.2 0.4 0.6 0.8 1.0
A at 521nm - A 0
0.0 0.5 1.0 1.5 2.0 2.5 3.0
Figure 3. Job’s plot method between RNCS and Cu2+.
structures can be transformed through closed and the open spirolactam ring system in RNCS structure. To investigate HOMO and LUMO energy levels, RNCS and RNCS + Cu2+ were measured by spectroscopic and cyclicvoltammetry methods.
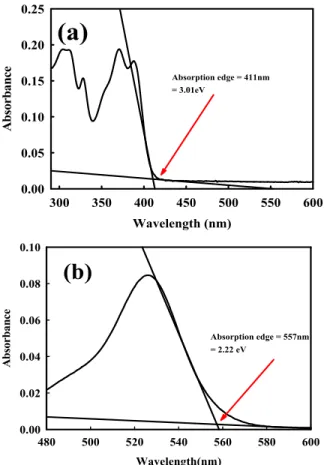
In Figure 4 (a) and (b), absorption spectrum was determined to calculate band gap energy by spectro‐ - scopic: using eV = 1240/λ from the absorption edge14). The band gap of RNCS was calculated and‐ obtained by the value of 3.01 eV. Whereas, RNCS + Cu2+ showed the band gap value of 2.22 eV. This‐ result indicated that metal binding ligand position and spirolactam ring open structure are attributable to the decrease of the band gap value of RNCS about 0.79‐ eV.
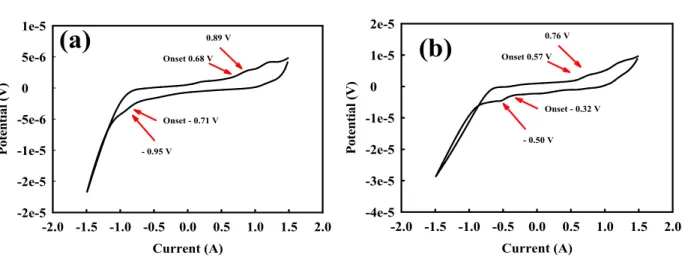
Cyclicvoltammograms were carried out to calculate HOMO/LUMO energy levels of RNCS and RNCS + Cu2+ using oxidation/redox energy potentials. These energy potential values can be obtained from peak and onset point in Figure 5 (a) and (b). The forms of spectra for RNCS and RNCS + Cu2+ were also found.
O N
O
NH N
H N
HO
RNCS
Cu2+
NH O NH
O N N
O
RNCS + Cu2+
Scheme 2. Proposed scheme for RNCS + Cu2+
Wavelength (nm)
300 350 400 450 500 550 600
Absorbance
0.00 0.05 0.10 0.15 0.20 0.25
Absorption edge = 411nm
= 3.01eV
(a)
Wavelength(nm)
480 500 520 540 560 580 600
Absorbance
0.00 0.02 0.04 0.06 0.08 0.10
(b)
Absorption edge = 557nm
= 2.22 eV
Figure 4. UV Vis band-gap measurements : (a) RNCS (10‐ M), (b) RNCS (10 M) + Cu
μ μ 2+ (10 M) in MeCN.μ
It is indicated that electrochemical properties are clearly affected by closed and open type structure of RNCS.
Using these two points such as peak and onset potentials, the corresponding HOMO and LUMO energy levels were calculated by the following equation (1).
HOMO (or LUMO) (eV) =
-4.8 – (E peak / onset – E 1 / 2 (Ferrocene)) ··· (1) E1/2 (ferrocene) was assigned to 0.42V, indicating half wave potential of ferrocene‐ 14 16)‐ .
Current (A)
-2.0 -1.5 -1.0 -0.5 0.0 0.5 1.0 1.5 2.0
Potential (V)
-2e-5 -2e-5 -1e-5 -5e-6
0 5e-6 1e-5
Onset 0.68 V
Onset - 0.71 V - 0.95 V
0.89 V
(a)
Current (A)
-2.0 -1.5 -1.0 -0.5 0.0 0.5 1.0 1.5 2.0
Potential (V)
-4e-5 -3e-5 -2e-5 -1e-5
0 1e-5 2e-5
Onset 0.57 V
Onset - 0.32 V - 0.50 V
0.76 V
(b)
Figure 5. Cyclic voltammograms : (a) RNCS (500 M), (b) RNCS (500 M) + Cuμ μ 2+ (500 M) in MeCN. Tetrabutyμ - lammonium perchlorate was added for electrolyte.
Figure 6. HOMO/LUMO energy levels and electron distributions for RNCS and RNCS + Cu2+.
Sample Onset (eV) Peak (eV) Computational Calculations (eV)
Dye HOMO LUMO △E HOMO LUMO △E HOMO LUMO △E
RNCS -5.06 -2.05 3.01 -5.27 -3.43 1.84 -8.311 -0.561 7.75
RNCS + Cu2+ -4.95 -2.73 2.22 -5.14 -3.88 1.26 -5.657 -2.485 3.172 Table 1. HOMO/LUMO and band gap energy potential‐
From the result of calculations as shown in Table 1, little differences were observed by the calculated values between the peak and onset potentials, respectively.
However, these values obtained from each different potentials play an important role to investigate electro- chemical properties for RNCS and RNCS + Cu2+.
Electron distributions and energy levels of HOMO
and LUMO states were also simulated and calculated in Figure 6. In RNCS, electron density localization was significantly shifted from xanthene to hydroxy- naphthaldehyde in HOMO and LUMO states. This electron distribution was also shown with a similar pattern in RNCS + Cu2+, showing that electrons were moved from rhodamine 6G part to naphthaldehyde.
With the above results obtained from spectroscopic, cyclicvoltammograms and computational calculations, the resulting potential energy values were compared in Table 1. The onset potential values are much closer to the computational calculated values. This result indicated that the calculated values obtained from onset potentials can be more useful to determine HOMO and LUMO energy levels.
4. Conclusions
In this work, structural changes of RNCS induced by spirolactam closed-open ring system were inves- tigated with the electrochemical approach. By analyzing spectroscopy, cyclicvoltammetry and computational calculation, band-gap and HOMO/LUMO energy levels were obtained and compared. The result indicated that the closed-open molecular structure can affect to its electrochemical properties and onset potentials are more useful approaches than peak potentials to calculate HOMO/LUMO energy levels.
Acknowledgment
This research was supported by a grant from the fundamental R&D program for core technology funded by the ministry of knowledge economy, Republic of Korea.
References
1. G. B. Ferreira, E. Hollauer, N. M. Comerlato, and J. Wardell, An Experimental and Theoretical Study of the Electronic Spectra of Tetraethylammonium [bis(1,-dthiole-2-thione-45-2-thione-45-ditho ato)M(III)] and Tetraethylammonium [bis(1,3-di- thiole-2-e-4,5-dithilato)M(III)] (M = Sb or Bi), Spectrochim. Acta Part A, 71(1), 215(008).
2. C. N. Ramachadran, D. Roy, and N. Sathyamurthy,
Host-Guest Interaction in Endohedral Fullerenes, Chem. Physic. Lett., 461, 87(2008).
3. I. Losito, F. Palmisano, and P. G. Zambonin, O-Phenylenediamine Electropolymerization by Cyclic Voltammetry Combined Ectrospray Ioization-Ion Tap Mass Spectrometry, Anal. Chem., 75(19), 4988 (2003).
4. C. J. Tonzola, M. M. Alam, W. Kainsky, and S. A.
Jenekhe, New n-Type Organic Semiconductors:
Synthesis, Single Crystal Structures, Cyclic Vol- tammetry, Photophysics, Electron Transport, and Electroluminescence of Series of Diphenylanthrazo- lines, J. Am. Chem. Soc., 125(44), 13548(2003).
5. H. Kim and Y. A. Son, Synthesis and Optical Properties of Novel Chemosensor Based on Rhoda- mine 6G, Textile Coloration and Finishing(J. Korean Soc. Dye. and Finish.), 24(4), 233(2012).
6. S. P. Wu, T. H. Wang, and S. R. Liu, A Highly Selective Turn-On Fluorescent Chemosensor for Copper(II) Ion, Tetrahedron, 66(51), 9655(2010).
7. M. Beija, C. A. Afonso, and J. M. Martinho, Synthesis and Applications of Rhodamine Derivatives as Fluorescent Probes, Chem. Soc. Rev., 38(8), 2410(2009).
8. W. Y. Kang and J. S. Park, Preparation of Polymeric Metal Complex Containing Azo Dye Rotaxane, Textile Coloration and Finishing(J. Korean Soc. Dye. and Finish.), 23(3), 163(2011).
9. L. Huang, X. Wang, G. Xie, P. Xi, Z. Li, M.
Xu, Y. Wu, D. Bai, and Z. Zeng, A New Rhoda- mine-Based Chemosensor Cu2+ and The Study of Its Behaviour in Living Cells, Dalton Trans., 39(34), 7894(2010).
10. D. Wu, W. Huang, C. Duan, Z. Lin, and Q. Meng, Highly Sensitive Fluorescent Probe or Selective Detection of Hg2+ in DMF Aqueous Media, Inorg.
Chem., 46(5), 1538(2007).
11. X. Chen, T. Pradhan, F. Wang, J. S. Kim, and J.
Yoon, Fluorescent Chemosensors Based on Spiro- ring-Opening of Xanthenes and Related Deri- vatives, Chem. Rev., 112(3), 1910(2012).
12. M. Dong, T. H. Ma, A. Zhang, Y. M. Dong, Y.
W. Wang, and Y. Peng, A Series of Highly Sensitive
and Selective Fluorescent and Colorimetric “Off- On” Chemosensors for Cu(II) Based on Rhoda- mine Derivatives, Dyes and Pigments, 87(2), 164 (2010).
13. G. H. Wu, D. X. Wang, D. Y. Wu, Y. Gao, and Z. Q. Wang, Highly Sensitive Optical Chemo- sensor for the Detection of Cu2+ Using a Rhoda- mine B Spirolatam, J. Chem. Sci., 121(4), 543 (2008).
14. H. S. Lee and J. H. Kim, Measurement of Physical Properties of Conducting Polymers, Polymer Sci.
Technol, 18, 488(2007).
15. Y. S. Kim, J. I. Shin, S. Y. Park, K. Jun, and Y. A. Son, Electrochemical Studies on Heptamethine Cyanine Dyes, Textile Coloration and Finishing(J.
Korean Soc. Dye. and Finish.), 21(5), 35(2009).
16. Y. S. Kim, S. H. Kim, T. K. Kim, and Y. A.
Son, Characteristics of HOMO and LUMO Poten- tials by Altering Substituents: Computational and Electrochemical Determination, Textile Coloration and Finishing(J. Korean Soc. Dye. and Finish.), 20(5), 41(2008).