Journal of the Ergonomics Society of Korea
Vol. 31, No. 2 pp.345-352, April 2012 http://dx.doi.org/10.5143/JESK.2012.31.2.345
Accuracy and Reliability of The Spine-Pelvis Monitor to Record Three-Dimensional Characteristics of
The Spine-Pelvic Motion
Jung Yong Kim1,2, Kyung Chae Yoon1, Seung Nam Min1, Sang Young Yoon3
1Department of Industrial and Management Engineering, Hanyang University, Ansan, Korea 426-791
2Institute of Aging Society, Hanyang University, Seoul, Korea 133-791
3Department of Industrial and Information Systems Engineering, Ajou University, Suwon, Korea 442-749
ABSTRACT
Objective: The aim of this study is to evaluate the accuracy and reliability of Spine-Pelvis Monitor(SPM) that was developed to measure 3-dimensional motion of spine and pelvis using tilt sensor and gyro sensor. Background: The main cause of low back pain is very much associated with the task using the low back and pelvis, but no measurement technique can quantify the both spine and pelvis. Method: For testing the SPM, 125 angles from three anatomical planes were measured three times in order to evaluate the accuracy and reliability. The accuracy of SPM in measuring dynamic motion was evaluated using digital motion analysis system. The motion pattern captured by two measuring methods was compared with each other. In result, the percentage error and Cronbach coefficient alpha were calculated to evaluate the accuracy and reliability.
Results: The percentage error was 0.35% in flexion-extension on sagittal plane, 0.43% in lateral bending on coronal plane, and 0.40% in twisting on transverse plane. The Cronbach coefficient alpha was 1.00, 0.99 and 0.99 in sagittal, coronal and transvers plane, respectively. Conclusion: The SPM showed less than 1% error for static measurement, and showed reasonably similar pattern with the digital motion system. Application: The results of this study showed that the SPM can be the measuring method of spine pelvis motion that enhances the kinematic analysis of low back dynamics.
Keywords: Spine, Pelvis, Motion, SPM(Spine-Pelvis Monitor), Accuracy, Reliability
1. Introduction
허리질환은 작업장에서 발생하는 가장 일반적이고 비용 이 많이 드는 근골격계질환 중의 하나이다. 과거 수십년 동 안 작업장에서 허리질환과 관련된 위험 요인의 다양한 증 거가 역학 조사 결과로 나타났으며, 그 중에서 특히 들기 작 업은 작업 관련 요통의 주된 요인으로 밝혀졌다(Andersson, 1981; Bigos et al., 1986; Brown, 1975; Chaffin and Park,
1973; Frymoyer et al., 1983; Garg and Moore, 1989;
Magora, 1972; Marras, 2003; Marras and Kim, 1993;
Pope, 1989; National Research Council and Institute of Medicine, 2001; Skovron ML, 1992). 더구나 Kelsey et al.(1984)는 11.3kg 이상의 작업물을 신체를 비틀면서 드 는 작업이 허리 디스크가 탈출될 위험성이 높은 것과 관련 이 있다고 발표하였다.
3차원 동적 들기의 생체역학적 손실에 대한 조사가 이 루어졌는데 Marras et al.(1984)과 Marras et al.(1986,
Corresponding Author: Kyung Chae Yoon. Department of Industrial and Information Systems Engineering, Ajou University, Suwon, Korea 442-749.
Mobile: 011-9939-1749, E-mail: [email protected]
Copyright@2012 by Ergonomics Society of Korea(pISSN:1229-1684 eISSN:2093-8462). All right reserved.
○ccThis is an open-access article distributed under the terms of the Creative Commons Attribution Non-Commercial License(http://creativecommons.org/licenses/by-nc/3.0/), which permits unrestricted non-commercial use, distribution, and reproduction in any medium, provided the original work is properly cited.
1987)는 동작 속도가 증가하면 몸통의 힘이 감소한다고 하 였다. 또한 Marras and Mirka(1989, 1990)는 몸통의 비대 칭 동작도 속도가 증가하면 몸통의 힘이 감소한다고 하였다.
Marras and Sommerich(1991a, b)는 동적 조건 하에서는 예측되는 척추 상의 압축 및 전단 힘이 상당히 증가 한다고 하였다.
이와 같은 정보들은 작업장에서 이루어지는 3차원의 다양 한 동적인 몸통 동작을 조사할 필요가 있음을 시사한다. 그 러나 작업장에서 3차원의 동적인 몸통 동작을 측정하고 모 니터하여 기록하는 것은 작업 환경 여건 상 쉽지 않다. 비디 오를 기반으로 한 동작 분석 시스템이 사용되지만 산업 현장 의 작업 환경은 각종 기계 설비, 조명, 먼지 및 작업자 이동 등에 의하여 비디오 카메라의 시야에 방해를 받아 카메라와 몸에 부착된 마커 사이의 신호 시스템 간섭으로 작업자의 3 차원 동적 동작을 정확하게 측정할 수 없다. 특히 단위 작업 이 다수 포함되어 수시로 이동이 발생되는 작업은 더욱 더 측정하기 어렵다. 따라서 3차원의 동적인 동작을 작업 환경 상의 제약이 있더라도 정확하고 상세하게 기록할 필요가 있 으며 이를 위해 Spine-Pelvis Monitor(SPM: 이하 SPM이 라 한다)가 개발되었다.
본 연구의 목적은 개발된 SPM 출력값의 정확도(accu- racy)와 신뢰도(reliability) 및 기존의 동작 분석용 카메라 측정에서 나타난 동작 패턴과의 유사성을 평가하는 것이다.
2. Method
2.1 Outline of SPM
SPM은 앞서 언급한 작업 환경 상의 제약을 극복하여 3차 원의 동적인 몸통 동작 요소를 상세히 기록하기 위해 개발되 었다. SPM은 센서를 사용하여 몸통(trunk: spine + pelvis) 과 골반 부분(pelvis)의 동적인(dynamic) 동작을 측정하여 각도(degree), 각속도(degree/sec) 및 각가속도(degree/
sec2) 등으로 나타냄으로써 정량적인 분석이 가능하도록 개 발된 장비이다.
SPM은 한 개의 2축(X-Y) 기울기 센서(tilt sensor)와 한 개의 관성 센서(gyro sensor)가 한 쌍을 이루고 척추 및 골반의 외골격에 각각 위치하도록 착용함으로써 앞/뒤 굽힘 과 폄, 좌/우 굽힘 및 비틀림 동작을 할 때 3차원의 동작을 측정하고 기록할 수 있도록 만든 장비이다.
2.2 SPM Hardware
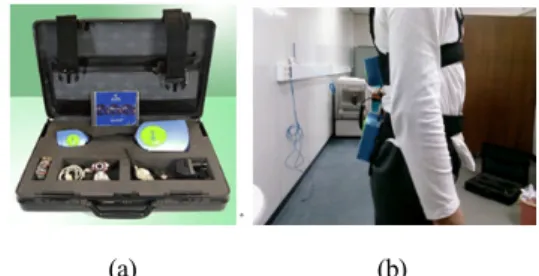
SPM은 Figure 1(a)과 같이 분석 소프트웨어, 상·하부
센서, 고정벨트, 무선데이터 수신기, 직류전원장치 등으로 구 성되어 있다. 상·하부 센서 내에는 앞뒤 굽힘 폄(flexion/
extension)`및 좌우 굽힘(lateral bending)의 동작 범위 (range of motion)를 측정하기 위한 기울기 센서(tilt sensor) 와 비틀림의 동작 범위(range of motion)를 측정하기 위한 관성 센서(gyro sensor)를 각각 탑재하고 있고, 1차 미분하 여 각속도(degree/sec)를, 2차 미분하여 각가속도(degree/
sec2)를 각각 계산 하였다. 상·하부 센서는 몸통 외골격의 해당 부분에 정확하게 위치하도록 Figure 1(b)와 같이 고정 벨트를 사용하여 착용하였다.
몸통 동작에 따라 센서에서 발생되는 신호는 무선 수신 기에 의하여 데이터가 컴퓨터로 전송되며 이를 소프트웨어 에서 분석하여 해부학에서 쓰이는 평면인 시상면(sagittal plane), 관상면(coronal plane) 및 횡단면(transverse plane)으로 구분하여 각도, 각속도 및 각가속도를 그래프 및 정략적 수치로 나타낸다. SPM은 24,000~24,835Ghz의 주 파수 대역을 사용하며 무선 통신의 블루투스 기능을 가지고 있다.
2.3 Measurement of accuracy and reliability
몸통의 3평면(시상면, 관상면, 횡단면)에 대한 각도를 비 교 평가하기 위해 미리 각도를 선정하였다. 이들 각도는 각 신체 절단면마다 10~30° 간격의 5개 각도로서 앞뒤 굽힘 폄 각도는 -10°·0°·30°·60°·90°로, 좌우 굽힘 각도는 20°·10°·0°·-10°·-20°로, 비틀림 각도는 20°·10°
·0°·-10°·-20°로 각각 정하였다[Figure 2].
몸통의 3평면에 따른 각도별 측정 순서는 첫 번째 앞뒤 굽힘 폄에서는 -10°, 좌우 굽힘에서는 -20° 및 비틀림에 서는 -20°를 시작으로 부록 1과 같이 순차적으로 정하여 모두 125개의 항목에 대해서 3회씩 반복 측정하였다. 여기 에서 앞뒤 굽힘 폄 각도의 +부호는 시상면의 선자세에서 몸통을 앞으로 굽히는 동작을 의미하고 -부호는 몸통을 뒤 로 젖히는 동작을 의미한다. 좌우 굽힘 각도의 +부호는 관
(a) (b)
Figure 1. SPM equipment(a: SPM; b: subject wearing the SPM)
상면에서 몸통을 우측으로 굽히는 동작을 의미하고 -부호 는 몸통을 좌측으로 굽히는 동작을 의미한다. 비틀림 각도의 +부호는 횡단면에서 몸통을 우측으로 비트는 동작(시계 방 향)을 의미하고 -부호는 몸통을 좌측으로 비트는 동작(시계 반대 방향)을 의미한다.
정확도와 신뢰도를 평가하기 위하여 3축(X-Y-Z)으로 움직일 수 있는 거치대에 Figure 3과 같이 Biometric사의 단축 goniometer(single axis torsiometers Q110)과 전자 각도계를 SPM의 상·하부 센서에 부착하여 10~30° 간격 으로 정해진 각도만큼 SPM를 움직였을 때 goniometer, 전 자각도계, SPM의 출력값을 측정하였으며, 이를 3회 반복 측정하였다. 3축 거치대에 부착된 goniometer에서는 비틀 림 각도를 측정하였으며 goniometer의 오차는 ±0.1이다.
전자각도계로는 앞뒤 굽힘 폄 및 좌우 굽힘 각도를 측정하 였다.
2.4 Measurement of motion pattern
동적인 동작 패턴을 평가하기 위해 SPM을 몸통에 직접 착용하여 측정된 신호값과 Motion analysis corporation사 의 디지털 동작 분석 시스템의 측정값을 비교하였다. 디지털 동작 분석 시스템은 motion capture system(디지털 실시 간 처리 시스템, 적외선 디지털 카메라)과 motion capture software(EVaRT)로 구성되어 있는데, motion capture system의 적외선 디지털 카메라는 목적물에 위치한 마커에 의해 반사되는 적외선 신호를 포착하는 기능을 한다.
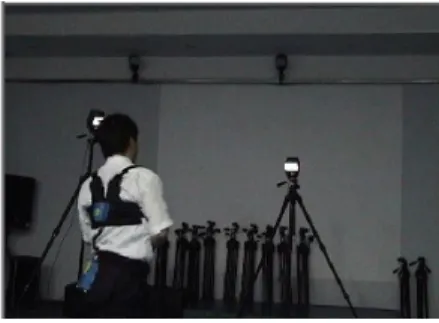
동작 분석이기의 마커를 각각 3개씩 부착한 SPM의 상·
하부 센서(Figure 4)를 실험자의 몸통의 외골격에 착용하고 (Figure 5) 6대의 적외선 디지털 카메라를 배치하여 실험자 의 동작을 측정하였다
동작 결과 수집되는 SPM 및 동작 분석 시스템의 출력 신 호는 각각 A/D 신호로 변환되어 컴퓨터로 전송되며 소프트 웨어에서 몸통 각 면(시상면, 관상면 및 횡단면)에서의 각도, 각속도 및 각가속도를 계산하여 컴퓨터 상에 그래픽으로 나 타내고 이를 토대로 상대적인 동작 패턴을 비교 평가하였다.
동작 순서는 앞뒤 굽힘 폄, 좌우 굽힘 및 비틀림 동작 순으 로 각각 수행하였으며 이를 그래프로 및 정량적 수치로 나 타내어 동작 패턴을 상호 비교하였다. Data는 60Hz에서 수 집되었다.
Lateral bending
5 angles
measuring 25 times per each angle 5 x 25 = 125
Flexion/extension
5 angles
measuring 25 times per each angle 5 x 25 = 125
Twisting
5 angles
measuring 25 times per each angle 5 x 25 = 125
Figure 2. Measruing angles for each motion
Figure 4. Six markers for motion capture attached to SPM
Figure 5. Subject with SPM in front of infrared light digital camera for motion capture
Figure 3. Measuring apparatus for the accuracy and reliability of SPM
2.5 Analysis
이 실험에서 3방면의 정해진 각도만큼 goniometer를 움 직였을 때 측정되는 SPM의 출력값의 정확도(accuracy)와 신뢰도(reliability)를 평가하였다. 정확도는 SPM의 출력값 이 goniometer의 기준값에 얼마나 근접하였는가를 나타내 기 위한 평가이고, 신뢰도는 같은 측정기로 동일한 조건에서 3회 반복 측정하였을 때 SPM의 출력값이 얼마나 일관성 있 게 나오는 가를 나타내기 위한 평가이다. 정확도를 위해서는 식 1과 같이 백분율 오차 (percent error)를 산정하여 평 가하였다.
. 100 .
.
goniometer goniometer spm
Deg Deg
Deg (1)
Deg.spm: SPM에서 3회 반복 측정된 각도의 평균값 Deg.gonoimete: goniometer 에서 정한 각도(기준 각도)
신뢰도 평가를 위해서는 식 2와 같이 크론바흐 α계수 (Cronbach coefficient alpha)를 산정하여 평가하였다. 이 는 각 측정값들 사이의 일관성의 정도를 나타내기 위한 것 이다.
) 1
1( 2
1 2
t N i
i
N N
(2)
N: 항목수
2
t 는 125회 측정된 각도의 전체 항목의 총분산
2
i : 항목 i의 분산
동적인 동작 패턴의 평가는 SPM과 동작 분석 시스템에 의하여 측정된 출력값을 그래프로 나타내어 평가하였다.
3. Result
정확도(accuracy)의 백분율 오차를 나타내는 값으로서 시상면, 관상면 및 횡단면에서 goniometer에서 정한 각도 (기준 각도)에 대한 SPM 각도의 백분율 오차를 나타내었다.
백분율 오차는 시상면의 앞뒤 굽힘 폄 동작에서는 0.35%, 관상면의 좌우 굽힘 동작에서는 0.43%, 횡단면의 비틀림 동 작에서는 0.40%를 나타냈다[Table 1]. 이는 시상면의 오차
율이 0.35%로서 99.65%, 관상면의 오차율이 0.43%로서 99.57% 및 횡단면의 오차율이 0.40%로서 99.60%의 정 확도를 각각 나타내는 것으로서 정확도가 매우 높은 것으로 평가할 수 있다.
신뢰성(reliability)평가의 한 방법인 크론바흐 α계수 (Cronbach coefficient alpha)를 나타내는 값으로서 시상면, 관상면 및 횡단면에서 SPM을 3회 반복 측정하였을 때 그 측정값들 사이의 일관성의 정도를 평가하였다[Table 2]. 측 정 항목수 125개(부록 1)에 대한 크론바흐 α계수는 시상 면의 앞뒤 굽힘 폄 동작에서는 1.00, 관상면의 좌우 굽힘 동 작에서는 0.99, 횡단면의 비틀림 동작에서는 0.99로 나타나 매우 높은 수준의 신뢰도를 가졌다고 볼 수 있다.
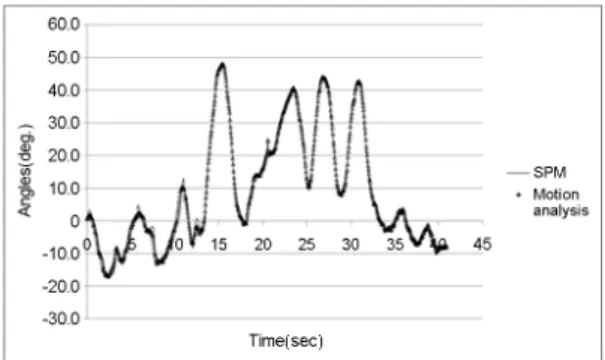
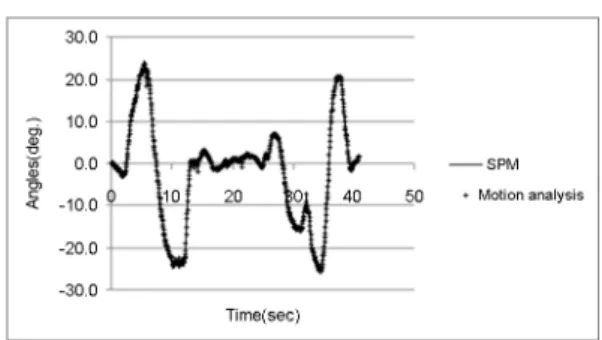
시상면, 관상면 및 횡단면에서 동작 분석 시스템의 마커를 부착한 SPM을 착용하여 동작했을 때의 그래프를 나타낸 것 으로서 상호 동작 패턴을 비교하였다[Figure 6, 7, 8]. 전반 적인 동작 패턴에 있어서 SPM과 동작 분석 시스템의 그래 프는 큰 차이를 나타내지 않았다.
Table 1. Percent error for each motion
Flexion/Extention Lateral bending Twisting Percent error 0.35% 0.43% 0.40%
Table 2. 125 Cronbach coefficient alpha for each motion Flexion/Extention Lateral bending Twisting
Alpha 1.00 0.99 0.99
Figure 6. Comparison of measured angles from SPM and motion analysis during flexion and extension
4. Discussion
시상면의 앞뒤 굽힘 폄의 정확도의 오차는 0.35%의 범위를 차지하며, 관상면의 좌우 굽힘의 정확도의 오차는 0.43%의 범위를 차지하며, 횡단면의 비틀림의 정확도의 오 차는 0.40%의 범위를 나타냈다. 따라서 SPM의 출력값은 goniometer의 기준값에 매우 근접하므로 3평면의 정확도 는 매우 높은 것으로 평가할 수 있다. 신뢰도에서는 크론바 흐 α계수(Cronbach coefficient alpha)가 시상면의 앞뒤 굽힘 폄 동작에서는 1.00, 관상면의 좌우 굽힘 동작에서는 0.99, 횡단면의 비틀림 동작에서는 0.99로 나타나 매우 높 은 수준의 신뢰도를 가진 것으로 나타났다. SPM과 동작 분 석 시스템에 의한 동작 분석에서는 그래프 상에 나타난 동작 의 궤적도 매우 유사한 동작 패턴을 나타내고 있다.
이 연구는 SPM이 해부학적인 신체 3평면의 동작 특성을 측정하는데 매우 정확하다는 것을 보여 준다. 또한 이 장비 는 디지털 동작 분석 시스템의 한계를 극복했다. 즉 신호 인 식 위치 에러가 최소화되어 정확도가 매우 높고 또한 반복 수행도에서도 신뢰도가 높아 정밀도가 매우 높다는 것을 보
여준다. 그래서 이 장비는 작업장에서 다양한 인력 운반 작 업(MMH)과 같은 몸통 동작을 모니터하여 측정하는데 매우 신뢰할 수 있는 자료를 얻을 수 있다.
SPM은 정확할 뿐만 아니라 동작을 모니터하기 위한 동작 인식 비디오 카메라가 필요 없기 때문에 비용이 저렴한 장점 이 있다.
또한 SPM 장비는 신체의 외골격에 착용한 상태에서 동작 을 모니터하기 때문에 동작 분석 시스템의 마커와 비디오 카메라 사이의 신호 왜곡 등이 발생하지 않으므로 정확하며 사용이 간편하다. 특히 단위 작업이 다수인 작업에서는 동작 분석 시스템에서는 마커와 비디오 카메라의 설치 위치로 인 하여 신호를 인식하는데 기계류 등에 의하여 거리 상의 제 약이 있을 수 있으나 SPM은 신체의 몸통에 착용한 채로 동 작을 모니터하기 때문에 휠씬 용이하게 사용할 수 있다.
따라서 SPM 장비는 작업장에서 몸통 동작을 평가할 때 몇 가지 가치 있는 정보를 제시해 준다.
첫째 인력 운반 작업(MMH)을 할 때 3차원 몸통 자세 정 보로써 몸통 또는 허리와 골반 사이의 동적인 동작 사이에서 힘의 발휘와 관련하여 다양한 분석이 가능해진다. 특히 상·
하부 센서의 착용 위치에 따라 몸통과 골반 사이의 동작에 대한 다양한 분석이 가능하다.
둘째 3차원 몸통 자세 정보는 부하 모멘트 정보와 함께 사용될 때 작업장의 정량적인 생체역학 평가를 가능하게 한 다. 몸통 자세와 관련하여 외부 부하가 가해졌을 때 몸통과 골반 사이의 과도한 힘발휘와 관련한 리스크를 결정하는데 사용될 수 있다.
셋째 동적인 힘의 능력은 단위 작업(task)과 관련된 속도 특성을 상세히 기록할 수 있다. Marras et al.(1984, 1987) 은 몸통의 힘이 각속도가 증가하는 만큼 줄어드는 방식을 입 증했다. Marras and Mirka(1989)는 동적인 몸통 힘이 몸통 위치가 더욱 비대칭이 되는 만큼 어떻게 변하는 가를 기술하 였다. 따라서 몸통 동작의 각도, 각속도 및 각가속도 등의 속 도 특성을 상세히 기록할 수 있고 동적 들기에 의한 몸통과 골반 사이의 과도한 힘발휘의 리스크를 평가할 수 있다.
5. Conclusion
본 연구는 개발된 SPM 출력값의 정확도(accuracy)와 신 뢰도(reliability) 및 기존의 동작 분석용 카메라 측정에서 나타난 동작 패턴과의 유사성을 평가하였다. 개발된 SPM은 동적인 동작 행위에 있어서 각도, 각속도 및 각가속도 등과 관련하여 정상인의 올바른 자세 판별과 정상인과 허리질환 자를 판별하거나 상해의 정도를 나타내는 지표로 사용될 수 Figure 7. Comparison of measured angles from SPM and
motion analysis during lateral bending
Figure 8. Comparison of measured angles from SPM and motion analysis during twisting
있으며 작업자가 작업에 복귀할 수 있는 정도를 판단하는데 귀중한 자료로 사용될 수도 있을 것이다.
References
Andersson, G. B., Epidemiologic aspects on low-back pain in industry, Spine, 6(1), 53-60, 1981.
Bigos, S. J., Spengler, D. M., Martin, N.A., Zeh, J., Fisher, L., Nachemson, A. and Wang, M. H., Back injuries in industry: A retrospective study.
II. Injury factors, Spine, 11(3), 246-251, 1986.
Brown, J. R., Factors contributing to the development of LBP in industrial workers, American Industrial Hygiene Association Journal, 36(1), 26-31, 1975.
Chaffin, D. B. and Park, K. S., A longitudinal study of low back pain as associated with occupational lifting factors, American Industrial Hygiene Association Journal, 34(12), 513-525, 1973.
Frymoyer, J. W., Pope, M. H., Clements, J. H., Wilder, D. G., MacPherson, B. and Ashikaga, T., Risk factors in low back pain An epidemiological survey, The journal of bone and joint surgery, 65 (2), 213-218, 1983.
Garg, A. and Moore, J. S., Epidemiology of low back pain in industry. In:
Moore JS, Farg A, editors. Ergonomics: low-back pain, carpal tunnel syndrome, and upper extremity disorders in the workplace.
Philadelphia(PA): Hanley and Belfus, 7(4), 593-608, 1992.
Kelsey, J. L., Githens, P. B.,White, A. A., Holford, T. R., Walter, S. D., Connor, T. O., Ostfeld, A. M., Weil, U., Southwick, W. O. and Calogero, J. A., An epidemiologic study of lifting and twisting on the job and risk for acute prolapsed lumbar intervertebral disc, Journal of orthopaedic research, 2(1), 61-66, 1984.
Magora, A., Investigation of the relation between low back pain and
occupation. 3. Physical requirements: Sitting, standing and weight lifting, Industrial Medicine, 41(12), 5-9, 1972.
Marras, W. S., The case for cumulative trauma in low back disorders. Spine, 3, 177-179, 2003.
Marras, W. S. and Mirka, G. A., Trunk strength during asymmetric trunk motion, Human Factors, 31(6), 667-677, 1989.
Marras, W. S. and Mirka, G. A., Trunk responses to asymmetric acceleration, Journal of Orthopaedic research, 8(6), 824-832, 1990.
Marras, W. S. and Sommerich, C. M., A three-dimensional motion model of loads on the lumbar spine, Part I: Model structure, Human Factors (in press), 1991a.
Marras, W. S. and Sommerich, C. M., A three-dimensional motion model of loads on the lumbar spine, Part II: Model validation, Human Factors(in press), 1991b.
Marras, W. S., King, A. I. and Joynt, R. L., Measurements of loads on the lumbar spine under isometric and isokinetic conditions, Spine, 9(2), 176-188, 1984.
Marras, W. S. and Kim, J. Y., Anthropometry of industrial populations, Ergonomics, 36(4), 371-378, 1993.
Marras, W. S., Rangarajulu, S. L. and Wongsam, F. E., Trunk force development during static and dynamic lifts, Human Factors, 29, 19 -29, 1987.
Marras, W. S., Wongsam, P. E. and Rangarajulu, R. L., Trunk motion during lifting: The relative cost, International Journal of Industrial Ergonomics, 1(2), 103-113, 1986.
National Research Council, Institute of Medicine, Musculoskeletal disorders and the workplace: Low back and upper extremities(Washington, DC: National Academy Press), 2001.
Pope, M. H., Risk indicators in low back pain, Annals of medicine, 21(5), 387-392, 1989.
Skovron, M. L., Epidemiology of low back pain, Baillière's Clinical Rheumatology, 6(3), 559-73, 1992.
Appendix 1. Classification of angles and measured values for each motion Flexion/Extension
(-10°, 0°, 30°, 60°, 90°)
Lateral bending (20°, 10°, 0°, -10°, -20°)
Twisting (20, 10, 0, -10, -20) Values(3 times) Values(3 times) Values(3 times) No.
ROM 1st 2nd 3rd ROM
1st 2nd 3rd ROM
1st 2nd 3rd 1 -10 -9.9 -9.8 -10.0 -20 -19.7 -19.9 -20.1 -20 -20.0 -20.1 -19.8 2 -10 -9.7 -9.9 -10.2 -20 -20.0 -19.8 -19.8 -10 -9.9 -10.1 -9.8 3 -10 -9.9 -9.9 -10.1 -20 -19.8 -19.9 -20.0 0 0.0 0.2 0.0 4 -10 -10.0 -9.8 -9.9 -20 -20.4 -19.9 -20.0 10 10.1 9.8 10.1 5 -10 -10.2 -10.3 -9.9 -20 -19.9 -20.0 -19.8 20 20.0 19.8 19.9 6 -10 -9.8 -10.0 -9.7 -10 -10.2 -10.1 -10.1 -20 -20.1 -20.0 -20.2 7 -10 -9.9 -10.2 -9.9 -10 -10.0 -9.9 -9.9 -10 -9.8 -10.1 -9.8 8 -10 -10.2 -9.8 -9.8 -10 -9.9 -9.8 -10.2 0 0.0 0.2 0.0 9 -10 -10.1 -10.1 -9.8 -10 -9.8 -10.1 -9.9 10 10.1 9.8 10.1 10 -10 -9.8 -10.2 -9.9 -10 -9.8 -10.2 -10.1 20 19.9 19.8 20.0 11 -10 -9.9 -9.9 -9.8 0 0.1 0.0 -0.1 -20 -20.1 -20.2 -20.0 12 -10 -9.8 -9.8 -9.7 0 0.2 0.0 0.0 -10 -10.1 -9.8 -9.9 13 -10 -10.0 -9.6 -9.9 0 -0.2 0.0 0.1 0 0.2 0.0 0.0 14 -10 -10.1 -9.8 -10.2 0 0.0 0.1 -0.1 10 10.2 10.1 10.2 15 -10 -10.0 -10.2 -9.8 0 0.2 0.1 0.0 20 20.2 19.9 20.1 16 -10 -10.2 -9.9 -9.9 10 9.8 10.1 10.1 -20 -20.2 -20.0 -20.0 17 -10 -9.8 -9.9 -10.0 10 10.0 10.1 10.0 -10 -9.8 -10.1 -9.8 18 -10 -9.8 -9.7 -10.1 10 9.9 10.1 9.9 0 0.1 0.1 0.1 19 -10 -10.0 -9.9 -10.0 10 10.2 9.9 10.0 10 10.0 10.2 10.2 20 -10 -9.8 -9.8 -10.2 10 9.9 10.1 10.1 20 19.9 20.2 20.0 21 -10 -9.8 -9.8 -9.8 20 20.1 20.1 20.2 -20 -20.1 -19.9 -20.0 22 -10 -9.9 -9.9 -9.7 20 19.8 20.1 19.9 -10 -10.1 -10.0 -9.9 23 -10 -9.9 -9.9 -10.2 20 20.1 19.9 19.9 0 -0.1 -0.1 0.2 24 -10 -9.8 -9.8 -10.1 20 19.9 20.2 20.1 10 9.9 9.9 9.8 25 -10 -10.1 -10.1 -9.8 20 20.2 20.2 20.1 20 19.9 20.0 20.0 26 0 0.2 -0.1 0.0 -20 -20.1 -20.1 -20.0 -20 -19.9 -19.8 -20.3 27 0 0.3 -0.1 0.0 -20 -20.2 -19.9 -20.2 -10 -10.0 -10.1 -10.1 28 0 -0.1 -0.2 0.2 -20 -20.1 -20.1 -20.1 0 -0.1 0.1 -0.2 29 0 -0.2 0.1 0.1 -20 -20.2 -20.0 -20.1 10 10.0 9.8 10.2 30 0 0.0 0.0 0.0 -20 -20.1 -20.1 -20.0 20 19.9 20.0 20.1
ᆞ ᆞ ᆞ ᆞ ᆞ ᆞ ᆞ ᆞ ᆞ ᆞ ᆞ ᆞ ᆞ
ᆞ ᆞ ᆞ ᆞ ᆞ ᆞ ᆞ ᆞ ᆞ ᆞ ᆞ ᆞ ᆞ
ᆞ ᆞ ᆞ ᆞ ᆞ ᆞ ᆞ ᆞ ᆞ ᆞ ᆞ ᆞ ᆞ
125 90 89.8 89.8 89.7 20 19.9 19.9 19.9 20 19.9 20.1 20.0 ROM: range of motion
Seung-Nam Min: [email protected]
Highest degree: MS, Department of Industrial Engineering, Hanyang University
Position title: Doctoral candidate, Department of Industrial and Management Engineering, Hanyang University
Areas of interest: Safety, Biomechanics, Human Error, UX/UI, WMSDs, Human interface design
Sang Young Yoon: [email protected]
Highest degree: MS, Department of Industrial Engineering, Hanyang University
Position title: Doctoral candidate, Department of Industrial and Information Systems Engineering, Ajou University
Areas of interest: Safety, WMSDs, Human error, UX/UI
Date Received : 2011-11-01 Date Revised : 2012-02-24 Date Accepted : 2012-02-27
Author listings
Jung-Yong Kim: [email protected]
Highest degree: PhD, Department of Industrial Engineering, the Ohio state University
Position title: Professor, Department of Industrial and Management Engineering, Hanyang University
Areas of interest: UX/UI, Biomechanics, Cognitive psychology, Human interface design
Kyung Chae Yoon: [email protected]
Highest degree: MS, Graduate School of Engineering, Hanyang University
Position title: Doctoral candidate, Department of Industrial and Management Engineering, Hanyang University
Areas of interest: WMSDs, Behavioral Sciences, Human error, UX/UI, Biomechanics