서울시 지하철 역세권의 TOD 계획요소별 공간적 특성 분류
최형선1※·김태호2·이주형1
A Study on the Classification of the Spatial Characteristics by TOD Planning Elements of
Subway Station Areas in Seoul
Hyoung-Sun CHOI1※·Tae-Ho KIM2·Joo-Hyung LEE1
1)2)
요 약
최근 대중교통지향형개발(TOD)이 활발해지며, 역세권에 관한 관심이 증폭되고 있다. 역세권은 전통적인 대중교통 중심지 역할을 수행할 수 있다는 점에서 매력적이다. 그러나 역세권은 다양한 유형이 존재하고 있으나, 그러한 실증연구 분석은 다소 미진한 편이다. 따라서 본 연구는 대중교통 체계가 잘 갖추어져 있는 고밀도의 서울시를 대상으로 역세권의 다양한 유형을 파악하기 위하여 철도역으로 부터의 거리별로 TOD계획요소(밀도, 다양성, 접근성 등)를 중심으로 지표를 추출하여 요인분석과 GIS 공간분석을 시도하였으며, 유형화된 역세권의 특성 요인을 활용하여 국내 실증분 석에 대한 시사점을 제시하였다. 분석결과, 역세권의 TOD 통합 계획요소에 대한 요인분석에서 도 출된 흥미로운 결과는 첫째, 토지이용과 대중교통, 연계교통수단의 특성이 별개로 유형화되며, 둘 째, 역세권의 유형에 대한 유형을 명명하면, 고밀-상업, 업무형(Factor1), 소규모 획지형 (Factor2), 주거밀집형(Factor3), 복합개발형(Factor4), 연계수단형(Factor5), 타역인접형(Factor6), BRT혼합형(Factor7)으로 총 7개 유형에 영향을 받고 있는 것으로 나타났다. 마지막으로 역세권의 영 향요인 및 유형별로 공간분포 특성을 살펴보면, BRT혼합형(Factor7)의 경우는 서울의 중심부에서 외 곽으로 분포하는 도로 부분을 중심으로 발달해 있으며, 상대적으로 취약한 역세권도 확인 가능하였다.
본 연구는 각 역세권 공간적 특성 및 영향요인을 확인가능하고, GIS와 연동 가능하므로 도시 및 교통 관련 정책입안자들에게 역세권의 개발 계획 수립시 기초자료로 제시될 수 있을 것이다.
주요어 : 대중교통지향형개발, TOD계획요소, 역세권, GIS 공간분석
ABSTRACT
It is important to empirically investigate the typological characteristics of subway
2012년 8월 2일 접수 Received on August 2, 2012 / 2012년 10월 2일 수정 Revised on October 2, 2012 / 2013년 6월 21일 심사완료 Accepted on June 21, 2013
1 한양대학교 도시대학원 Graduate School of Urban Studies, HanYang University
2 성균관대학교 사회환경시스템공학과 Department of Civil Environmental Engineering, Sungkyunkwan University
※ Corresponding Author E-mail : [email protected]
station areas considering the comprehensive elements of transit-oriented development (TOD) planning so that its implementation can be effective in attaining both increase in transit ridership and decrease in inordinate automobile dependence. This article aims to identify diverse features of subway station areas in Seoul known for good public transit system. After collecting and manipulating the measures on planning elements such as density, diversity and accessibility for TOD planning by distance-based buffer from a subway station, the article tried to interpret analysis results on their typological characteristics. They can be summarized with two conclusions. First, characteristics of landuse and public transit system can be distinctly differentiated in the Seoul subway station areas. It implies that both planning elements should have not been integrated for now. Second, the characteristics of public transit system can be divided by modes. They provide us that public transit system in Seoul needs to be more strongly integrated than current system.
KEYWORDS : Transit-Oriented Development(TOD), TOD Planning Elements, Subway Station Area, GIS Spatial Analysis
서 론
1. 연구의 배경 및 목적
OECD통계연보에 따르면, 우리나라는 OECD 회원국 중 대한민국은 이산화탄소 배출량이 6 위, 국내총생산(GDP) 수준 대비로 9위로 경 제규모에 비하여 지나치게 많은 온실가스를 배출하고 있다. 심각한 상황을 개선하고자 도 시·교통 분야의 전문가 집단은 대중교통체계 를 우선시하는 다양한 노력을 강구하고 있다.
그러나 대중교통 서비스 개선에도 불구하고 대중교통분담률은 크게 향상되지 못하고 있어 근본적인 대중교통 활성화 정책이 필요하다.
이러한 필요성은 최근 대중교통 지향형 개발 (TOD : Transit Oriented Development) 도 입과 함께 역세권 개발 관련 연구들이 시작되 고 있다. 하지만 지금까지의 연구는 역세권의 특성을 세분화 하고 GIS를 활용한 공간적 특 성을 고려하지 못하고 있다. 따라서 본 연구 는 첫째 역세권 반경 250m, 500m, 750m, 1000m, 1250m, 1500m로 대별하여 개발밀 도, 토지이용의 다양성, 대중교통의 접근성, 물리적 환경데이터를 각각 추출 후에 요인분
석을 통하여 역세권 물리적 환경에 대한 주요 요인을 도출한다. 둘째, 도출된 요인을 중심으 로 해당 요인이 두드러진 역세권의 특성(Hot Spot)을 파악하고 분류한다. 마지막으로 ArcGIS를 통해 분류된 각 특성에 해당되는 역세권을 표출하고자 한다. 특히 ArcGIS를 이용하여 역세권마다 특성요인이 강하게 두드 러진 역의 분포를 보면 서울시 역세권의 공간 적 특성을 한눈에 살펴볼 수 있을 것이다.
국내 유사연구들이 500m 중심의 개발 밀도 를 활용한 1차원적 연구였다면, 본 연구는 역 세권의 세분화된 반경을 중심으로 추가적인 대 중교통 운영요소(버스의 장·단 노선, 배차간 격)과 녹색연계 교통수단(보행, 자전거 등)등 을 추가고려하고, 자료수집에만 국한하여 사용 되었던 GIS 공간분석을 통하여 역세권에 대한 공간적 특성까지 해석을 하고자 하는 점에서 차별화된 연구결과를 기대할 수 있을 것이다.
2. 연구의 범위 및 방법
본 연구를 위한 연구절차와 방법론은 크게 다 섯 단계로 구분하여 접근하였으며, 다음과 같다.
첫째, 국내외 역세권 및 TOD관련 연구문헌 을 검토하여, 대표적인 영향요소를 도출하였다.
특히 선행연구를 검토하는 과정에서는 본 연구 를 보다 실질적으로 진행할 수 있는 연구의 착 안점도 도출하고 연구의 방향을 정립하였다.
둘째, 대표 연구인 Sung et al.(2006), Transit Cooperative Research Program (2004)를 검토 활용하여 통합적 Density, Diversity, Accessibility를 고려한 TOD 계 획요소를 검토하고, 이를 바탕으로 GIS 기반 데이터를 250m 단위의 Buffer1)로 수집 및 종합하였다.
셋째, 역세권의 TOD 영향요인을 중심으로 그래프 및 기술통계분석을 활용하여 역세권 중심으로부터 반경별 변화를 확인한다.
넷째, 서울시 역세권의 대중교통 및 토지이 용 특성을 활용한 종합적인 유형화를 시도하 기 위하여 요인분석(Factor Analysis)을 실 시하고, 분석결과의 특성에 따른 역세권 유형 특성을 제시한다.
다섯째, 분류된 특성별 역세권의 공간적 특 성(Hot & Cold Spot, 분포 등)을 면밀하게 검토하기 위하여 요인점수와 GIS공간데이터 마이닝을 통하여 공간분포 특성을 도출하고 시사점을 제시하고자 한다.
TOD계획요소 및 선행연구 고찰
TOD 계획 요소 관련 대표연구인 Transit Cooperative Research Program(2004) TOD와 관련된 50개 실증 문헌 고찰을 통해 TOD계획요소별 실증효과를 요약하고 있다.
설정하였다. 이들 계획요소를 밀도(density), 복합적 토지이용(diversity), 도시설계(design) 로 구분하고 있다. 계획요소별 이들의 연구결 과를 종합하면, 첫째, 밀도(density)는 대중교 통결절점을 중심으로 대중교통의 이용정도를 제고하는 가장 큰 계획요소 중의 하나이며, 개발된 밀도의 수준과 형태에 따라서 영향력 의 크기는 달라질 수 있다.
둘째, 복합적 토지이용(diversity)은 주거, 소매, 상업과 교통시설 등의 복합화를 통하여 직주근접을 이룰 수 있는 경제활동시설들의
공간적 배열을 의미하며, 도시 용도 형태의 차이가 거주민들의 활동에 대한 선택, 활동을 유발하는 시설들의 입지, 시설을 이용하기 위 한 통행방식에 영향을 준다. 즉, 토지이용의 복합화는 통근(쇼핑)목적의 통행에 있어 승용 차 이용을 감소시키고, 대중교통 및 도보의 이용을 촉진시키게 된다고 볼 수 있다.
셋째, 도시설계(design)에 대하여 살펴보 면, 외국의 경우 TOD와 관련한 가이드라인에 서 가로망과 도시설계적인 요소가 상세히 언 급되어 있는 사례를 많이 볼 수 있는데, 상당 수의 경우 보행자의 접근성 및 편의성에 미치 는 요소로는 보행동선, 블록의 형태나 크기, 보행환경 등도 중요한 도시공간요소로 작용한 다고 하였다.
이들 연구를 바탕으로, 본 연구와 직접적인 선행연구를 검토하였다. Cervero(1988)는 밀 도관리의 핵심은 도로용량이 아니라 대량수송 이 가능한 대중교통시설의 서비스 수준과 효 율적 활용 정책이므로 기개발지에서 대중교통 서비스만 충분하면 고밀개발이 가능하다고 주 장 하였다. 반면에 고밀개발의 부정적 효과를 제시하고 있는 연구들(Ewing, 1995; Cox and Utt, 2004)도 있다. 이들은 교통 혼잡 심화, 높은 건설비 등의 이유로 Smart Growth 특히 압축도시와 관련해서는 부정적 효과의 가능성을 제시하고 있다.
Bang and Kim(2003), Kong(2005), Kim(2004), Kim(2005)의 연구를 살펴보면, 다양한 기반시설용량에 관련 된 연구가 진행 되고 있지만 주로 대도시를 대상으로 하는 연 구에서는 교통문제를 가장 심각한 개발제한요 소로 판단하여 도로용량의 제약에 따른 개발 밀도관리 방안 연구가 이루어 졌다.
Hwang and Jo(2005), Hwang et al.
(2006)는 서울 도심의 경우 대중교통시설이 충분하기 때문에 도로의 추가적인 공급 없이 밀도를 계획용적률보다 추가하는 방향으로 계 획이 가능하다고 하였다. 특히, Simulation 분 석을 토대로 개발용적률 420%보다 100% 이 상 추가 개발하여도 교통문제가 악화되지 않
는다고 주장하였다.
Sung et al.(2010), Oh et al.(2010), Moon and Roh(2012)은 지하철역의 이용수 요와 TOD계획요소의 관계를 분석하였다. 특 히, Sung et al.(2010)는 요인분석(Factor Analysis)을 실시하였고, 그 결과를 토대로 토지이용현황과의 연관성을 파악하기 위하여 지하철역 반경 500m 이내의 평균지가, 토지 유형별 총 연상면적, 주민등록상 총 거주인구 와 총 종사자수를 기초로 다차원척도법을 활 용하여 역세권을 유형화하였다.
Sung et al.(2010), Oh et al.(2010), Moon and Rho(2012)의 연구는 이용자변수 (일일교통카드자료)와 역세권의 공급변수(노 선수, 정류장수, 환승여부 등)를 이용한 연관 성을 실증 분석하였다. 분석결과로는 대중교 통 공급시설이 대중교통 이용수요에 밀접한 연관성이 있음을 규명하였다. 선행연구 고찰 결과, Sung et al.(2010), Oh et al.(2010), Moon and Rho(2012)의 연구에서 일부 연상 면적을 활용한 토지이용(주거, 비주거)분류 및 대중교통이용수요 영향에 대한 실증분석 연구가 진행되고 있다. 하지만, 분석범위를 500m(법적)로 한정한 연구가 주를 이루고 있 어, 서울과 같이 환승역과 광역적 측면의 역 세권이 많은 경우는 역세권의 범위를 500m로 한정할 경우 발생할 수 있는 오류를 감안할 수 없다고 판단된다.
Nam and Kim(2007)의 연구는 부산시 응 급의료서비스의 공간적 분포를 GIS를 활용하 여 살펴보았으며, Kim(2012)의 연구에서도 공공공지의 분포특성과 이용실태에 대하여 GIS를 적용하여 공간적 특성을 도출하였다.
본 연구에서도 자료수집과 분석을 연동할 수 있는 GIS를 분석에 포함하여, 서울시의 공 간구조 및 시각적 분포(Hot Spot, Cold Spot)를 토대로 보다 면밀한 유형특성 제시가 가능할 것으로 판단된다. 따라서 본 연구는 단일 역세권의 반경만을 고려하지 않고, 역세 반경별 TOD 계획요소를 250m 단위의 Buffer(최대 1,500m)로 구분수집하고, 역세
권 특성별 유형 및 도시공간에 분포한 특성을 분석하고자 한다.
자료수집 및 기초통계분석
1. 자료수집 개요
분석의 공간적 범위는 서울시로 한정하였으 며, 선정사유로는 첫째, 2012년 인구주택센서 스 자료에 따르면 서울은 인구 1000만에 가 까운 거대도시이면서, 서구의 대도시와 달리 개발밀도가 매우 높다(Sung and Oh, 2011) 는 특징이 있다. 둘째, 2011년 현재 9개의 도 시철도 노선이 운행 중에 있으며, 철도역수는 293개역, 총연장 317km에 달하는 조밀한 도 시철도망을 구축하고 있다. 특히, 도보로 접근 이 가능한 반경 500m 이내 권역은 2011년 기준 서울시 전체 면적의 38%, 반경 1000m 이내일 경우에는 전체면적의 69%를 차지하고 있다. 이러한 기준에 의한다면 서울은 철도 중심의 도시라고 표현할 수 있을 것이다. 뿐 만 아니라 서울시는 버스와 철도의 거리기반 통합요금제, 무료환승제, 실시간 대중교통 운 행정보서비스 등을 통하여 버스와 철도의 연 계체계를 잘 구축하고 있는 도시로도 알려져 있다. 따라서 본 연구는 고밀개발과 양호한 대중교통 네트워크를 갖추고 있는 서울시 역 세권을 대상으로 한다.
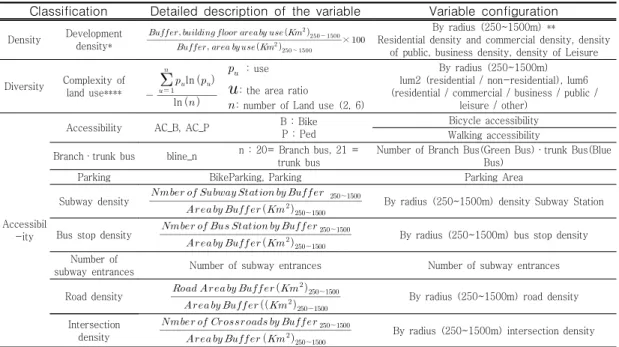
세부적인 구득 및 분석의 자료는 역세권의 물리적인 특성과 계획요소를 중심으로 분석하 기 위하여 역세권의 인구와 지가 그리고 사회 경제적변수를 제외한 TOD계획요소인 물리적 인 요소를 중심으로 한정하여 구득 분석하였 다. 구득자료는 (1) 역세권 주변 지적, 과세, 건축물대장 자료(2010년, 서울시 전산자료 활용), (2) 한국교통연구원이 구축하고 있는 국가교통 DB의 교통시설물 자료 등을 GIS에 입력하여 250m 단위의 Buffer로 수집 재정 리하였다. 관련 계획요소 산출은 개발밀도, 토 지이용 다양성, 대중교통 및 녹지 접근성을 반경별로 계량화하여 분석모형에 적용하였다.
개발밀도는 주거지를 기준으로 도시화된 면적
Classification Detailed description of the variable Variable configuration Density Development
density* ~
~
×
By radius (250~1500m) **
Residential density and commercial density, density of public, business density, density of Leisure
Diversity Complexity of
land use**** ln
ln : use
: the area ratio: number of Land use (2, 6)
By radius (250~1500m) lum2 (residential / non-residential), lum6 (residential / commercial / business / public /
leisure / other)
Accessibil -ity
Accessibility AC_B, AC_P B : Bike P : Ped
Bicycle accessibility Walking accessibility Branch·trunk bus bline_n n : 20= Branch bus, 21 =
trunk bus
Number of Branch Bus(Green Bus)·trunk Bus(Blue Bus)
Parking BikeParking, Parking Parking Area
Subway density ~
~
By radius (250~1500m) density Subway Station
Bus stop density ~
~
By radius (250~1500m) bus stop density Number of
subway entrances Number of subway entrances Number of subway entrances Road density ~
~
By radius (250~1500m) road density
Intersection
density ~
~
By radius (250~1500m) intersection density
* Density units = floor area (㎢) / urban area (㎢), ** Buffer Area = (Buffer by radius), *** Open space: rivers, mountains, parks, rivers and other public lots **** Degree of the complexity of land use = entropy index (0-1)
TABLE 1. Variables collected using GIS
대비 과세대장 상의 연상면적을 이용하였기 때문에 순 개발밀도로 정의된다. 토지이용 용 도는 과세대장의 용도분류(39개)를 주거, 상 업, 업무, 공공, 여가, 기타 등 6개로 재분류하 여 그 중 도시용도로서 중요하게 다루어지는 용도에 대한 개발밀도(순 개발밀도)를 산출하 였다. 순개발밀도는 산, 하천, 강, 공원 등 오 픈스페이스 면적을 제외한 면적 대비 용도별 건축물 연상면적으로 산출하였다.
토지이용 다양성에 관한 지표는 LUM (Land Use Mix, LUM) 지수를 이용하여 산 출하였다. 이 지수는 Frank and Pivo(1994) 가 GIS 기반 토지이용 자료를 활용하여 개발 한 것(Cerin et al., 2007)으로, 0~1의 범위 를 가지고 있으며, 1에 가까울수록 토지이용 의 복합정도가 높음을 의미한다. 이 지수는 토지이용의 다양성을 평가하기 위한 지표로 자주 적용되어왔다(예: Frank et al., 2005;
Sung et al., 2006; Cerin et al., 2007;
Sung and Choo, 2010). 그러나 이 용도는
용도별 복합비율만을 제시할 뿐 용도의 세부 적인 복합수준, 즉 강도를 파악하기 어려운 점 때문에 비판(Krizek, 2003; Cerin et al., 2007)받아왔다. 이러한 단점을 극복하기 위 하여 기존 연구(Schlossberg et al., 2003) 접근과 유사하게, 본 연구에서는 LUM 지수는 토지이용의 복합용도를 6개용도, 2개용도(주 거-비주거)로 분류하여 용도별 복합정도를 파악할 수 있도록 지표를 세분화하였다. 그러 한 세분화된 복합도는 반경별로 산출하였다.
한편, 대중교통 접근성은 역세권의 보행 및 자전거 접근성, 주차장, 연계버스의 지·간선 비율을 사용하고 도시화면적 대비 버스정류장 수와 철도역수, 도로면적, 교차로 수의 접근성 지표 또한 반경별로 산출하였다(표 1).
2. 역세권 영역별 변화추이 분석결과
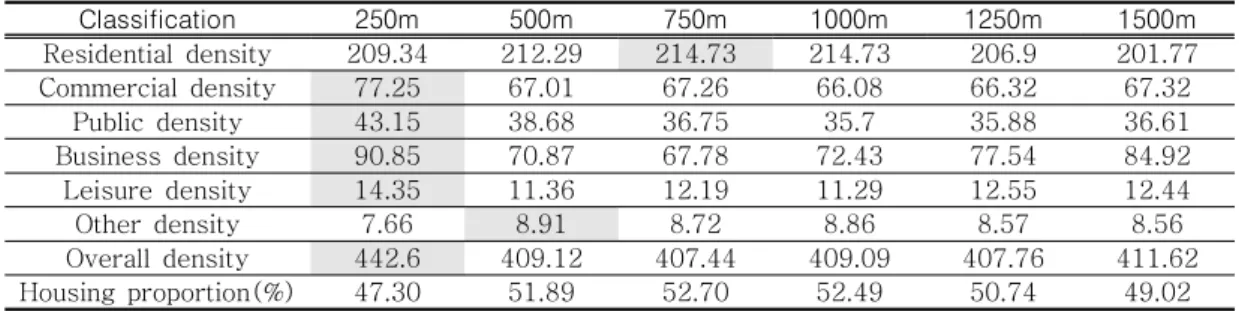
요인분석을 수행하기 전 반경과 용도를 중 심으로 개발밀도의 패턴을 살펴보았다(표 2).
역세권 전체개발밀도 중 가장 높은 구간은
Classification 250m 500m 750m 1000m 1250m 1500m
Residential density 209.34 212.29 214.73 214.73 206.9 201.77
Commercial density 77.25 67.01 67.26 66.08 66.32 67.32
Public density 43.15 38.68 36.75 35.7 35.88 36.61
Business density 90.85 70.87 67.78 72.43 77.54 84.92
Leisure density 14.35 11.36 12.19 11.29 12.55 12.44
Other density 7.66 8.91 8.72 8.86 8.57 8.56
Overall density 442.6 409.12 407.44 409.09 407.76 411.62
Housing proportion(%) 47.30 51.89 52.70 52.49 50.74 49.02
TABLE 2. Development density by radius 250m 이내의 구간으로 나타났으며, 그 밀도 는 442.60%이다. 250~1250m 구간의 전체 밀도는 407.44~409.12%로 거의 비슷하다 가 1250m를 넘어서면서 약간(411.62%)로 높아지는 것으로 분석되었다. 가장 높은 주거 구성비는 52.70%로 750m를 중심으로 대칭 형태를 보이는 것으로 나타났다.
용도별 개발밀도의 변화 중 가장 높은 지점 을 반경별로 살펴보면, 주거는 500~750m 구 간이 가장 밀도가 높았고, 상업, 공공, 여가는 0~250m 구간이, 그리고 업무는 1250~
1500m 구간이 가장 높은 것으로 분석되었다.
주거를 제외하고는 역세권 가장 인접지역 (250m)에 개발밀도가 집중된 것을 알 수 있 다. 이러한 현상은 주거의 경우 역세권으로부 터 750~1000m가 가장 높아 비주거시설과의 거리를 두고 개발이 집중된 것으로 판단된다.
FIGURE 1. Comparison of complex land use by radius
토지이용 다양성(LUM)을 분석한 결과는 역세권에서 멀어질수록 증가하며, 용도조합별 로 값이 다르게 나타나는 것을 볼 수 있다(그 림 1). 다만, 주거, 상업, 업무, 공공, 여가, 기 타의 전체복합도는 주거/비주거 복합도에 비 해 이 낮게 나타났고, 1250m를 기점으로 낮 아지는 것을 알 수 있다.
FIGURE 2. Comparison of public transport access by radius
대중교통 접근성은 버스정류장과 지하철역 수에 대한 밀도로 산출하였다. 지하철역과 버 스정류장에 대한 접근성의 경우 반경 500m를 전후하여 접근성 변화가 있는 것으로 나타났 다(그림 2). 버스정류장 접근성은 500m이후 에 낮아지며, 지하철의 경우 500m이후에 다 소 높아지다가 1250m에서 다시 낮아지는 결 과를 보이고 있어 대중교통 접근성이 수단별 로 차이가 있음을 보여주고 있다.
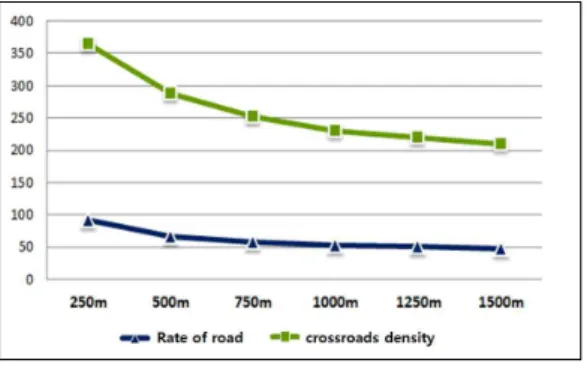
FIGURE 3. Comparison of access to roads and cross roads by radius 가로망 체계는 반경별로 도로면적과 교차로 수에 대한 밀도로 산출하였다. 도로율와 교차 로밀도는 500m를 전후로 변화가 있는 것으로 나타났다. 도로율의 경우 750m이후에 접근성 감소에 대한 변화가 작아지며, 교차로밀도 경 우 500m이후에 접근성 감소에 대한 변화가 작아지는 것으로 나타났다(그림 3).
역 특성별 유형분류 및 특성별 분포
1. 요인분석의 적합도 검증결과
토지이용과 대중교통 접근성에 대한 역세권 의 물리적 환경을 중심으로 요인분석(Factor Analysis)한 결과, 전체 Kaiser-Meyer -Olkin(KMO)는 0.858로 KMO의 표본적합 도인 MSA(measure of sampling adequacy)가 꽤 높은 편인 값(meritorious) 을 보여주고 있어, 분석에 사용된 자료가 요 인분석에 적합함을 시사한다. 요인분석결과의 신뢰성 분석방법 중의 하나인 Cronbach's Alpha의 신뢰계수(reliability coefficient)가 0.0223로 0에 가까운 값을 보이고 있고, 회 전된 요인간의 상관성이 거의 없음을 신뢰할 수 있다고 볼 수 있다. 요인분석 결과를 통하 여 볼 때, 압축되어지는 요인의 수는 7개가 적정한 것으로 판단된다. 요인이 수를 7개로 한정한 경우, 요인 7의 eigenvalue는 1.998 이며, 누적분산은 78.22%이다(표 3).
Factor Eigenvalue Proportion Cumulative
1 20.432 28.378 28.378
2 10.502 14.587 42.964
3 7.004 11.728 54.692
4 5.358 7.442 62.134
5 4.075 7.048 69.182
6 2.689 5.124 74.305
7 1.398 2.914 78.220
8 1.708 2.511 79.730
9 1.592 2.489 82.220
10 1.296 2.077 84.297
... ... ... ...
Statistics
Cronbach's Alpha 0.0221
Overall KMO 0.858
LR-Test Chi2 30884.861
Prob > Chi2 0.000 TABLE 3. The Goodness-of-fit of factor
analysis
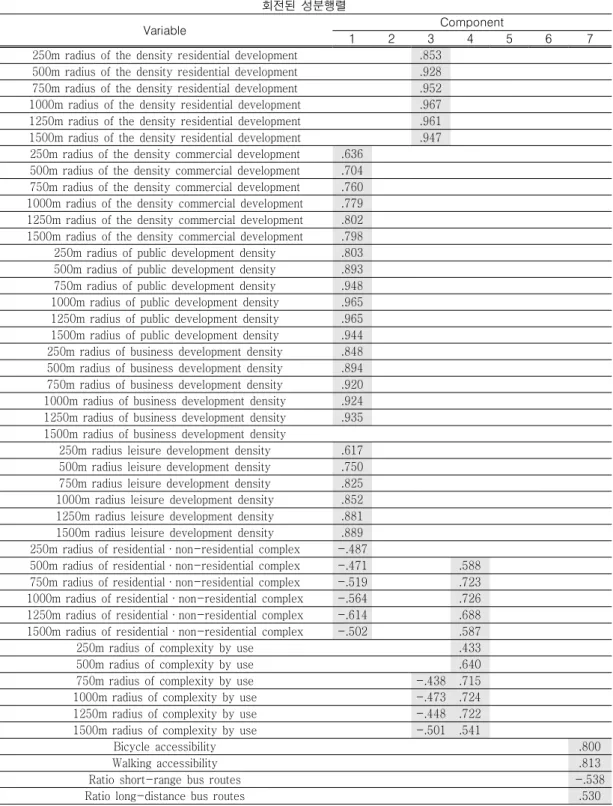
2. 역세권 반경별 요인명 결정 및 영향요인 회전된 요인행렬(rotated factor matrix)로 0.5이상의 요인득점(factor scores) 결과를 선형조합으로 요약하면 표 4와 같다.
표 5는 요인들에 대한 특성을 토대로 역세 권의 유형결정에 영향을 주는 요인을 명명한 종합표이다. 종합된 표를 참고로 살펴보면, 압 축된 7개의 요인이 매우 다양하게 나타난 것 을 알 수 있다.
특히, Factor1, 3, 4는 토지이용특성이 강하 게 나타난 반면, Factor5∼7은 교통특성에 영 향을 받는 것으로 나타났다. 다음으로 Factor2 는 설계특성에 영향을 받는 것을 알 수 있다.
결과적으로 복합적인 특성을 가지기 보다는 역 세권의 유형이 다양하게 나타나며, 각 특성들이 개별적으로 영향을 주고 있는 것을 알 수 있다.
3. 역세권의 공간적 분포특성(GIS 활용) 요인분석을 통해 도출된 역세권의 특성을 바탕으로 서울시 역세권 특성별 분포를 알아 보기 위해 다음의 작업을 수행하였다. 첫째, 각 역세권 특성별로 도출된 Factor별 요인점 수를 DB로 정리하여 서울시 지하철 레이어의
회전된 성분행렬
Variable Component
1 2 3 4 5 6 7
250m radius of the density residential development .853 500m radius of the density residential development .928 750m radius of the density residential development .952 1000m radius of the density residential development .967 1250m radius of the density residential development .961 1500m radius of the density residential development .947 250m radius of the density commercial development .636
500m radius of the density commercial development .704 750m radius of the density commercial development .760 1000m radius of the density commercial development .779 1250m radius of the density commercial development .802 1500m radius of the density commercial development .798 250m radius of public development density .803 500m radius of public development density .893 750m radius of public development density .948 1000m radius of public development density .965 1250m radius of public development density .965 1500m radius of public development density .944 250m radius of business development density .848 500m radius of business development density .894 750m radius of business development density .920 1000m radius of business development density .924 1250m radius of business development density .935 1500m radius of business development density
250m radius leisure development density .617 500m radius leisure development density .750 750m radius leisure development density .825 1000m radius leisure development density .852 1250m radius leisure development density .881 1500m radius leisure development density .889 250m radius of residential·non-residential complex -.487
500m radius of residential·non-residential complex -.471 .588 750m radius of residential·non-residential complex -.519 .723 1000m radius of residential·non-residential complex -.564 .726 1250m radius of residential·non-residential complex -.614 .688 1500m radius of residential·non-residential complex -.502 .587
250m radius of complexity by use .433
500m radius of complexity by use .640
750m radius of complexity by use -.438 .715
1000m radius of complexity by use -.473 .724
1250m radius of complexity by use -.448 .722
1500m radius of complexity by use -.501 .541
Bicycle accessibility .800
Walking accessibility .813
Ratio short-range bus routes -.538
Ratio long-distance bus routes .530
TABLE 4. Factor scores using component scores
Bicycle parking density Car parking density
250m radius of the density subway station 500m radius of the density subway station
750m radius of the density subway station .749
1000m radius of the density subway station .687
1250m radius of the density subway station .674
1500m radius of the density subway station .649
250m radius of the density bus station .596
500m radius of the density bus station .794
750m radius of the density bus station .855
1000m radius of the density bus station .869
1250m radius of the density bus station .852
1500m radius of the density bus station .819
250m radius rate of road .752
500m radius rate of road .879
750m radius rate of road .879
1000m radius rate of road .869
1250m radius rate of road .853
1500m radius rate of road .817
250m radius of crossroads density .860 500m radius of crossroads density .921 750m radius of crossroads density .953 1000m radius of crossroads density .957 1250m radius of crossroads density .940 1500m radius of crossroads density .911 TABLE 4. Continued
Factor Interpretation
Factor1
(High density - commercial business factors)
Station area within a radius 1500m high density residential development of others, Lum2 (other residential land use composition) characteristics with
low Factor2
(Small-scale block factors)
Station area within a radius 1500m road / crossroads density increased vehicle accessibility is good, Small Block
Factor3
(Residential density factor)
Station area within a radius 1500m high residential density, radius 500 ~ 1500m in the Station area lum6 (residential, commercial, business, public,
leisure, etc.) characteristic of a low-complexity Factor4
(Development of complex factors)
Station area within 1500m radius combined with a high degree of land use characteristics
Factor5
(Associated transportation factors) Station area within a radius 1500m high properties of bus stop accessibility Factor6
(Other station adjacent factors )
Railway Station area within a radius 500 ~ 1500m high accessibility characteristic
Factor7 (BRT mixed factors)
Station area of the bike's accessibility is high, and the low ratio of short-range bus routes with high long-distance bus routes characteristic
ratio TABLE 5. Factors influencing subway station area
Factor Subway station areas characteristic of a strong factor
Factor1
City Holll, Myeong-dong, Gwanghwamun, Jongno 1-ga, Seoul station, Gyeongbokgung, Jongno 3-ga, Seodaemun, Chungmuro, Chungjeongro, Ganbyon, Jongno 5-ga, Samgakzi, Tokyo University entrance, sinyongsan , Yongsan, Hyehwa, Dongdaemun, Konkuk University entrance, Ward, sukdae
entrance, Namyoung, dongmyoap
Factor2
Hongik University entrance, yeokchon, Daelim, new idea, reunions, nursing, telephoto, dolgot two, peg, sinyimun, Sillim, Seoul, kkachisan, Ahyun, Chungjeongro, Bongcheon, Mia, bulgwang, Cheonho, ISU, Mia intersection, seokgye,sinzung, Hwagok, sindang, Singil, Sindaebang intersection, Sindaebang,
Boramae, schoolchildren, Sinseol, Taereung entrance, men, constants, Kang Dong, Guro Digital, aeohgae, Konkuk University, Dapsimni, Gunja, ssangmun, sindap, Nam-guro, the Cheongnyangni,
gwangheungchang, sangwolgok, jegidong, sadang jangseungbaegi,
Factor3
Seobinggo, gangbyeon, Ttukseom Resort, nokcheon, Ichon, Junggye, Vertigogae, gileum, mangu, Chang-dong, Hagye, Oksu, madeul, Konkuk University, Wolgok, seokgye, Sungshin Women's Univ,
Eungbong, Yaksu, Singeumho, Han Sung University, Taereung entrance, suraksan, sindap, Majang, Sangbong, Hangangjin, Korea University, Mia intersection, sangwolgok, Wangsimni, Yongmasan, Dobong, Samgakji, Meokgol, sinyimun, sangwangsipri, sinyongsan, Yongsan, Cheonggu, Yongdap,
Junggok, Changsin, Cheongnyangni, Junghwa, Namyoung, Hanyang University
Factor4
Children's Grand Park, Konkuk University entrance, Yongsan, Seongsu, Gangbyeon, Namyoung, sinyongsan, Dongguk Univ, Samgakji, Yongdap, sindap, Janghanpyeong, Hyehwa, Singil, Cheongnyangni, Mongchontoseong, Yangpyung, Anam, Cheonggu, jegidong, Sports Complex , Seolleung, Mapo, Changsin, Sinseol, Yeongdeungpo Market, munrae, noksapyeong, Guro,
Sookmyung Women's Univ., Guui, Hyochang Park
Factor5
Gongneung, Taereung entrance, Junggye, Cheongnyangni, Nowon, City Hall, Yangcheon-gu Office , Seokgye, Sinpung, Seoul, Myeonmok, Hyochang Park, Wolgye, jegidong, hanti, mangu, dorimcheon, Kowloon, meokgol Euljiro 1-ga, Daechi, Gangnam, Jongno 5-ga, Chang-dong, Shindorim, Dogok, munrae, Maebong, Gongdeok, Gwanghwamun, Jeungsan, Jongno 3-ga, Sangbong,
Guro, Garak Market
Factor6 Dongdaemun, Cheonggu, UNDP, the Jongno 5, dongmyo, Euljiro 3-ga, Euljiro 4-ga, Chungmuro, Yaksu, Jongno 3-ga, singeumho, Changsin, Hanyang University, Wangsimni, Haengdang
Factor7
Woojangsan, Gimpo Airport, Euljiro 1-ga, Wolgok, Hannam, Euljiro 4ga, Sindaebang intersection, yongmasan, Gangbyeon, sinyimun, Euljiro 4ga, sinyongsan, Oksu, World Cup Stadium, ssangmun, Nowongyo, Sinjeong, Hyehwa, banpo, Dapsimni, Dongjak, Sinpung, Shinchon, Shindorim, noksapyeong,
Naebang, Nonhyeon, Nokbeon, Sillim, Guro, Dongdaemun, Namguro, Dangsan, yeokchon, Sindang TABLE 6. Characteristics of the subway station by factor
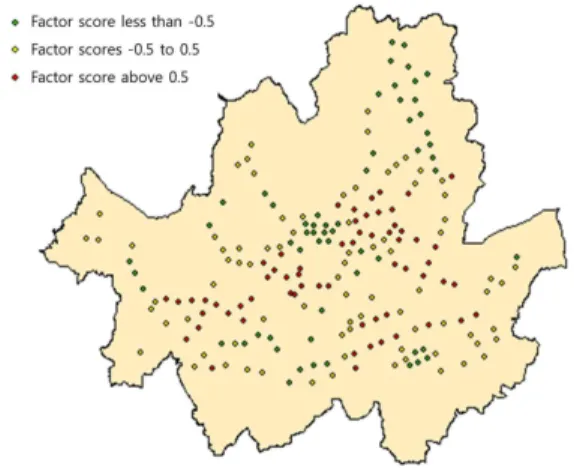
속성에 join 작업을 통하여 연동시켰다. 둘째, 특성별 요인점수가 0.5이상인 역세권, 0.5∼
-0.5인 역세권, -0.5이하인 역세권으로 단계 구분 하였다. 셋째, 구분된 단계를 특성별로 GIS상에 나타내었다. 여기서 요인점수가 0.5 이사인 역세권은 해당 특성에 속하는 역세권 이라 할 수 있으며 –0.5 이하인 역은 해당 특 성에 반하는 역세권이라 해석할 수 있다.
Factor1∼7까지의 특성에 해당하는 역세권은 표 6에서 정리하였다.
표 4의 요인점수를 활용하여 서울시 도시철 도 역세권을 ArcGIS에서 시각화하여 표현하
였다. FIGURE 4. Distribution of high
density-commercial business factors
Factor1은 고밀화된 상업, 업무집중 역세권 으로 서울시의 심장부인 종로를 중심으로 분 포된 것으로 나타났다(그림 4).
FIGURE 5. Distribution of small-scale block factors
Factor2는 소규모 획지집중 역세권 역세권 으로 도로/교차로 밀도가 높아 차량접근성이 좋으며, 블록규모가 작은 특성을 가진 역세권 으로 서울 외곽지역과 주요 도로에 분포된 것 으로 나타났다(그림 5).
FIGURE 6. Distribution of residential density factor
Factor3은 주거 밀집 집중 역세권 역세권 으로 반경 1500m 이내 주거 밀도가 높고, 역 세권 반경 500~1500m 이내에 lum6(비주
거)의 복합도가 낮은 특성을 가진 역세권이다.
주거 밀집 집중 역세권은 서울의 중심에서부 터 동북권역으로 퍼져서 위치해 있음을 알 수 있다(그림 6).
FIGURE 7. Distribution of development of complex factors
Factor4는 복합 개발집중 역세권 역세권으 로 반경 1500m 이내 토지이용의 복합도가 높은 특성을 가진 역세권이다. 복합개발집중 역세권 역세권은 주로 한강을 중심으로 동서 방향으로 위치해있음을 알 수 있다(그림 7).
FIGURE 8. Distribution of associated transportation factors Factor5는 연계수단집중 역세권 역세권으 로 반경 1500m 이내 버스정류장의 접근성이
높은 특성을 가진 역세권이다. 이 연계수단집 중 역세권은 버스노선이 뻗어나가는 중심에 서 동북, 동남, 서남의 축을 따라 분포되어있 음을 알 수 있다. 이 분포특성을 살펴보면 상 대적으로 서북축의 버스노선이 부족함을 알 수 있다(그림 8).
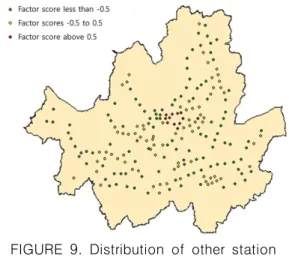
FIGURE 9. Distribution of other station adjacent factors
Factor6은 타역인접 집중 역세권은 반경 500~1500m 이내 철도접근성이 높은 특성을 가진 역세권으로 역들이 서로 인접해 있는 역 세권 들은 서울의 최중심부에 집중되어 있는 것으로 나타났다. 이는 유동인구의 밀도와 관 련된 것으로 보인다(그림 9).
FIGURE 10. Distribution of BRT mixed factors
Factor7은 BRT혼합 집중 역세권으로 장거 리버스노선 비율과 저전거의 접근성이 높고, 단거리 버스노선 비율이 낮은 특성이다. 이는 지하철역이 존재하고, 장거리 이동 버스 (Red, Blue) 노선 및 정류장 기반시설이 구 축되어있던 역세권으로 보인다. BRT혼합형 역세권의 분포는 지선버스의 주요 축으로 앞 서 언급한 연계수단형 역세권과 동일한 형태 로 분포하고 있으며, 서북축의 연결성이 부족 함을 알 수 있다(그림 10).
결 론
본 연구는 서울시 도시철도 역세권을 중심 으로 역세권의 물리적 특성을 포함하는 대표 적인 TOD계획요소에 대한 유형 특성을 도출 하고자 요인분석을 실시하였다. 분석된 요인 분석결과를 중심으로 역세권의 특성을 명명하 고, 이를 GIS와 연계하여 공간적 분포를 확인 하였다.
본 연구의 주요 연구결과를 살펴보면 첫째, 역세권의 물리적 환경을 대변하는 TOD 계획 요소는 도시부문 특성(개발밀도, 토지이용복 합도)과 교통부문(대중교통 접근성), 연계교 통수단 등으로 명확히 구분되는 것으로 나타 났다. 다시 말하면, 개발밀도와 토지이용의 다 양성(lum)은 상호 조합되어 특성이 유형화됨 에 비하여 대중교통 접근성, 연계교통수단 등 은 토지이용과 별개의 특성으로 나타나고 있 음을 확인할 수 있었다. 이는 역세권의 물리 적 환경을 대변하는 TOD계획요소 중 도시부 문 특성이 강한 역세권은 자연 발생적인 주거 지역을 주변으로 밀도와 복합도가 높은 반면, 환승을 중심으로 상대적으로 늦게 개발된 역 세권은 교통적요인의 특성이 집중되어있음을 추론할 수 있다. 요인분석결과를 보다 세분화 하여 살펴보면, Factor1, 3, 4는 토지이용특 성이 강하게 영향을 받으며, Factor5∼7은 교 통특성에 영향을 받는 것으로 나타났다. 다음 으로 Factor2는 설계특성이 역세권 주변의
연계교통수단의 주차규모에 영향을 받는 것을 알 수 있었다. 둘째, 역세권의 유형에 대한 유 형을 명명하면, 고밀-상업, 업무형(Factor1), 소규모획지형(Factor2), 주거밀집형(Factor3), 복합개발형(Factor4), 연계수단형(Factor5), 타역인접형(Factor6), BRT혼합형(Factor7) 으로 총 7개 유형에 영향을 받고 있는 것으로 나타났다. 셋째, 역세권의 영향요인 및 유형별 로 공간분포 특성을 살펴보면, BRT혼합형 (Factor7)의 경우는 서울의 중심부에서 외곽 으로 분포하는 도로 부분을 중심으로 발달해 있으며, 상대적으로 취약한 역세권도 확인 가 능하였다.
본 연구는 각 역세권 공간적 특성 및 영향 요인을 확인가능하고, GIS와 연동 가능하므로 도시 및 교통관련 정책입안자들에게 역세권의 개발 계획 수립시 기초자료로 제시될 수 있을 것이다.
본 연구는 서울의 역세권 내부의 공간적 특 성을 연구하기 위하여 연구의 범위를 서울로 한정하였으나, 향후에는 서울의 인접한 지하 철역세권의 특성을 포함하여 수도권의 전반적 인 역세권 특성에 대한 연구가 필요하다고 판 단된다.
주
1) 본 연구에서 자료의 수집에서 사용된 Buffer 분석은 편의상 직선거리의 버퍼링 (euclidean distance based buffering) 을 사용했다.
참고문헌
Bang, S.S. and H.B. Kim. 2003. A study on the effect of strengthened development density toward roads in development density management area.
Journal of Korea Planners Association 38(3):175-186 (방수석, 김형복. 2003.
개발밀도관리구역 지정에 의한 개발밀도의 변화가 도로 시설에 미치는 영향에 관한 연 구. 국토계획 38(3):175-186).
Cerin, E., E. Leslie, L. du Toit, N. Owen and L.D. Frank. 2007. Destinations that matter: associations with walking for transport. Health and Place 13:713- 724.
Cervero, R. 1988. Land use mixing and suburban mobility. Transportation Quarterly 42(3):429-446.
Ewing, R. 1995. Beyond density, mode choice, and single purpose trips.
Transportation Quarterly 49:15-24.
Frank, L.D. and G. Pivo. 1994. Impacts of mixed use and density on utilization of three modes of travel: single-occupant vehicle, transit, and walking.
Transportation Research Record 1466:
44-52.
Frank, L.D., L.T. Schmid, J.F. Sallis, J.
Chapman, and B.E. Saelens. 2005.
Linking objectively measured physical activity with objectively measured urban form. American Journal of Preventive Medicine 22:117-125.
Gordon, P. and H. Richardson. 1997. Are compact city a desirable planning goal?
Journal of the American Planning Association 63(1):95-106.
Hwang, K.Y. S.Y. Shin and J.M. Kang.
2006. Estimating development density constrained by traffic congestion in the downtown, Seoul. Journal of the Korean Society of Civil Engineers 26(1):49-58 (황기연, 신상영, 강준모. 2006. 교통혼잡을 고려한 서울 도심부 개발가능 밀도 추정. 대 한토목학회논문집 26(1):49-58).
Hwang, K.Y. and Y.H. Cho. 2005.
Evaluating the traffic impacts of high-density development in the downtown of Seoul. Journal of Korea Planners Association 40(3):91-105 (황 기연, 조용학. 2005. 도심고밀개발 전략의 교통영향분석. 국토계획 40(3):91-105).
Kim, C.H. 2007. Study on compact city model for sustainable new town development in Korea. Urban Research 42(2):49-68 (김찬호. 2007. 지속가능한 신도시 개발을 위한 한국형 압축도시모형 정 립에 관한 연구. 도시연구 42(2):49-68).
Kim, D.N. 2006. Making the old city center good city utilizing collaboration of district unit planning and architecture. Architecture and Social 3:206-212 (김도년. 2006.“구(舊)도심”
다시 가꾸기 : 서울 강북 도심에서 지구단 위계획과 도시건축의 융합. 건축과 사회.
3:206-212).
Kim, G.S. 2012. A study on the distributional characteristics and the actual use condition of public open spaces. The Korean Association of Geographic Information Studies 15(2):
12-22 (김경수. 2012. 공공공지 분포특성 과 이용실태에 관한 연구. 한국지리정보학회 지 15(2):12-22).
Kong, B.Z. 2006. A study on estimating development density by roadway ratio in development density management area. Master's Thesis. Chung-Ang University (공범진. 2006. 개발밀도관리구 역 내 도로율에 의한 개발가능밀도 산정에 관한 연구. 중앙대학교 대학원 석사학위논 문).
Krizek, K. 2003. Residential relocation
and changes in urban travel: does neighborhood-scale urban form matter?.
Journal of the American Planning Association 69:265-281.
Lee, C. and A.V. Moudon. 2006. The 3Ds+R: quantifying land use and urban form correlates of walking.
Transportation Research Part D(11):204 -215.
Moon, Y.L. and J.H. Rho. 2012. A development of public transportation demand model on Seoul subway station area using structure equation modeling.
Journal of Korea Planners Association 47(1):149-160 (문영일, 노정현. 2012.
구조방정식을 활용한 서울시 도시철도역세권 의 대중교통 이용수요 인과관계 모형개발.
국토계획 47(1):149-160).
Moudon, A.V., C. Lee, A.D. Cheadle, C.
Garvin, D. Johnson, T.L. Schmid, R.D.
Weathers and L. Lin. 2006. Operational definitions of walkable neighborhood:
theoretical and empirical insights.
Journal of Physical Activity and Health 3(1):99-117.
Nam, K.W. and J.G. Kim. 2007. Temporal and spatial distributions of emergency medical services: Busan. Journal of the Korean Association of Geographic Information Studies 10(1):113-123 (남 광우, 김정건. 2007. 부산시 응급의료서비스 의 시공간적 분포특성. 한국지리정보학회지 10(1):113-123).
Oh, Y.T., T.H. Kim, J.J. Park and J.H.
Rho. An empirical analysis of influencing factors toward public transportation demand considering Seoul subway area by land use type. Journal of the Korean Society of Civil
Engineers 29(4):467-472 (오영택, 김태 호, 박제진, 노정현. 2009. 토지이용유형별 서울시 역세권 대중교통 이용수요 영향인자 실증분석. 대한토목학회지 29(4):
467-472).
Schlossberg M. and N. Brown. 2003.
Comparing transit oriented developments based on walkability Indicators. Transportation Research Board: Transportation Research Board of the National Academies 1887(5) :34-42.
Sung, H.G. J.H. Rho. T.H. Kim and J.H.
Park. 2006. A study on the effects of land use on travel pattern in the rail station areas of a dense city: a case of Seoul. Journal of Korea Planners Association 41(4):59-75 (성현곤, 노정 현, 김태현, 박지형. 2006. 고밀도시에서의 토지이용이 통행패턴에 미치는 영향 : 서울시 역세권을 중심으로. 국토계획 41(4):59- 75).
Sung, H.G. and J.T. Oh. 2011.
Transit-oriented development in a high-density city: Identifying its association with transit ridership in Seoul, Korea. Cities 28(1):70-82.
Sung, H.G. and S.H. Choo. 2010. The effects of compact-city development at the living area of neighborhood level on modal split and self-sufficiency. Journal of Korea Planners Association 45(1):
155-169 (성현곤, 추상호. 2010. 근린생활 권 단위의 압축도시개발이 통행수단분담율과 자족성에 미치는 효과분석. 국토계획 45(1):
155-169).
Sung, H.G. and Y.J. Kwon. 2006. Impacts of firms' relocation to the Kangnam station area on residential relocation and commuting behavior of the employees. Journal of Korea Planners Association 41(4):41-58 (성현곤, 권영 종. 2006. 고용입지변화에 따른 주거입지 및 통근통행의 변화에 관한 연구 : 강남역세권 을 중심으로. 국토계획 41(4):41-58).
Transit Cooperative Research Program.
2004. Transit-Oriented Development in the United States : Experiences, Challenges, and Prospects. TCRP Report.
Wendell Cox and Joshua Utt. 2004. The Costs of Sprawl Reconsidered: What the Data Really Show, Backgrounder 1770, The Heritage Foundation (www.heritage.
org).
Yun, J.M. and K.C. Seo. 2010. Deriving the declining areas and analysing their spatial characteristics using the spatial autocorrelation measure. The Korean Association of Geographic Information Studies 13(3):64-73 (윤정미, 서경천.
2010. 쇠퇴지역 도출 및 공간특성 분석에 관한 연구. 한국지리정보학회지 13(3):64- 73).