국내 유통 농산물 중 잔류농약 모니터링
도정아1․이희정2․신용운2․최원조2․채갑용2․강찬순2․김우성2†
1식품의약품안전청 식품의약품안전평가원
2부산지방식품의약품안전청 시험분석센터
Monitoring of Pesticide Residues in Domestic Agricultural Products
Jung Ah Do1, Hee Jung Lee2, Yong Woon Shin2, Won Jo Choe2, Kab Ryong Chae2, Kang Chan Soon2, and Woo Seong Kim2†
1
National Institute of Food and Drug Safety Evaluation, Korea Food & Drug Administration, Seoul 122-704, Korea
2
Test & Analytical Laboratory, Busan Regional Food & Drug Administration, Busan 608-829, Korea
Abstract
In 2008, we monitored residual pesticides of 15 agricultural products such as rice, corn, pea, chestnut, mandarin, lemon, onion, pineapple, lettuce, chard, sweet potato stalk, burdock, squash, sweet pepper and mushroom.
Agricultural commodities were collected from markets in 22 provinces (Seoul, Busan, Incheon, Daegu, Ulsan, Daejeon, Gwangju, Wonju, Pohang, Gumi, Changwon, Gimhae, Suwon, Seongnam, Bucheon, Goyang, Yongin, Cheongju, Cheonan, Jeonju, Yeosu, and Jeju). Total 48 pesticides were analysed by multi-residue method using GC/MS/MS. We analysed 1,064 samples and 34 samples (3.20%) were detected. Sweet potatostalk, burdock, chestnuts, peas, corn, chard, squash, mushroom and onions were found to be free from pesticide residues. 6 other agricultural products did not exceed MRLs (Maximum Residue Limits) by the Korean Food Code.
Chloropyrifos and fenobucarb were particularly prevalent and also they were detected over 10 times in this monitoring. Nonetheless, the exposed quantity of the 7 residual pesticides is to be considered relatively safe, compared with the acceptable daily intake (ADI) of residual pesticides.
Key words: monitoring, agricultural products, pesticide residue, food safety
†Corresponding author. E-mail: [email protected]
†Phone: 82-51-610-6140, Fax: 82-51-610-6159
서 론
농약은 현대농업에 있어서 농산물의 증산 및 품질 향상을 위한 필수영농자재로서 매우 중요한 역할을 하고 있다. 그리 고 농약은 병해충과 잡초방제 등의 사용목적을 달성한 후 환 경에서 분해되어 잔류하지 않는 것이 가장 이상적이다. 그러 나 농약은 대부분 유기합성물질로서 극히 일부는 신속하게 분해되기도 하지만 대부분은 자체의 물리화학적 특성에 따 라 농산물 및 토양에 잔류하게 된다(1). 또한, 도시민의 농약 독성에 대한 인지도 조사 결과 농민이 농약을 과다하게 사용 하며 농작물에 농약이 잔류하여 만성독성을 유발시키거나 암의 원인이 된다고 생각하는 것으로 나타났다(2). 따라서 시 중에 유통되는 농산물에서 잔류농약이 기준량을 초과하여 검출된다면 국내소비는 물론 외국에서도 우리 농산물을 사 먹지 않게 되어 우리 농업인에게 직접적으로 큰 피해가 돌아 오게 되므로 식약청에서는 국내 유통 농산물 중 잔류농약 모니터링을 실시하여 농산물의 안전성을 홍보하고 등록된 농약을 안전사용기준에 따라 살포하도록 지도하고 있다(3).
우리나라의 잔류농약 모니터링 사업은 1968년부터 실시 해왔는데 2001년부터는 지속적인 잔류실태파악으로 정책에 반영하고 있다. 모니터링 결과를 살펴보면 2001년에는 농산 물 25종류, 600건에서 12.2%의 검출률과 0.83%의 부적합률 (4), 2002년에는 농산물 35종류, 70건에서 8.8% 검출률을 나 타내었다(5). 2003년에는 25종류의 농산물 600건에서 검출 률 16.8%, 부적합율 1.2%(6), 2004년에는 31종류의 농산물 900건에서 11.8%의 검출률을 보였으며, 부적합율은 3.2%였 다(7). 2005년에는 32종 농산물 794건에서 5.0%의 검출률, 1.6%의 부적합율(8), 2006년에는 22종의 농산물 919건에서 27.3% 검출률과 2.7%의 부적합이 나타났다(9). 2007년에도 26종의 농산물 1,023건에서 24.7%의 검출률과 2.1%의 부적 합률을 나타내었다(10). 2006년 이후부터 검출률이 20% 이 상으로 급격히 증가한 것은 GC/MS/MS를 이용한 분석기기 의 감도 향상에 기인된 것으로 판단된다. 농산물 중 잔류농 약 분석법은 허용기준에의 적합여부를 신속하게 확인하기 위해서 신속 정확하고 정밀한 분석방법이 필수적인데 대부 분 다종다성분 분석법을(11-14) 많이 이용하고 있으며 다양
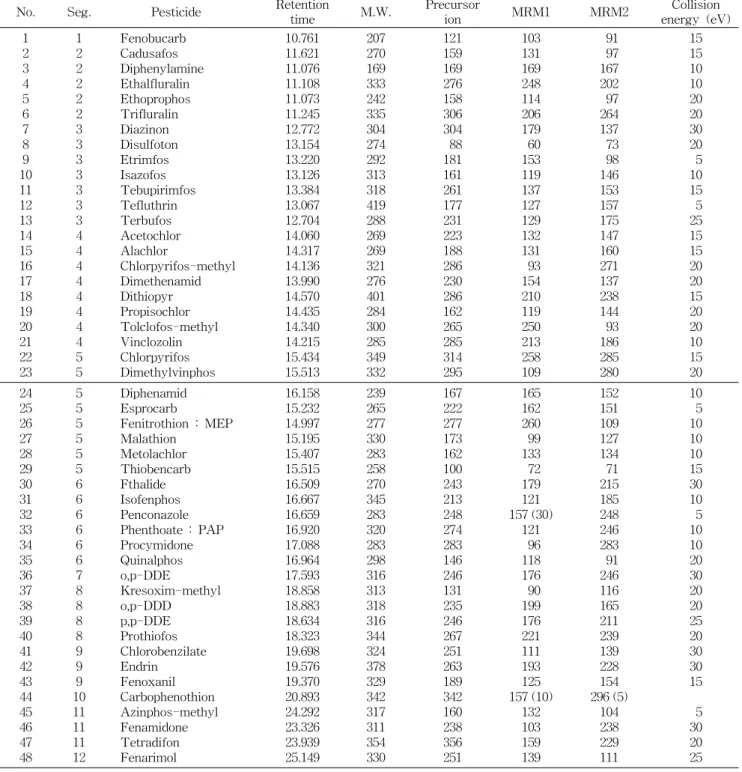
Table 1. Analytical conditions of the MRM transition of GC/MS/MS No. Seg. Pesticide Retention
time M.W. Precursor
ion MRM1 MRM2 Collision
energy (eV) 1
2 3 4 5 6 7 8 9 10 11 12 13 14 15 16 17 18 19 20 21 22 23
1 2 2 2 2 2 3 3 3 3 3 3 3 4 4 4 4 4 4 4 4 5 5
Fenobucarb Cadusafos Diphenylamine Ethalfluralin Ethoprophos Trifluralin Diazinon Disulfoton Etrimfos Isazofos Tebupirimfos Tefluthrin Terbufos Acetochlor Alachlor
Chlorpyrifos-methyl Dimethenamid Dithiopyr Propisochlor Tolclofos-methyl Vinclozolin Chlorpyrifos Dimethylvinphos
10.761 11.621 11.076 11.108 11.073 11.245 12.772 13.154 13.220 13.126 13.384 13.067 12.704 14.060 14.317 14.136 13.990 14.570 14.435 14.340 14.215 15.434 15.513
207 270 169 333 242 335 304 274 292 313 318 419 288 269 269 321 276 401 284 300 285 349 332
121 159 169 276 158 306 304 88 181 161 261 177 231 223 188 286 230 286 162 265 285 314 295
103 131 169 248 114 206 179 60 153 119 137 127 129 132 131 93 154 210 119 250 213 258 109
91 97 167 202 97 264 137 73 98 146 153 157 175 147 160 271 137 238 144 93 186 285 280
15 15 10 10 20 20 30 20 5 10 15 5 25 15 15 20 20 15 20 20 10 15 20 24
25 26 27 28 29 30 31 32 33 34 35 36 37 38 39 40 41 42 43 44 45 46 47 48
5 5 5 5 5 5 6 6 6 6 6 6 7 8 8 8 8 9 9 9 10 11 11 11 12
Diphenamid Esprocarb
Fenitrothion : MEP Malathion
Metolachlor Thiobencarb Fthalide Isofenphos Penconazole Phenthoate : PAP Procymidone Quinalphos o,p-DDE Kresoxim-methyl o,p-DDD p,p-DDE Prothiofos Chlorobenzilate Endrin Fenoxanil Carbophenothion Azinphos-methyl Fenamidone Tetradifon Fenarimol
16.158 15.232 14.997 15.195 15.407 15.515 16.509 16.667 16.659 16.920 17.088 16.964 17.593 18.858 18.883 18.634 18.323 19.698 19.576 19.370 20.893 24.292 23.326 23.939 25.149
239 265 277 330 283 258 270 345 283 320 283 298 316 313 318 316 344 324 378 329 342 317 311 354 330
167 222 277 173 162 100 243 213 248 274 283 146 246 131 235 246 267 251 263 189 342 160 238 356 251
165 162 260 99 133 72 179 121 157 (30)
121 96 118 176 90 199 176 221 111 193 125 157 (10)
132 103 159 139
152 151 109 127 134 71 215 185 248 246 283 91 246 116 165 211 239 139 228 154 296 (5)
104 238 229 111
10 5 10 10 10 15 30 10 5 10 10 20 30 20 20 25 20 30 30 15 5 30 20 25 한 검출기를 장착한 캐필러피 GC분석과 GC와 질량분석기
를 조합하여 사용하는 방법 또는 선택성과 감도를 높일 수 있는 tandem mass spectrometry(MS-MS) 기법이 많이 이 용되고 있다(15,16).
이에 본 연구는 식품의약품안전청의 잔류농약 모니터링 계속사업의 일환으로 국내 22개 지역에서 유통되는 농산물 의 잔류농약실태를 GC/MS/MS를 이용하여 조사하여 식품 에 대한 안전성을 확보하고 식품 정책과 농약 잔류허용기준 제․개정의 과학적 근거 자료로 활용하고자 한다.
재료 및 방법
재료 및 시약
시료는 인구 260,000명 이상 거주 22개 지역(서울, 부산, 대구, 울산, 인천, 광주, 강원도(원주), 경상북도(구미, 포항), 경상남도(창원, 김해), 경기도(수원, 성남, 부천, 고양, 용인), 충청북도(청주, 천안), 충청남도(대전), 전라북도(전주), 전 라남도(여수), 제주도(제주))에서 수거하였다. 2008년 3월부 터 10월까지 대형마트와 백화점에서 유통 중인 농산물 15종
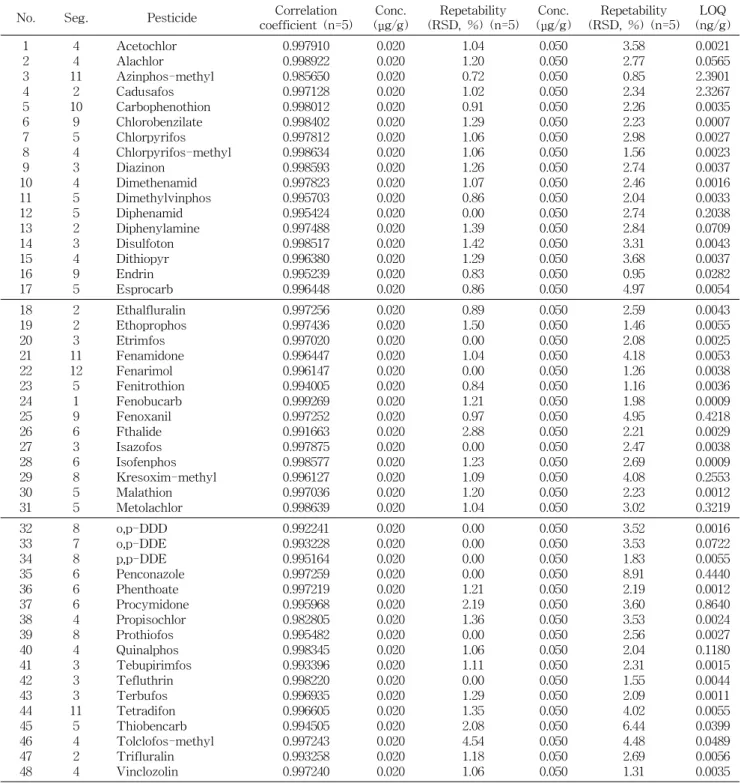
Table 2. Instrumental validation results of GC/MS/MS No. Seg. Pesticide Correlation
coefficient (n=5)
Conc.
(μg/g)
Repetability (RSD, %) (n=5)
Conc.
(μg/g)
Repetability (RSD, %) (n=5)
LOQ (ng/g) 1
2 3 4 5 6 7 8 9 10 11 12 13 14 15 16 17
4 4 11
2 10
9 5 4 3 4 5 5 2 3 4 9 5
Acetochlor Alachlor
Azinphos-methyl Cadusafos Carbophenothion Chlorobenzilate Chlorpyrifos Chlorpyrifos-methyl Diazinon
Dimethenamid Dimethylvinphos Diphenamid Diphenylamine Disulfoton Dithiopyr Endrin Esprocarb
0.997910 0.998922 0.985650 0.997128 0.998012 0.998402 0.997812 0.998634 0.998593 0.997823 0.995703 0.995424 0.997488 0.998517 0.996380 0.995239 0.996448
0.020 0.020 0.020 0.020 0.020 0.020 0.020 0.020 0.020 0.020 0.020 0.020 0.020 0.020 0.020 0.020 0.020
1.04 1.20 0.72 1.02 0.91 1.29 1.06 1.06 1.26 1.07 0.86 0.00 1.39 1.42 1.29 0.83 0.86
0.050 0.050 0.050 0.050 0.050 0.050 0.050 0.050 0.050 0.050 0.050 0.050 0.050 0.050 0.050 0.050 0.050
3.58 2.77 0.85 2.34 2.26 2.23 2.98 1.56 2.74 2.46 2.04 2.74 2.84 3.31 3.68 0.95 4.97
0.0021 0.0565 2.3901 2.3267 0.0035 0.0007 0.0027 0.0023 0.0037 0.0016 0.0033 0.2038 0.0709 0.0043 0.0037 0.0282 0.0054 18
19 20 21 22 23 24 25 26 27 28 29 30 31
2 2 3 11 12 5 1 9 6 3 6 8 5 5
Ethalfluralin Ethoprophos Etrimfos Fenamidone Fenarimol Fenitrothion Fenobucarb Fenoxanil Fthalide Isazofos Isofenphos Kresoxim-methyl Malathion Metolachlor
0.997256 0.997436 0.997020 0.996447 0.996147 0.994005 0.999269 0.997252 0.991663 0.997875 0.998577 0.996127 0.997036 0.998639
0.020 0.020 0.020 0.020 0.020 0.020 0.020 0.020 0.020 0.020 0.020 0.020 0.020 0.020
0.89 1.50 0.00 1.04 0.00 0.84 1.21 0.97 2.88 0.00 1.23 1.09 1.20 1.04
0.050 0.050 0.050 0.050 0.050 0.050 0.050 0.050 0.050 0.050 0.050 0.050 0.050 0.050
2.59 1.46 2.08 4.18 1.26 1.16 1.98 4.95 2.21 2.47 2.69 4.08 2.23 3.02
0.0043 0.0055 0.0025 0.0053 0.0038 0.0036 0.0009 0.4218 0.0029 0.0038 0.0009 0.2553 0.0012 0.3219 32
33 34 35 36 37 38 39 40 41 42 43 44 45 46 47 48
8 7 8 6 6 6 4 8 4 3 3 3 11
5 4 2 4
o,p-DDD o,p-DDE p,p-DDE Penconazole Phenthoate Procymidone Propisochlor Prothiofos Quinalphos Tebupirimfos Tefluthrin Terbufos Tetradifon Thiobencarb Tolclofos-methyl Trifluralin Vinclozolin
0.992241 0.993228 0.995164 0.997259 0.997219 0.995968 0.982805 0.995482 0.998345 0.993396 0.998220 0.996935 0.996605 0.994505 0.997243 0.993258 0.997240
0.020 0.020 0.020 0.020 0.020 0.020 0.020 0.020 0.020 0.020 0.020 0.020 0.020 0.020 0.020 0.020 0.020
0.00 0.00 0.00 0.00 1.21 2.19 1.36 0.00 1.06 1.11 0.00 1.29 1.35 2.08 4.54 1.18 1.06
0.050 0.050 0.050 0.050 0.050 0.050 0.050 0.050 0.050 0.050 0.050 0.050 0.050 0.050 0.050 0.050 0.050
3.52 3.53 1.83 8.91 2.19 3.60 3.53 2.56 2.04 2.31 1.55 2.09 4.02 6.44 4.48 2.69 1.31
0.0016 0.0722 0.0055 0.4440 0.0012 0.8640 0.0024 0.0027 0.1180 0.0015 0.0044 0.0011 0.0055 0.0399 0.0489 0.0056 0.0035 (쌀, 옥수수, 완두, 밤, 밀감, 레몬, 파인애플, 상추, 근대, 양파,
고구마줄기, 우엉, 피망, 호박, 양송이버섯)을 한 지역 당 최 소 2회 이상 수거하여 총 1,064건을 수집하였다. 본 연구에서 사용한 레몬과 파인애플은 전부 수입산이며, 나머지는 전부 국내산을 구입하였다. 농약 표준품은 Dr. Ehrenstofer(Augs- bug, Germany), Wako(Osaka, Japan) 및 Chem. Service사 (West Chester, PA, USA) 제품을 사용하였으며, 추출 및 정제를 위해 사용한 유기 용매(acetone, acetonirile, metha-
nol, n-hexane, dichloromethane)는 Merck사(Darmstadt, Germany)의 잔류농약 분석용 특급시약을 사용하였다.
Cartridge는 Varian사(Palo Alto, CA, USA) 제품인 SPE (solid phase extraction: florisil, aminopropyl, carbon 1 g/6 cc)를 사용하여 정제하였다.
분석용 시료 조제
각 시료는 100~200 g 단위로 비닐 팩에 포장하여 냉동실 에 보관하여 사용하였다. 시료 전처리는 식품공전의 잔류농
Table 3. Recoveries of pesticide standards in commercial agricultural products
No. Pesticides Sweet
pepper (%) Rice (%) Lemon (%) 1
2 3 4 5 6 7 8 9 10 11 12 13 14 15 16 17
Acetochlor Alachlor
Azinphos-methyl Cadusafos Carbophenothion Chlorobenzilate Chlorpyrifos Chlorpyrifos-methyl Diazinon
Dimethenamid Dimethylvinphos Diphenamid Diphenylamine Disulfoton Dithiopyr Endrin Esprocarb
99±6.2 98±4.5 129±8.5 123±6.1 129±9.0 120±4.2 93±1.5 95±5.3 94±6.7 101±4.5 119±4.4 118±5.8 92±11.1
104±8.3 83±6.0 96±5.6 102±5.5
84±10.4 83±8.6 122±9.5 101±6.5 122±8.0 111±10.8
85±9.5 79±4.9 80±7.0 81±7.2 102±9.9 96±9.5 85±5.7 102±6.1 90±5.9 89±10.6
100±6.2
92±6.7 97±10.5
92±7.8 104±3.8 109±3.6 117±1.5 95±7.0 92±2.0 74±6.2 87±8.6 73±5.3 77±7.9 82±3.6 81±2.3 84±4.2 98±6.4 100±2.3 18
19 20 21 22 23 24 25 26 27 28 29 30 31
Ethalfluralin Ethoprophos Etrimfos Fenamidone Fenarimol Fenitrothion Fenobucarb Fenoxanil Fthalide Isazofos Isofenphos Kresoxim-methyl Malathion Metolachlor
107±7.9 121±4.7 117±4.5 122±8.0 95±8.0 129±9.5 122±5.6 114±5.3 93±3.0 105±2.1 108±7.2 119±7.6 110±7.0 118±5.6
82±8.5 100±7.2 100±7.0 113±10.1
79±9.9 122±12.3 105±11.5 78±12.3 78±6.0 92±8.6 101±8.1 120±8.0 112±10.4
107±8.3
90±3.6 96±3.1 90±5.9 87±13.2
78±9.5 97±4.0 90±3.6 92±5.2 94±7.2 92±12.9
104±1.7 105±11.2
91±4.5 94±3.0 32
33 34 35 36 37 38 39 40 41 42 43 44 45 46 47 48
o,p-DDD o,p-DDE p,p-DDE Penconazole Phenthoate Procymidone Propisochlor Prothiofos Quinalphos Tebupirimfos Tefluthrin Terbufos Tetradifon Thiobencarb Tolclofos-methyl Trifluralin Vinclozolin
98±2.6 91±3.1 90±3.2 117±5.7 111±6.8 90±6.1 99±4.0 102±4.0 119±4.6 96±3.8 112±7.4 104±2.0 79±9.5 114±8.7 88±6.4 89±11.1
92±1.5
87±7.6 80±6.8 80±7.8 96±8.9 96±7.0 84±7.5 86±7.6 96±8.1 104±8.1 83±7.4 97±9.5 88±7.6 94±9.6 109±10.1 83±10.1 71±9.0 81±6.4
91±2.5 62±0.0 109±2.5 71±11.4
100±2.0 87±2.1 90±1.2 106±2.1 99±2.5 97±4.7 86±3.6 107±2.6 97±2.5 81±7.5 105±11.2
84±3.1 88±4.0 약 시험법 4.1.2.2법으로 실험하였다(14). 시료 약 50 g에(곡
류는 물 30 mL를 넣고 2시간 방치) acetonitrile 100 mL를 넣고 homogenizer를 이용하여 3분간 균질화하였다. 이를 부 크너 깔때기로 감압 여과하고 염화나트륨 15 g을 넣고 1분간 진탕하였다. 약 1시간 정치하여 acetonitrile 분획물 1/2을 취 하여 40oC의 수욕 상에서 진공 감압하여 농축하였다. 잔사는 2 mL의 20% acetone/n-hexane으로 용해하여, 미리 5 mL의
n-hexane으로 활성화시킨 florisil cartridge에 넣고 5 mL의
20% acetone/n-hexane으로 용출시킨 다음 다시 5 mL의 20% acetone/n-hexane으로 활성화시킨 carbon cartridge로 정제하였다. 시료는 농축하고 acetone으로 용해하여 GC/MS/MS 분석시료로 사용하였다.
분석기기와 조건
GC/MS/MS는 CP-3800(Varian), 1200L quadrupole MS/
MS(Varian), 칼럼은 VF-5MS(30 m×0.25 mm×0.25 μm, Varian), carrier gas는 He, 이동상의 유속은 0.8 mL/min로 분석하였다. 혼합 표준액을 제조하여 resolution과 감도를 증가시키기 위해 12개의 segment로 나누고 dwell time은 0.15~0.29 sec로 하였다. 그리고 injection volume은 2 μL, source 온도 200oC, inlet 온도 280oC, transfer line 온도 250
oC, filament-multiplier delay 시간은 4분으로 설정하였다.
오븐 온도는 70oC에서 3분간 머물렀다가 분당 20oC씩 180oC 까지 승온한 다음 다시 300oC까지 분당 5oC씩 승온하여 7.5 분간 유지하였다. MRM 조건은 Table 1에 나타내었다.
결 과
회수율과 농약 표준품 validation 결과
48종의 각 표준품 농도를 10, 20, 50, 100, 200 μg/g의 농도 로 제조하여 5번씩 주입한 다음 correlation coefficient, RSD, 정량한계를 측정하였다. 정량한계는 S/N ratio 10 이상으로 계산하였다. Correlation coefficient는 azinphos-methyl, propisochlor를 제외한 농약 모두가 0.99 이상으로 양호한 직선성을 나타내었으며, RSD는 전부 5% 이내였고 20 μg/g 와 50 μg/g의 결과를 Table 2에 나타내었다. 그리고 회수율 은 표준품의 혼합용액을 제조한 후 쌀, 레몬, 피망에 0.1 ppm 수준으로 첨가하여 측정하였다. 3회 반복 실험한 결과 쌀에 서는 71~122%, 레몬은 71~117%, 피망은 79~129%로 나 타났다(Table 3).
잔류농약 모니터링 결과
1,064건의 농산물 중 34건에서 농약이 검출되어 3.20%의 검출률을 나타내었고, 전부 잔류농약 허용기준치 이하였다 (Table 4, Table 5). 이것은 과거 모니터링 결과와 비교해 볼 때 상당히 낮아진 것으로 2007년까지는 부적합 빈도가 높은 농산물이 다음 해 수거 품목에 포함되었으나, 2008년부터는 부적합 농약의 위해도가 미미하다는 사실에 근거하여 엽경
채나 엽채류의 품목이 제외되었다. 그리고 2006년 이전의 연 구결과는 주로 GC(NPD, ECD)에 의존하였으나, 2006년도 부터 MS/MS를 이용하여 분석의 정확성 및 검출한계를 높 임으로써 다소 높은 검출률을 나타내었다. 또한 농약 사용에 대한 농민들의 홍보 및 교육이 농약 검출률 감소에 기여한 것으로 생각된다.
곡류(쌀, 옥수수)는 6.54%가 검출되었으며, 콩류(완두)와 견과류(밤)에서는 전혀 검출이 되지 않았다. 과실류(밀감, 파
Table 4. Detection ratio of pesticides residue in commercial agricultural products Type Group (No. of samples detected/
No. of samples analysed) No. of samples
analysed No. of samples
detected Ratio of detection (%) Cereal grains Rice (10/94)
Corn (0/59)
153 10 6.54
Beans Pea (0/36) 36 0 0.0
Nuts and seeds Chestnuts (0/81) 81 0 0.0
Fruits Mandarin (12/96)
Lemon (7/66) Pineapple (1/70)
232 20 8.62
Vegetables Lettuce (leaf) (1/77) Chard (0/76)
Sweet potato stalk (0/44) Onion (0/75)
Burdock (0/66) Squash (0/89) Sweet pepper (3/69)
496 4 0.81
Mushrooms Mushroom (0/66) 66 0 0.0
Sum 34/1064 1,064 34 3.20
Table 5. Detected pesticide residues in commercial agricul- tural products
Commodity Pesticide Detection range (mg/kg)
MRL (mg/kg)
Lemon Chlorpyrifos 0.01~0.02 0.3
Mandarin
Chlorpyrifos Fenitrothion Phenthoate
0.01~0.03 0.02~0.08 0.03~0.11
0.5 0.5 0.5
Lettuce (leaf) Procymidone 0.04 5.0
Rice Fenobucarb
Fthalide
0.01~0.02 0.01
0.5 1.0
Pineapple Etrimfos 0.01 0.2
Sweet pepper Chlorpyrifos 0.01 0.5
인애플, 레몬)는 8.62%로 가장 높은 검출률을 나타내었다.
채소류(상추, 근대, 고구마줄기, 양파, 우엉, 호박, 피망)는 496건이 수거되었지만 4건에서만 농약이 검출되어 0.81%의 검출률을 나타내었다. 상추, 근대와 같은 엽채류는 가볍고 표면적이 넓어 농약의 살포 시 농약의 부착과 잔류량이 다른 작물에 비해 상대적으로 높다. 하지만 1건의 상추에서 pro- cymidone이 검출되었다. 그리고 버섯류(양송이 버섯)에서 는 전혀 검출되지 않았다. 검출률이 가장 높은 품목은 밀감 (12.50%)이며, 쌀(10.64%)과 레몬(10.6%), 피망(4.35%) 순 으로 나타났다. 감귤은 농약사용지침서에 많은 농약이 등록 되어 있고, 실제 농약이 많이 사용되는 과실이다. 또한 시료 채취 시 과피를 포함하여 분석하게 되어 있어 밀감 과피에 잔류하는 농약이 많이 검출된 것으로 판단된다. 피망은 고추 과 작물로 69건 중 3건에서 농약이 검출되었다. 고추과에 등록된 농약은 143종으로 모두 피망에도 사용 가능한 농약 들이다. 레몬에서 검출된 농약들 중 chlorpyrifos는 국내 미 등록 농약으로 국외에서 사용된 농약이 검출된 것으로 생각
Table 6. Detection frequency of residual pesticide in com- mercial agricultural products
No. Pesticide No. of samples detected 1
2 3 4 5 6 7
Chlorpyrifos Etrimfos Fenitrothion Fenobucarb Fthalide Phenthoate Procymidone
16 1 3 10 1 4 1
Sum 36
된다. 파인애플에서도 국내사용이 허용되지 않은 etrimfos 가 검출되었다. 이러한 연구 결과는 국내에서 사용 등록되지 않은 농약의 사용허용기준을 제정하는 근거자료로 활용될 것으로 기대된다. 농약별 검출 빈도 현황을 살펴보면 chlorpyrifos가 가장 많이 검출되었으며 다음으로 feno- bucarb였다(Table 6). Chlorpyrifos는 감귤, 감, 배, 배추, 사 과, 시금치, 고추, 호박에 널리 사용되는 접촉독을 가지는 유기인계 살충제로 밀감, 레몬, 피망에서 16회 검출되었다.
Okihashi 등(17)은 일본의 재래시장에서 유통되는 173건의 농산물을 구입하여 GC-MS-MS를 이용하여 260종의 잔류 농약을 분석한 결과 Chloropyrifos가 19회 검출되었고 농도 는 3.9~121 ppb인 것으로 보고하였다. Fenobucarb는 도열 병과 벼 멸구방지에 사용되는 카바메이트계 살충제로 쌀에 서 10회 검출되었다. Lee 등(18)의 보고에 의하면 LC-MS- MS를 이용하여 47종의 잔류농약을 동시분석 한 결과에 의 하면 국내 유통되는 쌀로부터 fenobucarb가 0.031, 0.062, 0.089 ppm 검출된 것으로 나타났다. 파인애플과 레몬을 제 외한 해당 작물의 미등록 농약은 상추에서 검출된 pro- cymidone이었다. 그리고 상추와 피망과 같은 채소류는 전체 를 생으로 섭취하는 경우가 많으므로 잔류한 농약의 위해성
Table 7. Exposure assessment of pesticides in agricultural products
No Pesticide ALD
(mg/kg)
AFC (kg/day)
ADE (mg/person/day)
EDI
(mg/person/day) EDI/ADE (%) 1
2 3 4 5 6 7
Chlorpyrifos
Etrimfos Fenitrothion Fenobucarb Fthalide Phenthoate Procymidone
Lemon: 0.001415 Mandarin: 0.000826 Sweet pepper: 0.000365 Pineapple: 0.000149 Mandarin: 0.001204 Rice: 0.00113 Rice: 0.000155 Mandarin: 0.00274 Lettuce: 0.000496
0.000054 0.023280 0.00040 0.00025 0.02328 0.23661 0.23661 0.02328 0.00039
0.55
0.055 0.275 0.66 2.2 0.165 5.5
1.94285E-05
3.71429E-08 0.000028033 0.000267319 3.67501E-05 6.37775E-05 1.93481E-06
0.003532455
6.75325E-05 0.010193818 0.040502872 0.001670457 0.03865303 3.51783E-05 ALD: Average level of detection, AFC: Average food consumption (kg/person/day), ADE (Acceptable dietary exposure, mg/
person/day)=ADI (acceptable daily intake, mg/kg)×Korean average adult weight (55 kg), EDI (estimated daily intake, mg)=(AFC, kg food/person/day)×(ALD, mg/kg), ADI (%)=[EDI/ADE]×100.
에 대한 우려가 높아질 수 있으므로 이에 대한 농민들의 안 전한 농약 사용 교육이 이루어져야 할 것이다.
검출농약의 위해도 평가
검출된 농약 7종에 대한 식이 중 위해도 평가를 하였다 (Table 7)(19-21). 각 농산물에서 검출된 검출량(average level of detection: ALD)에 국민 일일평균섭취량(average food consumption: AFC)을 곱하여 우리 국민 일일 추정섭 취량(estimated daily intake: EDI)을 계산하였다. 이를 각 농약의 1일 섭취허용량(acceptable daily intake: ADI)에 국 민 평균 체중 55 kg을 곱한 1인 1일 섭취허용량(average dietary exposure: ADE)에 대한 백분율로 나타내었다. 7종 농약 모두 ADI 대비 위해도가 아주 낮은 것으로 확인되었다.
뿐만 아니라 식품 중 세척 및 요리 등을 통한 조리과정을 거쳤을 경우 위해도는 더욱 낮아져 매우 안전한 수준인 것으 로 판단된다.
요 약
식품 중 잔류농약의 안전성을 평가하고자 국내 22개 지역 에서 수거한 농산물에 대해 농약 잔류 실태를 조사하였다.
조사대상식품은 쌀, 옥수수, 완두, 밤, 밀감, 레몬, 파인애플, 상추, 근대, 고구마줄기, 양파, 우엉, 호박, 피망, 양송이버섯 의 15종이었으며 48종의 농약에 대해 GC/MS/MS 분석하였 다. 총 1,064건 중 34건 시료에서 농약이 검출되어 3.20%의 검출률을 나타내었다. 쌀, 밀감, 레몬, 파인애플, 상추, 피망 에서 7종의 잔류농약이 검출되었으나 검출량은 전부 잔류농 약허용기준 미만이었다. 검출률 10% 이상 품목은 밀감 (12.50%), 쌀(10.64%), 레몬(10.6%)이었으며, 10회 이상 다 빈도 검출 농약은 chlorpyrifos(16회), fenobucarb(10회)이었 다. 또한 검출된 7종의 농약에 대해 노출량 평가 결과 1인 1일 허용섭취량 대비 1일 추정섭취량이 아주 미미하여 위해 도는 거의 없는 것으로 확인되었다.
문 헌
1. Lee EY, Noh HH, Park YS, Kang KW, Jo SY, Lee SR, Park IY, Kim TH, Jin YD, Kyung KS. 2008. Monitoring of pesticide residues in agricultural products collected from markets in Cheongju and Jeonju. Kor J Pest Sci 12: 357- 362.
2. Cho TS, Moon YH. 2000. Recognition of farmer and urban resident on pesticide toxicity. Kor J Pest Sci 4: 48-55.
3. Kim MR, Na MA, Jung WY, Kim CS, Sun N, Seo EC, Lee EM, Park YG, Byun JA, Eom JH, Jung RS, Lee JH. 2008.
Monitoring of pesticide residues in special products. Kor
J Pest Sci 12: 323-334.
4. KFDA. 2001. Pesticides residues monitoring in foods. The
Annual Report of KFDA. Vol 5, p 491.
5. KFDA. 2002. Monitoring of pesticides and sulfur dioxide residues in herbal medicines. The Annual Report of KFDA.
Vol 6, p 678-396.
6. KFDA. 2003. Monitoring of pesticides and sulfur dioxide residues in herbal medicines. The Annual Report of KFDA.
Vol 7, p 515-528.
7. KFDA. 2004. Monitoring of pesticide residues in foods. The
Annual Report of KFDA. Vol 8-2, p 1960-1968.
8. KFDA. 2005. Monitoring of pesticide residues in agricultural products. The Annual Report of KFDA. Vol 9, p 327.
9. KFDA. 2006. Monitoring program on pesticide residues.
The Annual Report of KFDA. Vol 10, p 312-313.
10. KFDA. 2007. Monitoring of pesticide residues in agricultural products circulating in the middle and southern Korea. The
Annual Report of KFDA. Vol 11, p 137-138.
11. Kanrar B, Mandal S, Bhattacharyya A. 2010. Validation and uncertainty analysis of a multiresidue method for 67 pesti- cides in made tea, tea infusion and spent leaves using ethyl acetate extraction and gas chromatography/mass spectro- metry. J AOAC Int 93: 411-424.
12. Wong JW, Zhang K, Tech K, Hayward DG, Makovi CM, Krynitsky AJ, Schenck FJ, Banerjee K, Dasgupta S, Brown D. 2010. Multiresidue pesticide analysis in fresh produce by capillary gas chromatography-mass spectrometry/selective ion monitoring (GC-MS/SIM) and -tandem mass spectro- metry (GC-MS/MS). J Agric Food Chem 58: 5868-5883.
13. US FDA. 1994. Pesticide analytical manual. Vol I. Multi- residue methods. p 107-232.
14. KFDA. 2008. Korea Food Code. Korean Food and Drug Administration, Seoul, Korea. No. 4.1.2.2. p 10-4-10~
10-4-17.
15. Mezcua M, Martinez-Uroz MA, Wylie PL, Fernández-Alba AR. 2009. Simultaneous screening and target analytical approach by gas chromatography-quadrupole-mass spec- trometry for pesticide residues in fruits and vegetables. J
AOAC Int 92: 1790-1806.
16. Kitagawa Y, Okihashi M, Takatori S, Okamoto Y, Fukui N, Murata H, Sumimoto T, Obana H. 2009. Multiresidue method for determination of pesticide residues in processed foods by GC/MS. Shokuhin Eiseigaku Zasshi 50: 198-207.
17. Okihashi M, Takatorii S, Kitagawa T, Tanaka Y. 2007. Sim- ultaneous analysis of 260 pesticide residues in agricultural products by gas chromatography/triple quadrupole mass spectrometry. J AOAC Int 90: 1165-1179.
18. Lee SJ, Park HJ, Kim WS, Jin JS, Abd EI-Aty AM, Shim JH, Shin SC. 2009. Multiresidue analysis of 47 pesticides in cooked wheat flour and polished rice by liquid chromatog-
raphy with tandem mass spectrometry. Biomed Chromatogr 23: 434-442.
19. Shin EH, Choi JH, Pack JH, Kim HK, Lee SJ, Jeong MS, Shin SC, Shin MS, Shin MS, Lee SH, Kim TG, Lee JY, Chin JS, Shim JH. 2008. Total dietary study of pesticide residues in food. The Annual Report of KFDA. Vol 11. p 661-662.
20. Kim KI, Kim HT, Kyung KS, Jin CW, Jeong CH, Ahn MS, Sim SW, Yun SS, Kim YJ, Lee KG, Lee KD, Lee WJ, Lim JB. 2006. Monitoring of pesticide residues in peppers from farmgate and pepper powder from wholesale market in Chungbuk area and their risk assessment. Kor J Pest Sci 10: 15-21.
21. EPA. 1992. Guidelines for exposure assessment. Anticipated residues for chronic dietary exposure assessment for chlo- ropyrifos RED.
(2010년 3월 4일 접수; 2010년 4월 27일 채택)