INTRODUCTION
Thyroid nodules are common worldwide, and the prevalence of palpable thyroid nodules is 4–7% among adult populations.1,2 With the increased usage of ultrasound (US) in medical prac-
tice, an increasing number of nonpalpable thyroid nodules are detected in 20–67% of the general population.3,4 The ma- jority of patients with thyroid nodules can be managed over time, justifying efforts to select better candidates for thyroidec- tomy, because approximately 5% of thyroid nodules may have malignancy.5,6 Many studies have suggested US criteria that could be used to determine malignancy from benign lesions,7,8 although none of them have shown significant impact on clini- cal practice, despite the wide acceptance and usefulness of the suggested criteria.9
Fine-needle aspiration biopsy (FNAB) is considered to be the best diagnostic tool for determining malignant from benign nodules. However, FNAB also has a relatively high false-nega- tive rate, ranging from 0.7 to 21%.10-12 This often leads to a ques- tion of whether a repeat aspiration should be performed or
Focal Lymphocytic Thyroiditis Nodules Share the Features of Papillary Thyroid Cancer on Ultrasound
Sena Hwang1, Dong Yeob Shin1, Eun Kyung Kim2, Woo Ick Yang3, Jung Woo Byun4, Su Jin Lee1, Gyuri Kim1, Soo Jung Im4, and Eun Jig Lee1
1Division of Endocrinology, Department of Internal Medicine, Yonsei University College of Medicine, Seoul;
2Department of Radiology, Research Institute of Radiological Science, Yonsei University College of Medicine, Seoul;
3Department of Pathology, Yonsei University College of Medicine, Seoul;
4Brain Korea 21 PLUS Project for Medical Science, Yonsei University, Seoul, Korea.
Purpose: It is often difficult to discriminate focal lymphocytic thyroiditis (FLT) or adenomatous hyperplasia (AH) from thyroid cancer if they both have suspicious ultrasound (US) findings. We aimed to make a predictive model of FLT from papillary thyroid cancer (PTC) in suspicious nodules with benign cytologic results.
Materials and Methods: We evaluated 214 patients who had undergone fine-needle aspiration biopsy (FNAB) and had shown thyroid nodules with suspicious US features. PTC was confirmed by surgical pathology. FLT and AH were confirmed through more than two separate FNABs. Clinical and biochemical findings, as well as US features, were evaluated.
Results: Of 214 patients, 100 patients were diagnosed with PTC, 55 patients with FLT, and 59 patients with AH. The proportion of elevated thyrotropin (TSH) levels (p=0.014) and thyroglobulin antibody (Tg-Ab) or thyroid peroxidase antibody (TPO-Ab) positiv- ity (p<0.001) in the FLT group was significantly higher than that in the PTC group. Regarding US features, absence of calcification (p=0.006) and “diffuse thyroid disease” (DTD) pattern on US (p<0.001) were frequently seen in the FLT group. On multivariate analysis, Tg-Ab positivity, presence of a DTD pattern on US, and absence of calcification in nodules were associated with FLT with the best specificity of 99% and positive predictive value of 96%. In contrast, a taller than wide shape of nodules was the only vari- able significant for differentiating AH from PTC.
Conclusion: Suspicious thyroid nodules with cytologic benign results could be followed up with US rather than repeat FNAB, if patients exhibit Tg-Ab positivity, no calcifications in nodules, and a DTD pattern on US.
Key Words: Differential diagnosis, focal lymphocytic thyroiditis, papillary thyroid cancer Yonsei Med J 2015 Sep;56(5):1338-1344
http://dx.doi.org/10.3349/ymj.2015.56.5.1338 pISSN: 0513-5796 · eISSN: 1976-2437
Received: July 25, 2014 Revised: October 24, 2014 Accepted: November 5, 2014
Corresponding author: Dr. Eun Jig Lee, Division of Endocrinology, Department of Internal Medicine, Yonsei University College of Medicine, 50-1 Yonsei-ro, Seodae- mun-gu, Seoul 120-752, Korea.
Tel: 82-2-2228-1983, Fax: 82-2-393-6884, E-mail: [email protected]
•The authors have no financial conflicts of interest.
© Copyright: Yonsei University College of Medicine 2015
This is an Open Access article distributed under the terms of the Creative Com- mons Attribution Non-Commercial License (http://creativecommons.org/ licenses/
by-nc/3.0) which permits unrestricted non-commercial use, distribution, and repro- duction in any medium, provided the original work is properly cited.
whether follow-up with US should be performed on suspicious thyroid nodules.13,14
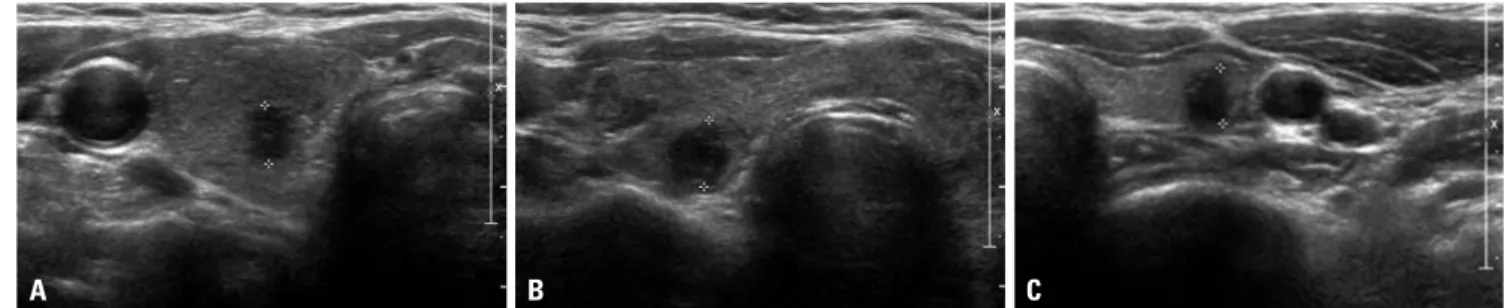
US findings of lymphocytic thyroiditis or Hashimoto’s thy- roiditis show diffusely coarse and heterogeneous hypoecho- genicity.15-17 However, lymphocytic thyroiditis can be observed as a focal thyroid nodule that appears to be hypoechoic with ill-defined margins: an appearance that is indistinguishable from that of a malignant nodule (Fig. 1).5,18,19 Therefore, we sought to identify clinical and biochemical findings, in addition to US features, that could be used to determine focal lympho- cytic thyroiditis from thyroid malignancy in order to reduce the need for repetitive FNABs.
MATERIALS AND METHODS
Patients
We retrospectively reviewed the medical records of 214 pa- tients who had thyroid nodules with suspicious features for ma- lignancy and had undergone US-guided FNAB between Janu- ary 2005 and December 2010 at Severance Hospital, Seoul, Korea. First, we selected 55 patients (mean age, 54.1 years; range, 26–74 years) who were diagnosed with focal lymphocytic thy- roiditis (FLT), and 59 patients (mean age, 54.4 years; range, 28–
77 years) diagnosed with adenomatous hyperplasia (AH) by two or more repeat FNABs on thyroid nodules with suspicious features for malignancy on US. Then we selected 100 papillary thyroid cancer (PTC) patients who were diagnosed based on surgical pathology after the initial US-guided FNAB, matched for sex and age±5 (mean age, 52.5 years; range, 29–82 years) with the FLT group or the AH group. We retrospectively reviewed the US, cytological, and pathological results of the patients. Hashi- moto’s thyroiditis is widely known and defined as elevated thy- rotropin (TSH), as well as antithyroid peroxidase antibody (TPO-Ab) positivity and/or antithyroglobulin antibody (Tg-Ab) positivity in serum. Only 1 patient with PTC and 2 patients with AH received treatment for thyroid diseases with levothyroxine, and among 4 patients who had FLT, three were treated with le- vothyroxine and one with methimazole.
Laboratory and imaging tests
Thyroid functions were measured by radioimmunoassay using T3-CTK (Diasorin SpA, Saluggia, Italy) for T3 and Amerlex-MAB*
FT4 kit (Trinity Biotech PLC, Wicklow, Ireland) for free T4. Se- rum TSH level was determined by immunoradiometric assay using TSH-CTK-3 kit (Diasorin SpA, Saluggia, Italy). The refer- ence ranges were 98–180 ng/dL for T3, 0.73–1.95 ng/dL for FT4 and 0.3–4.0 μIU/mL for TSH. Serum anti-thyroglobulin (Tg-Ab) and thyroid peroxidase antibodies (TPO-Ab) were both deter- mined by the Brahms RIA-Kit (BRAHMS AG, Hennigsdorf, Ger- many) and the reference ranges were 0–60 IU/mL.
US or US-guided FNAB were performed using a 5–12 MHz linear probe (iU22; Philips Medical Systems, Bothell, WA, USA), a 7–15 MHz linear probe (HDI 5000; Philips Medical Systems, Bothell, WA, USA), or an 8–15 MHz linear probe (Acuson Se- quoia; Siemens Medical Solutions, Mountain View, CA, USA).
Key features for “suspicious for malignancy” on US include mi- crocalcification, irregular or microlobulated margin, hypoecho- genicity, and taller than wide in shape (i.e., greater anteroposte- rior dimension than transverse dimension).20,21 “Diffuse thyroid disease” (DTD) pattern was defined as diffusely heterogeneous hypoechogenicity on sonography.22 US-guided FNAB was per- formed with a 23-gauge needle attached to a 20-mL disposable plastic syringe. Materials obtained from the aspiration biopsy were transferred onto glass slides and then placed immediately in 95% alcohol for Papanicolaou staining. AH was diagnosed if the cytology revealed the presence of colloids and varying numbers of follicular cells, and lymphocytic thyroiditis was diagnosed if there were follicular cells with scattered back- ground lymphocytes.5,23
Statistical analysis
All statistical analysis was performed using PASW v. 18.0 for Windows (SPSS Inc., Chicago, IL, USA). Comparisons were per- formed by chi-square test or Fisher’s exact test for categorical variables and Student t-test or Mann-Whitney U test for con- tinuous variables. For multiple comparisons, the ANOVA with post hoc Bonferroni procedure was performed. To categorize serum TSH levels, we searched the best cut-off point for differ-
Fig. 1. Examples of nodules suspected as malignant on US findings. (A) A 6-mm suspicious nodule (delineated by electronic calipers) was found on the right thyroid gland, and PTC was confirmed by surgical pathology. (B) A 7-mm suspicious nodule (delineated by electronic calipers) was found on the right thyroid gland and was cytologically confirmed as FLT more than twice by FNAB. The thyroid gland showed diffuse heterogeneous echogenicity, a characteristic finding of the DTD pattern of thyroid gland on US. (C) There was a 6-mm suspicious nodule (delineated by electronic calipers) on the left thyroid gland, which was cytologically confirmed as AH more than twice by FNAB. PTC, papillary thyroid cancer; FLT, focal lymphocytic thyroiditis; AH, adenomatous hyperplasia; FNAB, fine needle aspiration biopsy; DTD pattern, “diffuse thyroid disease” pattern on US; US, ultrasound.
A B C
entiating between PTC and FLT using receiver operating char- acteristic (ROC) curve analysis, which was 2.50 μIU/mL, with a sensitivity of 53% and specificity of 80%.
To differentiate between FLT and PTC, a logistic regression model with the backward stepwise method was used. The sig- nificant variables identified in an univariate analysis were sub- sequently entered into a multivariate analysis. In this model, the least statistically significant variables were removed one at a time until only independent variables with a preset p val-
ue≤0.1 were retained. All p values<0.05 were considered sig- nificant.
RESULTS
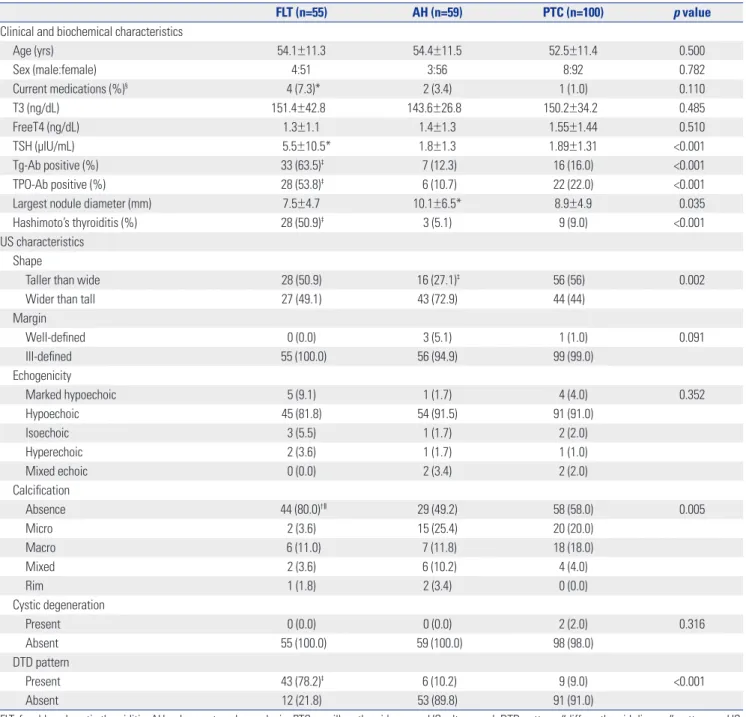
Baseline characteristics according to FLT, AH, and PTC Table 1 shows the clinical, biochemical, and US characteris- tics of the three groups. TSH levels and the frequency of Tg-Ab
Table 1. Baseline Characteristics According to Cytological Diagnosis
FLT (n=55) AH (n=59) PTC (n=100) p value
Clinical and biochemical characteristics
Age (yrs) 54.1±11.3 54.4±11.5 52.5±11.4 0.500
Sex (male:female) 4:51 3:56 8:92 0.782
Current medications (%)§ 4 (7.3)* 2 (3.4) 1 (1.0) 0.110
T3 (ng/dL) 151.4±42.8 143.6±26.8 150.2±34.2 0.485
FreeT4 (ng/dL) 1.3±1.1 1.4±1.3 1.55±1.44 0.510
TSH (μIU/mL) 5.5±10.5* 1.8±1.3 1.89±1.31 <0.001
Tg-Ab positive (%) 33 (63.5)‡ 7 (12.3) 16 (16.0) <0.001
TPO-Ab positive (%) 28 (53.8)‡ 6 (10.7) 22 (22.0) <0.001
Largest nodule diameter (mm) 7.5±4.7 10.1±6.5* 8.9±4.9 0.035
Hashimoto’s thyroiditis (%) 28 (50.9)‡ 3 (5.1) 9 (9.0) <0.001
US characteristics Shape
Taller than wide 28 (50.9) 16 (27.1)‡ 56 (56) 0.002
Wider than tall 27 (49.1) 43 (72.9) 44 (44)
Margin
Well-defined 0 (0.0) 3 (5.1) 1 (1.0) 0.091
Ill-defined 55 (100.0) 56 (94.9) 99 (99.0)
Echogenicity
Marked hypoechoic 5 (9.1) 1 (1.7) 4 (4.0) 0.352
Hypoechoic 45 (81.8) 54 (91.5) 91 (91.0)
Isoechoic 3 (5.5) 1 (1.7) 2 (2.0)
Hyperechoic 2 (3.6) 1 (1.7) 1 (1.0)
Mixed echoic 0 (0.0) 2 (3.4) 2 (2.0)
Calcification
Absence 44 (80.0)†ǁ 29 (49.2) 58 (58.0) 0.005
Micro 2 (3.6) 15 (25.4) 20 (20.0)
Macro 6 (11.0) 7 (11.8) 18 (18.0)
Mixed 2 (3.6) 6 (10.2) 4 (4.0)
Rim 1 (1.8) 2 (3.4) 0 (0.0)
Cystic degeneration
Present 0 (0.0) 0 (0.0) 2 (2.0) 0.316
Absent 55 (100.0) 59 (100.0) 98 (98.0)
DTD pattern
Present 43 (78.2)‡ 6 (10.2) 9 (9.0) <0.001
Absent 12 (21.8) 53 (89.8) 91 (91.0)
FLT, focal lymphocytic thyroiditis; AH, adenomatous hyperplasia; PTC, papillary thyroid cancer; US, ultrasound; DTD pattern, “diffuse thyroid disease” pattern on US;
TSH, thyrotropin; Tg-Ab, thyroglobulin antibody; TPO-Ab, thyroid peroxidase antibody.
Data are mean±SD or number of patients (%). p value by one-way ANOVA for continuous variables and χ2-test for categorical variables.
*p<0.05, †p<0.01, ‡p<0.001, the comparison of the FLT or AH group with the PTC group, §The portion of the patients treated with levothyroxine or anti-thyroid drugs, ǁComparison between the absence and the presence of calcification.
and TPO-Ab positivity were significantly different among the groups. In terms of US features, the proportions of taller than wide shape, calcification of nodules, and DTD pattern on US were significantly different among the groups. In comparisons between the FLT and PTC groups, as expected, TSH levels (p=0.014), Tg-Ab or TPO-Ab positivity (p<0.001), and the pro- portions of patients taking thyroid medications (p=0.034) and having Hashimoto’s thyroiditis (p<0.001) were significantly higher in the FLT group than the PTC group. Among US fea- tures, absence of calcification (p=0.006) and DTD pattern on US (p<0.001) were more frequently seen in the FLT group than the PTC group. The irregularity of margins, echogenicity, pattern
of calcifications, and cystic degeneration in nodules did not dif- fer between the FLT group and the PTC group. However, in comparisons between the AH group and the PTC group, nod- ule size was larger (p=0.029) and the proportion of a taller than wide shape of nodules was lower (p<0.001) in the AH group than the PTC group.
Comparison between the FLT group and the PTC groups according to nodule size
Next, we evaluated whether differences in these variables be- tween the FLT group and the PTC groups differed according to nodule size (<10 mm or ≥10 mm) (Table 2). In terms of thyroid Table 2. Clinical, Biochemical, and Sonographic Characteristics of the FLT Group, Compared with the PTC Group, According to Nodule Size
Nodule size <10 mm Nodule size ≥10 mm
FLT (n=45) PTC (n=66) p value FLT (n=10) PTC (n=34) p value
Clinical and biochemical characteristics
Age (yrs) 54.0±11.3 51.6±11.4 0.281 54.9±11.9 54.2±11.3 0.815
Sex (male:female) 4:41 3:63 0.355 10:0 29:5 0.573
Current medications (%)* 3 (6.7) 1 (1.5) 0.153 1 (10.0) 0 (0.0) 0.233
T3 (ng/dL) 156.3±43.5 147.5±35.1 0.284 120.3±20.3 155.5±32.4 0.012
FreeT4 (ng/dL) 1.4±1.2 1.4±1.2 0.978 0.8±0.3 1.8±1.8 0.001
TSH (μIU/mL) 5.7±11.2 1.9±1.4 0.033 4.8±6.7 1.8±1.2 0.044
Tg-Ab positive (%) 27 (64.3) 6 (9.1) <0.001 6 (60.0) 10 (29.4) 0.133
TPO-Ab positive (%) 23 (54.8) 12 (18.2) <0.001 5 (50.0) 10 (29.4) 0.271
Nodule diameter (mm) 6.0±2.0 6.1±1.6 0.858 14.4±0.7 14.4±0.5 0.553
US characteristics Shape
Taller than wide 25 (55.6) 48 (72.7) 0.061 3 (30.0) 8 (23.5) 0.692
Wider than tall 20 (44.4) 18 (27.3) 7 (70.0) 26 (76.5)
Margin
Well-defined 0 (0.0) 0 (0.0) 1.000 0 (0.0) 1 (2.9) 1.000
Ill-defined 45 (100.0) 66 (100.0) 10 (100.0) 33 (97.1)
Echogenicity
Marked hypoechoic 5 (11.1) 1 (1.5) 0.045 0 (0.0) 3 (8.8) 0.668
Hypoechoic 36 (80.0) 63 (95.9) 9 (90.0) 28 (82.4)
Isoechoic 2 (4.4) 1 (1.5) 1 (10.0) 1 (2.9)
Hyperechoic 2 (4.4) 0 (0.0) 0 (0.0) 1 (2.9)
Mixed echoic 0 (0.0) 1 (1.5) 0 (0.0) 1 (2.9)
Calcification
Present 10 (22.2) 22 (33.3) 0.204 1 (10.0) 20 (58.8) 0.010
Absent 35 (77.8) 44 (66.7) 9 (90.0) 14 (41.2)
Cystic degeneration
Present 0 (0.0) 1 (1.5) 0.407 0 (0.0) 1 (2.9) 1.000
Absent 45 (100.0) 65 (98.5) 10 (100.0) 33 (97.1)
DTD pattern
Present 36 (80.0) 5 (7.6) <0.001 7 (70.0) 4 (11.8) 0.001
Absent 9 (20.0) 61 (92.4) 3 (30.0) 30 (88.2)
PTC, papillary thyroid cancer; FLT, focal lymphocytic thyroiditis; TSH, thyrotropin; Tg-Ab, thyroglobulin antibody; TPO-Ab, thyroid peroxidase antibody; DTD pat- tern, “diffuse thyroid disease” pattern on US; US, ultrasound.
Data are mean±SD or number of patients (%). p value by Student’s t-test or Mann-Whitney U test for continuous variables and χ2-test or Fisher exact test for categorical variables.
*The portion of the patients treated with levothyroxine or anti-thyroid drugs.
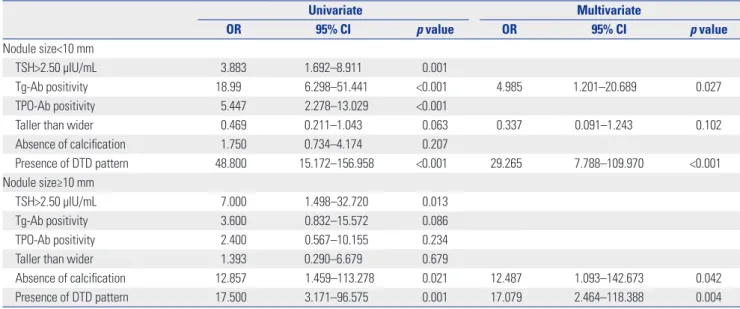
cation (OR=12.487, p=0.042) and presence of a DTD pattern on US (OR=17.079, p=0.004) remained significant in large FLTs
≥10 mm.
Diagnostic predictor model to differentiate FLT from PTC
To determine which variables can differentiate FLT from PTC, a standard set of predictive measures was calculated for each variable or the combination of all three variables of Tg-positivi- ty, absence of calcification, and presence of a DTD pattern on US (Table 5). The presence of the DTD pattern on US showed, individually, the best specificity of 91% and positive predictive value (PPV) of 83%. In combination analysis of variables, the combination of three variables showed the best specificity of 99% and PPV of 96%, but a low sensitivity of 45%.
DISCUSSION
Many studies have attempted to investigate a useful indicator of thyroid malignancy based on US findings. However, micronod- ules of lymphocytic thyroiditis can increase in size and be pres- ent hypoechoic or hyperechoic nodules with ill-defined mar- gins on US.5,18,19 Therefore, focal thyroiditis is indistinguishable from thyroid cancer or lymphoma. These so-called pseudotu- mors constituted 36% of the nodules of focal thyroiditis detect- ed by US.5 However, specific US features of focal thyroiditis are not well established.
In the present study, we aimed to identify the characteris- tics that would clearly distinguish FLT from malignancy, espe- cially those showing suspicious features on US, and to make a diagnostic model for FLT. First, we grouped the patients ac- cording to diagnostic criteria by following cytologic confirma- function, TSH levels were elevated in the FLT group, compared
with the PTC group, regardless of nodules size. However, US features were different according to nodule size. In small nod- ules <10 mm, the echogenicity of nodules (p=0.045) and DTD pattern on US (p<0.001) differed significantly between the FLT group and the PTC groups. In contrast, among large nod- ules ≥10 mm, the FLT group showed a higher proportion of absence of calcification in thyroid nodules (p=0.010) and a DTD pattern on US (p=0.001) than the PTC group.
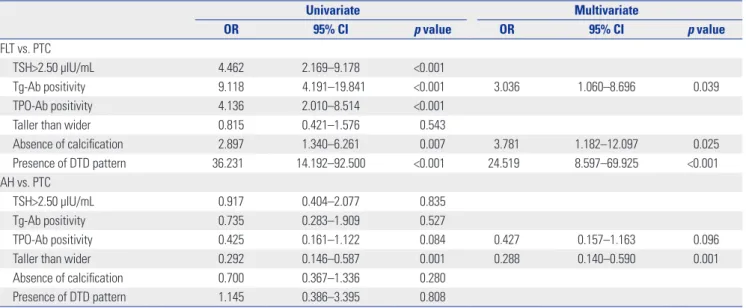
Univariate and multivariate analysis
Table 3 shows the odds ratio (OR) with 95% confidence interval (CI) for the characteristics more frequently seen in the FLT group or the AH group, compared with the PTC group, regardless of nodule size. On univariate analysis, the variables associated with FLT were TSH >2.50 μIU/mL (OR=4.462, p<0.001) and Tg- Ab (OR=9.118, p<0.001) and TPO-Ab positivity (OR=4.136, p<
0.001). Regarding US features, absence of calcification in nodules (OR=2.897, p=0.007) and presence of a DTD pattern on US (OR=36.231, p<0.001) were associated with FLT rather than PTC.
On multivariate analysis by the conditional backward method, Tg-Ab positivity, absence of calcification in nodules, and pres- ence of a DTD pattern on US were significant. In contrast, nod- ules with a taller than wide shape showed significantly lower odds in prediction for AH in both univariate (OR=0.292, p=
0.001) and multivariate (OR=0.288, p=0.001) analysis, suggesting that taller than wide shape is associated more with PTC rather than AH.
However, the variables associated with FLT were different ac- cording to nodule size (Table 4). In small nodules <10 mm, Tg- Ab positivity (OR=4.985, p=0.027) and presence of a DTD pat- tern on US (OR=29.265, p<0.001) were significantly associated with FLT in multivariate analysis. In contrast, absence of calcifi- Table 3. Univariate and Multivariate Analysis among Groups
Univariate Multivariate
OR 95% CI p value OR 95% CI p value
FLT vs. PTC
TSH>2.50 μIU/mL 4.462 2.169–9.178 <0.001
Tg-Ab positivity 9.118 4.191–19.841 <0.001 3.036 1.060–8.696 0.039
TPO-Ab positivity 4.136 2.010–8.514 <0.001
Taller than wider 0.815 0.421–1.576 0.543
Absence of calcification 2.897 1.340–6.261 0.007 3.781 1.182–12.097 0.025
Presence of DTD pattern 36.231 14.192–92.500 <0.001 24.519 8.597–69.925 <0.001
AH vs. PTC
TSH>2.50 μIU/mL 0.917 0.404–2.077 0.835
Tg-Ab positivity 0.735 0.283–1.909 0.527
TPO-Ab positivity 0.425 0.161–1.122 0.084 0.427 0.157–1.163 0.096
Taller than wider 0.292 0.146–0.587 0.001 0.288 0.140–0.590 0.001
Absence of calcification 0.700 0.367–1.336 0.280
Presence of DTD pattern 1.145 0.386–3.395 0.808
FLT, focal lymphocytic thyroiditis; PTC, papillary thyroid cancer; AH, adenomatous hyperplasia; TSH, thyrotropin; Tg-Ab, thyroglobulin antibody; TPO-Ab, thyroid peroxidase antibody; DTD pattern, “diffuse thyroid disease” pattern on US; OR, odds ratio; CI, confidence interval; US, ultrasound.
tion of benign nodules, such as lymphocytic thyroiditis or AH by two or more FNABs. This is based on the previous reports that if the repeat cytological results were both “benign”, the risk of malignancy was very low (3.1%).7 Then, we compared clinical and biochemical parameters, in addition to US features, between FLT or AH and PTC.
Among US findings, nodules with a taller-than-wide shape was the only variable significantly different between AH and PTC in this study. This result is also consistent with previous studies that a taller-than-wide shape is the best predictor for malignancy.21,24 In contrast, it is a task of great significance to identify the parameters to differentiate between FLT and PTC because many FLTs could have suspicious features on US. We found that the combination of three variables, including Tg-Ab positivity, absence of calcification in nodules, and presence of a DTD pattern on US, was the strongest predictor for FLT.
However, the sensitivity was only 45%. This may be because absence of calcification in nodules had low specificity of 42%
for FLT. Calcification has been noted in 23.8% of patients with focal thyroiditis, which is a greater concern for malignancy.25 In
the present study, 20% of FLTs had calcification, which could indicate malignancy. Therefore, absence or presence of calcifi- cation in nodules showed relatively low predictive value for FLT.
Lymphocytic thyroiditis shows diffuse heterogeneous hy- poechogenicity on US, which appeared as a DTD pattern on US in our study. This feature is not specific to lymphocytic thyroid- itis and may be observed in multinodular goiters, autoimmune thyroid disease, and subacute thyroiditis.8,15,26 Although a DTD pattern on US is a nonspecific presentation for lymphocytic thyroiditis, a DTD pattern on US was the strongest predictor for FLT, individually, in the present study. It is less clear wheth- er autoimmunity is the cause or effect of thyroid malignancy. In the present study, Tg-Ab positivity showed a significantly great- er association with FLT than PTC. Meanwhile, TPO-Ab posi- tivity was also associated with FLT in univariate analysis, but it was removed in multivariate analysis. Nevertheless, our results do not suggest that only seropositivity or seronegativity of Tg- Ab is correlated with PTC.
Recently, guidelines have recommended different manage- Table 5. Predictor Model of FLT from PTC Based on Individual or Combined Variables
Sensitivity (%) Specificity (%) PPV (%) NPV (%)
Tg-Ab positivity 63 84 67 82
Absence of calcification 80 42 43 79
Presence of DTD pattern 79 91 83 88
Tg-Ab positivity and absence of calcification 51 92 78 77
Tg-Ab positivity and presence of DTD pattern 55 96 88 79
Absence of calcification and presence of DTD pattern 65 96 90 83
Tg-Ab positivity, absence of calcification, and presence of DTD pattern 45 99 96 77
FLT, focal lymphocytic thyroiditis; PTC, papillary thyroid cancer; Tg-Ab, thyroglobulin antibody; DTD pattern, “diffuse thyroid disease” pattern on US; PPV, positive predictive value; NPV, negative predictive value; US, ultrasound.
Table 4. Univariate and Multivariate Analysis between the FLT Group and the PTC Group According to Nodule Size
Univariate Multivariate
OR 95% CI p value OR 95% CI p value
Nodule size<10 mm
TSH>2.50 μIU/mL 3.883 1.692–8.911 0.001
Tg-Ab positivity 18.99 6.298–51.441 <0.001 4.985 1.201–20.689 0.027
TPO-Ab positivity 5.447 2.278–13.029 <0.001
Taller than wider 0.469 0.211–1.043 0.063 0.337 0.091–1.243 0.102
Absence of calcification 1.750 0.734–4.174 0.207
Presence of DTD pattern 48.800 15.172–156.958 <0.001 29.265 7.788–109.970 <0.001
Nodule size≥10 mm
TSH>2.50 μIU/mL 7.000 1.498–32.720 0.013
Tg-Ab positivity 3.600 0.832–15.572 0.086
TPO-Ab positivity 2.400 0.567–10.155 0.234
Taller than wider 1.393 0.290–6.679 0.679
Absence of calcification 12.857 1.459–113.278 0.021 12.487 1.093–142.673 0.042
Presence of DTD pattern 17.500 3.171–96.575 0.001 17.079 2.464–118.388 0.004
FLT, focal lymphocytic thyroiditis; PTC, papillary thyroid cancer; TSH, thyrotropin; Tg-Ab, thyroglobulin antibody; TPO-Ab, thyroid peroxidase antibody; DTD pat- tern, “diffuse thyroid disease” pattern on US; OR, odds ratio; CI, confidence interval; US, ultrasound.
ments based on nodule size.20 Our study also showed different predictors for FLT according to nodule size. Based on our results, absence or presence of calcification in small nodules <10 mm could not predict FLT or malignancy. Tg-Ab positivity and DTD pattern on US were only associated with small FLT.
There are several limitations in this study. First, selection bias was inevitable. Second, this study took samples from a small number of patients, because we selected patients who were diagnosed by two or more repeat FNABs. Third, we did not analyze intranodular vascularity, which has been shown to be associated with a risk of malignancy.27
In conclusion, suspicious thyroid nodules with benign cy- tologic results on initial FNAB could be followed-up with US, if there are seropositivity of Tg-Ab, no calcifications in nodules, and presence of a DTD pattern on US. Our study provides use- ful information as a tool for management decision making and to reduce the need for repetitive FNABs in thyroid nodules with discordant results between benign cytology and suspi- cious US features.
REFERENCES
1. Mortensen JD, Woolner LB, Bennett WA. Gross and microscopic findings in clinically normal thyroid glands. J Clin Endocrinol Metab 1955;15:1270-80.
2. Singer PA. Evaluation and management of the solitary thyroid nodule. Otolaryngol Clin North Am 1996;29:577-91.
3. Mazzaferri EL. Management of a solitary thyroid nodule. N Engl J Med 1993;328:553-9.
4. Ross DS. Nonpalpable thyroid nodules--managing an epidemic. J Clin Endocrinol Metab 2002;87:1938-40.
5. Langer JE, Khan A, Nisenbaum HL, Baloch ZW, Horii SC, Cole- man BG, et al. Sonographic appearance of focal thyroiditis. AJR Am J Roentgenol 2001;176:751-4.
6. Hegedüs L. Clinical practice. The thyroid nodule. N Engl J Med 2004;351:1764-71.
7. Kim EK, Park CS, Chung WY, Oh KK, Kim DI, Lee JT, et al. New sonographic criteria for recommending fine-needle aspiration biopsy of nonpalpable solid nodules of the thyroid. AJR Am J Roentgenol 2002;178:687-91.
8. Peccin S, de Castsro JA, Furlanetto TW, Furtado AP, Brasil BA, Cz- epielewski MA. Ultrasonography: is it useful in the diagnosis of cancer in thyroid nodules? J Endocrinol Invest 2002;25:39-43.
9. Hegedüs L. Thyroid ultrasonography as a screening tool for thy- roid disease. Thyroid 2004;14:879-80.
10. Ylagan LR, Farkas T, Dehner LP. Fine needle aspiration of the thy- roid: a cytohistologic correlation and study of discrepant cases.
Thyroid 2004;14:35-41.
11. Sangalli G, Serio G, Zampatti C, Bellotti M, Lomuscio G. Fine nee- dle aspiration cytology of the thyroid: a comparison of 5469 cyto-
logical and final histological diagnoses. Cytopathology 2006;17:
245-50.
12. Raab SS, Vrbin CM, Grzybicki DM, Sudilovsky D, Balassanian R, Zarbo RJ, et al. Errors in thyroid gland fine-needle aspiration. Am J Clin Pathol 2006;125:873-82.
13. Shin JH, Han BK, Ko K, Choe YH, Oh YL. Value of repeat ultra- sound-guided fine-needle aspiration in nodules with benign cy- tological diagnosis. Acta Radiol 2006;47:469-73.
14. Chernyavsky VS, Shanker BA, Davidov T, Crystal JS, Eng O, Ibra- him K, et al. Is one benign fine needle aspiration enough? Ann Surg Oncol 2012;19:1472-6.
15. Marcocci C, Vitti P, Cetani F, Catalano F, Concetti R, Pinchera A.
Thyroid ultrasonography helps to identify patients with diffuse lymphocytic thyroiditis who are prone to develop hypothyroid- ism. J Clin Endocrinol Metab 1991;72:209-13.
16. Pedersen OM, Aardal NP, Larssen TB, Varhaug JE, Myking O, Vik- Mo H. The value of ultrasonography in predicting autoimmune thyroid disease. Thyroid 2000;10:251-9.
17. Raber W, Gessl A, Nowotny P, Vierhapper H. Thyroid ultrasound versus antithyroid peroxidase antibody determination: a cohort study of four hundred fifty-one subjects. Thyroid 2002;12:725-31.
18. Yeh HC, Futterweit W, Gilbert P. Micronodulation: ultrasonograph- ic sign of Hashimoto thyroiditis. J Ultrasound Med 1996;15:813-9.
19. Takashima S, Matsuzuka F, Nagareda T, Tomiyama N, Kozuka T.
Thyroid nodules associated with Hashimoto thyroiditis: assess- ment with US. Radiology 1992;185:125-30.
20. American Thyroid Association (ATA) Guidelines Taskforce on Thyroid Nodules and Differentiated Thyroid Cancer, Cooper DS, Doherty GM, Haugen BR, Kloos RT, Lee SL, et al. Revised Ameri- can Thyroid Association management guidelines for patients with thyroid nodules and differentiated thyroid cancer. Thyroid 2009;19:1167-214.
21. Cappelli C, Castellano M, Pirola I, Gandossi E, De Martino E, Cu- metti D, et al. Thyroid nodule shape suggests malignancy. Eur J Endocrinol 2006;155:27-31.
22. Shin DY, Kim EK, Lee EJ. Role of ultrasonography in outcome pre- diction in subclinical hypothyroid patients treated with levothy- roxine. Endocr J 2010;57:15-22.
23. Nguyen GK, Lee MW, Ginsberg J, Wragg T, Bilodeau D. Fine-nee- dle aspiration of the thyroid: an overview. Cytojournal 2005;2:12.
24. Cappelli C, Pirola I, Cumetti D, Micheletti L, Tironi A, Gandossi E, et al. Is the anteroposterior and transverse diameter ratio of nonpalpa- ble thyroid nodules a sonographic criteria for recommending fine- needle aspiration cytology? Clin Endocrinol (Oxf) 2005;63:689-93.
25. Takashima S, Fukuda H, Nomura N, Kishimoto H, Kim T, Ko- bayashi T. Thyroid nodules: re-evaluation with ultrasound. J Clin Ultrasound 1995;23:179-84.
26. Hayashi N, Tamaki N, Konishi J, Yonekura Y, Senda M, Kasagi K, et al. Sonography of Hashimoto’s thyroiditis. J Clin Ultrasound 1986;
14:123-6.
27. Bastin S, Bolland MJ, Croxson MS. Role of ultrasound in the as- sessment of nodular thyroid disease. J Med Imaging Radiat Oncol 2009;53:177-87.