Introduction
Detection of glaucomatous damage can be problematic, particularly in juveniles. Diagnosis is typically achieved through observation of the optic nerve head and retinal nerve fiber layer (RNFL) and measurement of the visual function with perimetry. These methods are subjective examinations, however, and cannot provide a reliable early diagnosis.1 Defects in the RNFL may be an early sign of
glaucoma, preceding optic disc and visual field changes.2 Optical coherence tomography (OCT), a new noninvasive technology allowing for cross-sectional imaging of the eye, was recently reported to offer the possibility of assessing the RNFL thickness with good reproducibility.
OCT is an imaging technology that was developed to detect retinal and RNFL damage.3-5 In OCT, the RNFL thickness is most often measured using peripapillary scanning around the optic disc. The Stratus OCT (Carl Zeiss Meditec Inc., Dublin, CA, USA) has the ability to quantify the RNFL thickness with a resolution of 8 to 10 µm and can thus potentially diagnose glaucoma much ear- lier.5 A number of recent studies have reported that OCT can detect glaucomatous damage with moderate to reason- ably high sensitivity and specificity. In these studies, the
소아청소년에서 빛간섭단층촬영을 이용한 망막신경절섬유 두께와 초기녹내장성 변화와의 관계
Relationship between Retinal Nerve Fiber Layer Thickness and Early Glaucomatous Changes in the Adolescents
이나영
Na Young Lee, MD, PhD
가톨릭대학교 의과대학 은평성모병원 안과학교실
Department of Ophthalmology and Visual Science, Eunpyeong St. Mary's Hospital, College of Medicine, The Catholic University of Korea, Seoul, Korea
Purpose: To evaluate of usefulness of retinal nerve fiber layer thickness as measured by optical coherence tomography (OCT) in children and young adolescents in the diagnosis of glaucoma, ocular hypertension, and glaucoma suspect.
Methods: In total, 234 patients aged <18 years were included in this study (21 eyes with glaucoma, 179 suspected glaucoma eyes, and 34 eyes with ocular hypertension). All patients underwent OCT to measure the retinal nerve fiber layer thickness, Humphrey visual field testing if possible, and other ocular examinations. Based on the OCT results, we classified the eyes into 4 o’clock-hour and 12 o’clock-hour sectors and compared these data with other clinical ocular findings.
Results: The retinal nerve fiber layer thickness as measured by OCT was correlated with the vertical cup disc ratio. An OCT 330° (Sup) value of <140 µm or an average OCT value of <105 µm is useful for the prediction of a vertical cup disc ratio of >0.6.
Conclusions: A higher vertical cup disc ratio is associated with a lower retinal nerve fiber layer thickness, not only with back-bowing of the lamina cribrosa or normal variation. An OCT 330° (Sup) value of <140 µm or average OCT value of <105 µm is a useful index with which to predict early glaucomatous changes in pediatric and young adolescent patients.
Key words: Childhood glaucoma, Glaucoma suspect, Nerve fiber layer thickness, Ocular hypertension, Optical coherence tomography
Received: 2019. 5. 21. Revised: 2019. 6. 3.
Accepted: 2019. 7. 1.
Corresponding Author: Na Young Lee, MD, PhD
Department of Ophthalmology and Visual Science, Eunpyeong St.
Mary’s Hospital, #1021 Tongil-ro, Eunpyeong-gu, Seoul 03312, Korea Tel: +82-2-2030-4548, Fax: +82-2-2030-2811
E-mail: [email protected]
sensitivity/specificity ranged from 76%/81% to 91%/100%, respectively.6-8
The diagnosis of glaucoma in children and young adults has been very difficult for clinical ophthalmologists because visual field examination in young patients is relatively un- reliable and there is currently no normative OCT database for patients aged <18 years. Considering this background, we attempted to identify a correlation between the clinical outcomes of these patients and the thickness of the RNFL and to determine whether OCT is a useful diagnostic tool for young patients with glaucoma.
Materials and Methods
The study population comprised 234 patients aged <18 years who visited the ophthalmologic clinic. One eye was randomly chosen for each patient. Informed consent was obtained from all patients before their participation. All study procedures adhered to the tenets of the Declaration of Helsinki, and the study protocol was approved by the In- stitutional Board of Research Associates of the Incheon St.
Mary’s hospital, Catholic University of Korea.
The inclusion criteria were a clear lens, normal retina, and open angle state. The exclusion criteria were myopia of greater than -8 diopters, optic disc nerve disease other than glaucoma, and a history of neuro-ophthalmologic disease.
This study included 234 eyes of 132 boys and 102 girls (age range, 2-18 years; mean age ± standard deviation, 13.50 ± 3.81 years). The patients’ diagnoses were glauco- ma in 21 eyes, suspected glaucoma in 179 eyes, and ocular hypertension in 34 eyes. All patients underwent a complete ophthalmologic examination, including a medical, ocular, and family history; visual acuity testing with refraction;
Humphrey field analyzer testing (Zeiss Humphrey Systems, Dublin, CA, USA) with 24-2 standard achromatic perime- try if possible; intraocular pressure (IOP); dilated slit-lamp stereo biomicroscopy; direct and indirect ophthalmoscopy;
and stereoscopic optic nerve head photography.
Test eyes were classified as glaucomatous based on the following criteria: 1) the diagnosis of glaucoma was based on a reliable field defect in the Humphrey visual field ex-
amination; 2) suspected glaucoma was defined as a vertical cup/disc ratio of >0.6 in the dilated slit-lamp examination with no other abnormal ocular findings; and 3) ocular hy- pertension was defined as an IOP of >21 mmHg and no oth- er abnormal ocular findings.
Stratus OCT
OCT measures the peripapillary RNFL thickness accord- ing to the difference between the temporal delay of backs- cattered light from the RNFL and a reference beam. The RNFL is differentiated from other retinal layers using an edge-detection algorithm. The RNFL thickness is defined as the number of pixels between the anterior and posterior edges of the RNFL. Each resulting image constitutes the RNFL thickness measurements (μm) at 100 points along a 360° circular ring around the optic disk. For this study, three acceptable-quality circular scans of 3.4 mm diameter centered on the optic disk were obtained for each test eye.
This approximate scan diameter was found to be optimal for RNFL analysis in a prototype instrument. The RNFL thickness is presented for each of the four quadrants (su- perior, inferior, nasal, and temporal) in clock h (12 sectors) and as the average RNFL thickness.
Data Analysis and Statistics
The Stratus OCT software (version A4.0.3, Carl Zeiss Meditec Inc.) calculates several parameters that are summa- rized in the Stratus OCT RNFL Thickness Average Anal- ysis Report; these parameters are referred to as summary report parameters in this paper. They include full circle, quadrant, and clock-hour RNFL thickness and eight ‘‘new’’
parameters introduced with the Stratus OCT, namely the Imax/Smax, Smax/Imax, Smax/Tavg, Imax/Tavg, and Smax/Navg ratios; the Max-Min difference; the Smax; and the Imax.
The following analytic steps were taken: (1) correlations between the values of all parameters and the clinical char- acteristics (CD) ratio (vertical [v] and horizontal [h], IOP, and age) were calculated; (2) significantly different values of parameters among patients with glaucoma, suspected glaucoma, and ocular hypertension were identified (in one-
way ANOVA, p < 0.05 indicated a statistically significant difference); (3) significantly different values of parameters between patients with a CD (v) ratio of >0.6 or IOP of
>21 mmHg and other patients were identified (between a CD [v] ratio of >0.6 and an IOP of <21 mmHg and other patients, and between a CD ratio of >0.6 and an IOP of
>21 mmHg and other patients; in the Mann-Whitney U test,
p < 0.05 indicated a statistically significant difference); and (4) receiver operating characteristic (ROC) curves were created using the values collected in steps (1), (2), and (3), and a new discriminant score was obtained by discriminant analysis. Statistical analyses were carried out using SPSS for Windows, version 12 (IBM Corp., Armonk, NY, USA).
Table 1. Patients characteristics and clinical findings
Glaucoma Glaucoma suspect Ocular hypertension
Eyes 21 179 34
Age (years) 10.23 ± 2.85 13.70 ± 3.42 11.35 ± 4.21
Gender (f/m) 10/11 75/104 12/23
Side (r/l) 13/8 73/106 15/19
Refractive error (D) -4.52 ± 2.30 -2.25 ± 3.2 -1.82 ± 1.93
Values are presented as mean ± standard deviation or number.
f/m = female/male; r/l = right/left; D = diopter.
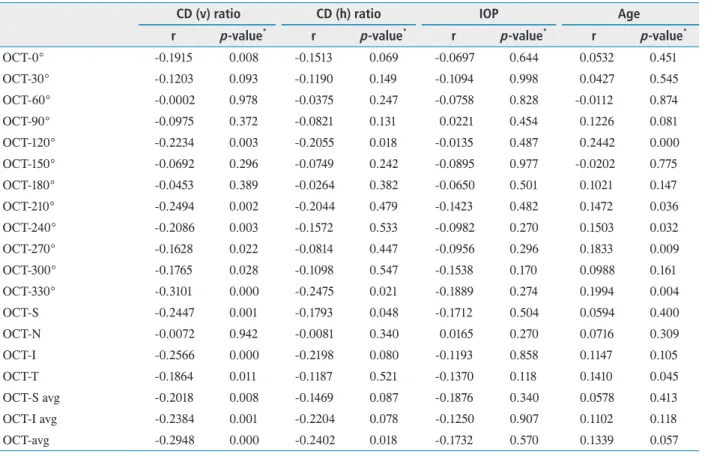
Table 2. Correlation between RNFL thickness and CD (v)/(h) ratio IOP or Age
CD (v) ratio CD (h) ratio IOP Age
r p-value* r p-value* r p-value* r p-value*
OCT-0° -0.1915 0.008 -0.1513 0.069 -0.0697 0.644 0.0532 0.451
OCT-30° -0.1203 0.093 -0.1190 0.149 -0.1094 0.998 0.0427 0.545
OCT-60° -0.0002 0.978 -0.0375 0.247 -0.0758 0.828 -0.0112 0.874
OCT-90° -0.0975 0.372 -0.0821 0.131 0.0221 0.454 0.1226 0.081
OCT-120° -0.2234 0.003 -0.2055 0.018 -0.0135 0.487 0.2442 0.000
OCT-150° -0.0692 0.296 -0.0749 0.242 -0.0895 0.977 -0.0202 0.775
OCT-180° -0.0453 0.389 -0.0264 0.382 -0.0650 0.501 0.1021 0.147
OCT-210° -0.2494 0.002 -0.2044 0.479 -0.1423 0.482 0.1472 0.036
OCT-240° -0.2086 0.003 -0.1572 0.533 -0.0982 0.270 0.1503 0.032
OCT-270° -0.1628 0.022 -0.0814 0.447 -0.0956 0.296 0.1833 0.009
OCT-300° -0.1765 0.028 -0.1098 0.547 -0.1538 0.170 0.0988 0.161
OCT-330° -0.3101 0.000 -0.2475 0.021 -0.1889 0.274 0.1994 0.004
OCT-S -0.2447 0.001 -0.1793 0.048 -0.1712 0.504 0.0594 0.400
OCT-N -0.0072 0.942 -0.0081 0.340 0.0165 0.270 0.0716 0.309
OCT-I -0.2566 0.000 -0.2198 0.080 -0.1193 0.858 0.1147 0.105
OCT-T -0.1864 0.011 -0.1187 0.521 -0.1370 0.118 0.1410 0.045
OCT-S avg -0.2018 0.008 -0.1469 0.087 -0.1876 0.340 0.0578 0.413
OCT-I avg -0.2384 0.001 -0.2204 0.078 -0.1250 0.907 0.1102 0.118
OCT-avg -0.2948 0.000 -0.2402 0.018 -0.1732 0.570 0.1339 0.057
r is correlation coefficient.
RNFL = retinal nerve fiber layer; CD (v) ratio = vertical cup-disc ratio; CD (h) ratio = horizontal cup-disc ratio; IOP = intraocular pressure; S = superior; N = nasal; I = inferior; T = temporal; avg = average.
*Statistical significance was tested by Pearson’s correlation test.
Results
Patient characteristics are shown in Table 1. In the statis- tical analysis of correlations between RNFL thickness and clinical characteristics (vertical CD ratio, horizontal CD ratio, IOP, and age), we found that RNFL thickness was more closely correlated with the vertical CD ratio than with the other parameters (13 of 19 parameters were statistically significant) (Table 2). In the statistical analysis of correla- tions between the RNFL thickness and various parameters among the glaucoma group, suspected glaucoma group, and ocular hypertension group, 12 of 19 parameters showed sta- tistically significant correlations.
The difference in RNFL thickness was statistically signif- icant in 14 of 19 parameters between the group with a CD (v) ratio of >0.6 or IOP of >21 mmHg and the group with other CD (v) ratio and IOP measurements (Table 3). The
difference in RNFL thickness was statistically significant in 3 of 19 parameters between group with a CD (v) ratio of
>0.6 and IOP of >21 mmHg and the group with other CD (v) ratio and IOP measurements (Table 4).
ROC curves were conducted with parameters such as OCT-210°, OCT-270°, OCT-330°, OCT-I, OCT-T, and OCT- avg, which were collected for statistically significant values obtained in the above-described steps (1), (2), and (3). New discriminant scores were finally obtained with OCT-330°
and OCT-avg, which had the two largest areas under the ROC curves and were thought to be the best discrimination parameters.
Discriminant Analysis
The new discriminant score had a sensitivity of 80.2%, specificity of 78.4%, and cut-off value of -10.45. A cut-off value lower than -10.45 indicated a vertical CD ratio of >0.6 Table 3. The difference of RNFL thickness between group of CD (v) ratio >0.6 or IOP >21 mmHg and group of others
Parameter Else CD (v) ratio >0.6 or IOP >21
mmHg p-value*
OCT-0° 132.87 ± 30.13 126.06 ± 33.96 0.1731
OCT-30° 119.17 ± 26.22 112.37 ± 31.79 0.1389
OCT-60° 86.16 ± 21.77 81.69 ± 25.48 0.2283
OCT-90° 61.11 ± 16.35 55.61 ± 16.04 0.0257
OCT-120° 83.87 ± 24.40 72.34 ± 21.69 0.0009
OCT-150° 104.17 ± 26.54 101.50 ± 25.37 0.4941
OCT-180° 141.56 ± 26.60 138.94 ± 29.73 0.5494
OCT-210° 159.71 ± 25.05 148.94 ± 29.60 0.0128
OCT-240° 95.71 ± 27.30 87.57 ± 21.76 0.0394
OCT-270° 73.81 ± 21.46 64.83 ± 18.90 0.0030
OCT-300° 98.27 ± 23.53 88.55 ± 22.25 0.0052
OCT-330° 149.87 ± 22.43 136.40 ± 30.07 0.0005
OCT-S 134.63 ± 21.08 123.41 ± 28.01 0.0019
OCT-N 74.08 ± 16.73 68.18 ± 20.13 0.0433
OCT-I 137.16 ± 16.08 128.63 ± 23.40 0.0030
OCT-T 89.78 ± 20.11 80.56 ± 20.01 0.0028
OCT-S avg 134.68 ± 21.09 123.12 ± 28.99 0.0017
OCT-I avg 137.16 ± 16.08 128.61 ± 25.16 0.0041
OCT-avg 108.09 ± 9.99 100.50 ± 15.74 <0.0001
Values are presented as mean ± standard deviation.
RNFL = retinal nerve fiber layer; CD (v) ratio = vertical cup-disc ratio; IOP = intraocular pressure; OCT = optical coherence tomography; S = superior; N = nasal; I = inferior; T = temporal; avg = average.
*Statistical significance was tested by Mann-Whitney U test.
and it was thought to be a useful index for detection of early glaucomatous change.
Y (vertical CD ratio of ≥0.6) = age + IOP + OCT-330° + OCT-avg
New discriminant score = (-0.316 × age) + (-0.11683 × IOP) + (-0.00914 × OCT-330°)
+ (-0.0246 × OCT-avg)
Discussion
Detection of glaucomatous damage can be problematic, particularly in juveniles, and is typically achieved through observation of the optic nerve head and RNFL and meas- urement of the visual function perimetry. These methods are subjective examinations, however, and cannot provide a reliable early diagnosis.9
OCT is a new and promising technology that allows for precise cross-sectional imaging of the eye. OCT is the optical analog of the ultrasound B scan, providing images with much higher resolution in both the axial and lateral di- mensions.9 OCT scans generate one-dimensional images of the retina, from which the RNFL thickness can be directly measured.10 The automated computer algorithm quantitates the RNFL thickness and the entire retinal thickness as a red and strongly reflected layer at the boundary between the retina and vitreous. It shows the thickness of the superior, inferior, temporal, and nasal quadrants; the clock-hour sec- tions; and the entire retina.10 The measurement technique is relatively objective and highly reproducible in pediatric and young adult patients.
Mrugacz and Bakunowicz-Lazarczyk9 observed a signif- icant reduction in the mean and inferior-quadrant RNFL thickness of patients with juvenile glaucoma. In accord- Table 4. The difference of RNFL thickness between group of CD (v) ratio >0.6 and IOP >21 mmHg, and group of others
Parameter Else CD (v) ratio >0.6
and IOP >21 mmHg p-value*
OCT-0° 129.40 ± 31.12 104.60 ± 54.61 0.1871
OCT-30° 115.73 ± 28.95 90.40 ± 44.90 0.1099
OCT-60° 83.74 ± 24.38 70.20 ± 22.73 0.0874
OCT-90° 57.75 ± 16.06 49.00 ± 19.39 0.0981
OCT-120° 75.94 ± 22.44 75.50 ± 35.60 0.9701
OCT-150° 103.26 ± 24.47 84.30 ± 40.93 0.1794
OCT-180° 140.47 ± 26.99 125.80 ± 52.79 0.4048
OCT-210° 153.66 ± 6.62 125.70 ± 49.62 0.1098
OCT-240° 90.44 ± 22.99 83.50 ± 37.98 0.5805
OCT-270° 68.00 ± 20.15 60.20 ± 18.92 0.2327
OCT-300° 92.71 ± 22.22 69.50 ± 28.60 0.0017
OCT-330° 142.45 ± 26.41 104.60 ± 43.71 0.0231
OCT-S 128.25 ± 24.74 100.70 ± 43.89 0.0795
OCT-N 69.96 ± 18.53 70.70 ± 32.19 0.9444
OCT-I 132.27 ± 20.45 110.22 ± 35.78 0.1028
OCT-T 83.37 ± 19.57 74.22 ± 34.76 0.4320
OCT-S avg 128.08 ± 25.54 100.30 ± 44.27 0.0796
OCT-I avg 132.59 ± 21.44 105.70 ± 36.64 0.0460
OCT-avg 103.94 ± 13.64 86.91 ± 24.01 0.0522
Values are presented as mean ± standard deviation.
RNFL = retinal nerve fiber layer; CD (v) ratio = vertical cup-disc ratio; IOP = intraocular pressure; OCT = optical coherence tomography; S = superior; N = nasal; I = inferior; T = temporal; avg = average.
*Statistical significance was tested by Mann-Whitney U test.
ance with Bowd et al.,11 the mean RNFL thickness and the RNFL thicknesses in the inferior and nasal quadrants were significantly thinner in glaucomatous than in normal eyes.
Ahn et al.10 measured the RNFL thickness in normal Ko- rean children and adolescents with OCT, and this method was applicable to the early diagnosis of glaucoma and to the examination of its progression in both pediatric and adoles- cent patients with glaucoma.
The results of several clinical studies12-14 support the idea that damage to the optic nerve and RNFL can be identi- fied before changes in the visual field. These findings are very important in the examination of children, because determination of the visual field and interpretation of the results may cause a number of problems, and the method and measurements may be more subjective and less reliable than those in older patients. Several investigations have reported that RNFL damage secondary to retinal ganglion cell damage could become an important marker of ocular function impairment15,16 and that such reductions in the RNFL thickness precedes the optic disc changes in patients with glaucoma.17,18
In our study of children and adolescents, we found that the OCT Stratus summary report parameters yielded good diagnostic sensitivity and specificity. In previous studies, however, the inferior quadrant had important parameters associated with the glaucoma status.9,11 Our conclusion differed in that the new discriminate score contained OCT- 330° and OCT-avg. In conclusion, the present results indi- cate that RNFL thickness as measured by OCT is a very useful tool for tracking glaucoma progression and may also be useful for pediatric screening at the population level.
Conflict of Interest Statement
The authors have declared that no conflict of interest ex- ists.
References
1. Kerrigan-Baumrind LA, Quigley HA, Pease ME, et al.
Number of ganglion cells in glaucoma eyes compared with threshold visual field tests in the same persons. Invest
Ophthalmol Vis Sci 2004;41:741-8.
2. Zangwill LM, Williams J, Berry CC, et al. A comparison of optical coherence tomography and retinal nerve fiber layer photography for detection of nerve fiber layer dam- age in glaucoma. Ophthalmology 2000;107:1309-15.
3. Sanchez-Galeana C, Bowd C, Blumenthal EZ, et al. Using optical imaging summary data to detect glaucoma. Oph- thalmology 2001;108:1812-8.
4. Nouri-Mahdavi K, Hoffman D, Tannenbaum DP, et al.
Identifying early glaucoma with optical coherence tomog- raphy. Am J Ophthalmol 2004;137:228-35.
5. Budenz DL, Michael A, Chang RT, et al. Sensitivity and specificity of the stratus OCT for perimetric glaucoma.
Ophthalmology 2005;112:3-9.
6. Huang ML, Chen HY. Development and comparison of automated classifiers for glaucoma diagnosis using Stratus optical coherence tomography. Invest Ophthalmol Vis Sci 2005;46:4121-9.
7. Medeiros FA, Zangwill LM, Bowd C, et al. Evaluation ret- inal nerve fiber layer, optic nerve head, and macular thick- ness measurements for glaucoma detection using optical coherence tomography. Am J Ophthalmol 2005;139:44- 55.
8. Wollstein G, Ishikawa H, Wang J, et al. Comparison of three optical coherence tomography scanning areas for detection of glaucomatous damage. Am J Ophthalmol 2005;139:39-43.
9. Mrugacz M, Bakunowicz-Lazarczyk A. Optical coherence tomography measurement of the retinal nerve fiber layer in normal and juvenile glaucomatous eyes. Ophthalmologica 2005;219:80-5.
10. Ahn HC, Son HW, Kim JS, Lee JH. Quantitative analysis of retinal nerve fiber layer thickness of normal children and adolescents. Korean J Ophthalmol 2005;19:195-200.
11. Bowd C, Weinreb RN, Williams JM, Zangwill LM. The retinal nerve fiber layer thickness in ocular hypertensive, normal, and glaucomatous eyes with optical coherence tomography. Arch Ophthalmol 2000;118:22-6.
12. Schuman JS, Hee MR, Puliafito C, et al. Quantification of nerve fiber layer thickness in normal and glaucomatous eyes using optical coherence tomography. Arch Ophthal- mol 1995;113:586-96.
13. Quigley HA, Dunkelberger GR, Green WR. Retinal ganglion cell atrophy correlated with automated perim- etry in human eyes with glaucoma. Am J Ophthalmol 1989;107:453-64.
14. Zeyen TG, Caprioli J. Progression of disc and field dam- age in early glaucoma. Arch Ophthalmol 1993;111:62-5.
15. Sommer A, Pollack I, Naumence AE. Optic disc param- eters and onset of glaucomatous field loss I. Methods and progressive changes in disc morphology. Arch Ophthalmol 1979;97:1444-8.
16. Pederson JE, Anderson DR. The mode of progressive disc cupping in ocular hypertension and glaucoma. Arch Oph- thalmol 1980;98:490-5.
17. Airaksinen PJ, Alanko HI. Effect of retinal nerve fiber loss on the optic nerve head configuration in early glaucoma.
Graefe’s Arch Clin Exp Opthalmol 1983;220:193-6.
18. Sommer HA, Quigley HA, Robin AL, et al. Evalua- tion of nerve fiber layer assessment. Arch Ophthalmol 1984;102:1766-71.