Asymmetry of Peak Thicknesses between the Superior and Inferior Retinal Nerve Fiber Layers for Early
Glaucoma Detection: A Simple Screening Method
Hyoung Won Bae, Sang Yeop Lee, Sangah Kim, Chan Keum Park, Kwanghyun Lee, Chan Yun Kim, and Gong Je Seong
Department of Ophthalmology, Severance Hospital, Institute of Vision Research, Yonsei University College of Medicine, Seoul, Korea.
Purpose: To assess whether the asymmetry in the peripapillary retinal nerve fiber layer (pRNFL) thickness between superior and inferior hemispheres on optical coherence tomography (OCT) is useful for early detection of glaucoma.
Materials and Methods: The patient population consisted of Training set (a total of 60 subjects with early glaucoma and 59 normal subjects) and Validation set (30 subjects with early glaucoma and 30 normal subjects). Two kinds of ratios were employed to mea- sure the asymmetry between the superior and inferior pRNFL thickness using OCT. One was the ratio of the superior to inferior peak thicknesses (peak pRNFL thickness ratio; PTR), and the other was the ratio of the superior to inferior average thickness (av- erage pRNFL thickness ratio; ATR). The diagnostic abilities of the PTR and ATR were compared to the color code classification in OCT. Using the optimal cut-off values of the PTR and ATR obtained from the Training set, the two ratios were independently vali- dated for diagnostic capability.
Results: For the Training set, the sensitivities/specificities of the PTR, ATR, quadrants color code classification, and clock-hour color code classification were 81.7%/93.2%, 71.7%/74.6%, 75.0%/93.2%, and 75.0%/79.7%, respectively. The PTR showed a better diagnostic performance for early glaucoma detection than the ATR and the clock-hour color code classification in terms of areas under the receiver operating characteristic curves (AUCs) (0.898, 0.765, and 0.773, respectively). For the Validation set, the PTR also showed the best sensitivity and AUC.
Conclusion: The PTR is a simple method with considerable diagnostic ability for early glaucoma detection. It can, therefore, be widely used as a new screening method for early glaucoma.
Key Words: Glaucoma, diagnosis, optical coherence tomography
INTRODUCTION
Glaucoma is a chronic, progressive optic neuropathy with char- acteristic structural changes in the optic nerve head (ONH) and retinal nerve fiber layer (RNFL) caused by loss of retinal
ganglion cells. Although the damage from glaucoma is irre- versible, most glaucoma patients have few symptoms until the advanced stages. Thus, an efficient method for early detection is clinically important in the management of this disorder.
As technology improved, numerous attempts have been made to detect glaucoma in its early stages. Optical coherence to- mography (OCT) is one of these technologies. It has been widely used for glaucoma diagnosis because it allows objective mea- surement of the peripapillary RNFL (pRNFL) thickness with high accuracy.1-5 OCT also provides a color code classification of pRNFL thicknesses, based on the normative group database.
This color coding scheme is relatively intuitive and easy to in- terpret, therefore, many ophthalmologists have used it to dif- ferentiate glaucomatous eyes, which show abnormal coding, from normal eyes. However, several studies have reported that Received: May 22, 2017 Revised: September 1, 2017
Accepted: October 10, 2017
Corresponding author: Dr. Gong Je Seong, Department of Ophthalmology, Yonsei University College of Medicine, 211 Eonju-ro, Gangnam-gu, Seoul 06273, Korea.
Tel: 82-2-2019-3441, Fax: 82-2-3463-1049, E-mail: [email protected]
•The authors have no financial conflicts of interest.
© Copyright: Yonsei University College of Medicine 2018
This is an Open Access article distributed under the terms of the Creative Com- mons Attribution Non-Commercial License (http://creativecommons.org/licenses/
by-nc/4.0) which permits unrestricted non-commercial use, distribution, and repro- duction in any medium, provided the original work is properly cited.
pISSN: 0513-5796 · eISSN: 1976-2437 Yonsei Med J 2018 Jan;59(1):135-140
https://doi.org/10.3349/ymj.2018.59.1.135
false-positive or false-negative color code abnormalities are common because of various factors such as disc size,6,7 refrac- tive errors,8-12 and measurement errors.13,14
In the present study, we developed simple screening meth- ods for detection of glaucoma, based on the asymmetric na- ture of this disorder.1 One method exploits the asymmetry of the peak pRNFL thicknesses between the superior and inferi- or hemispheres, and the other method utilizes the asymmetry of the average pRNFL thicknesses between the superior and inferior quadrants. We evaluated the diagnostic capabilities of the two methods for early detection of glaucoma, and com- pared them to the diagnostic capabilities of the color code clas- sification of the OCT.
MATERIALS AND METHODS
Participants
This study followed the tenets of the Declaration of Helsinki and was approved by the Institutional Review Board of our institute.
The clinical database of the outpatient clinic of Severance Hos- pital at Yonsei University College of Medicine between Janu- ary 2013 and September 2015 was reviewed retrospectively (IRB No. 2015-1229-001).
To evaluate the diagnostic abilities of the two methods for early glaucoma detection, subjects with early glaucoma who met the inclusion criteria and age-matched normal subjects were recruited from January 2013 to December 2014 (Training set). Glaucoma was identified by two independent glaucoma specialists (HWB and CYK) based on the typical appearance of a glaucomatous ONH (cup/disc ratio >0.7, cup/disc ratio asym- metry >0.2, diffuse or focal neuroretinal rim thinning, disc hem- orrhage, or vertical elongation of the optic cup) and RNFL de- fects using red-free RNFL photography. Glaucoma patients were included only when there was an agreement on the diag- nosis between the two specialists. Two consecutive reliable vi- sual field (VF) tests (Humphrey Visual Field Analyzer; 24-2 SITA Standard algorithm; Carl Zeiss Meditec, Dublin, CA, USA) with mean deviation (MD) >-6 dB were also used to identify the early stages of glaucoma. VF defects were not used to define glaucoma in order to include eyes with preperimetric glauco- ma, which is thought to be the earliest stage of glaucoma. In other words, subjects with preperimetric glaucoma were also enrolled in this study. Age-matched normal subjects were re- cruited from subjects who had regular checkups without any specific ophthalmic disorders. Normal control subjects had normal VF results without any glaucomatous ONH appear- ances or RNFL defects, and had an intraocular pressure (IOP)
≤21 mm Hg in both eyes.
An independent group (Validation set) was consecutively enrolled from January to September of 2015 to validate the di- agnostic abilities of the new methods; the cut-off values from the Training set were used for this analysis. Early glaucoma
subjects and age-matched normal subjects for the Validation set were recruited following the same definition described above.
Patients with the following characteristics were excluded from the study: <20 years of age, uncertain optic neuropathy not defined as glaucoma, unreliable VF tests (more than 33%
fixation losses or false-negative errors, or more than 15% false- positive errors), OCT (Cirrus HD-OCT; Carl Zeiss Meditec) re- sults with decentering of ONH or signal strength <6, or those who had another intraocular disease affecting OCT results such as diabetic macular edema, retinal vein occlusion, or epiretinal membrane. One eye was randomly selected when both eyes of the same patient were eligible.
Ophthalmic examinations
All subjects underwent a complete ophthalmic examination including best-corrected visual acuity, IOP, autorefraction kera- tometry (RK-3; Canon, Lake Success, NY, USA), slit-lamp bio- microscopy, dilated-fundus examination, color disc photog- raphy (Carl Zeiss Meditec), red-free RNFL photography (Carl Zeiss Meditec, Jena, Germany), and spectral domain OCT. Axial length (AL) was measured using an IOL Master ocular biomet- ric device (Carl Zeiss Meditec), and the VF test was also per- formed for all patients.
Peak pRNFL thickness ratio, average pRNFL thickness ratio, and color code abnormalities using OCT
Two new methods were developed to evaluate the asymmetry of the superior and inferior pRNFL thicknesses using OCT.
One method utilized the ratio between the two peak pRNFL thicknesses of the superior and inferior hemispheres. From the temporal-superior-nasal-inferior-temporal RNFL thickness map of OCT, the peak thickness of pRNFL in the superior and inferior hemispheres was measured in pixels using ImageJ software, version 1.48 (http://imagej.nih.gov/ij/; National In- stitutes of Health, Bethesda, MD, USA). Then, the shorter peak thickness was divided by the taller peak thickness, and the ra- tio of those two peak pRNFL thicknesses was named as the peak pRNFL thickness ratio (PTR) (Fig. 1A). The other method used the average pRNFL thicknesses of the superior and infe- rior quadrants from the quadrant map of OCT. The average thickness of the thinner quadrant was divided by that of the thicker quadrant, and the ratio was named as the average pRNFL thickness ratio (ATR) (Fig. 1B).
On the quadrants and clock-hour maps of Cirrus HD-OCT (Carl Zeiss Meditec), the pRNFL thickness is displayed in a color code based on a comparison with the normative data- base. The normal ranges were coded in green while abnormal ranges at the 5% level were colored in yellow, and abnormal ranges at the 1% level are marked in red. We considered the color code abnormal when one or more yellow or red sectors were present on the quadrants and clock-hour maps.
Statistical analysis
The optimal sample size was determined using PASS, version 12.0 (NCSS, LLC, Kaysville, UT, USA) based on the assumption that a new screening method has an area under the receiver operating characteristic (ROC) curve (AUC) of approximately 0.85.15 When the ratio of sample sizes between glaucoma and normal cases was set at 1, a minimum of 58 glaucoma subjects and 58 normal subjects were required to detect a 0.15 differ- ence in AUCs at values >0.7 (moderate level) with a statistical power of 90% and a type I error of 5%. In addition, a minimum of 25 subjects with glaucoma and 25 normal subjects were re- quired for validation to maintain the Training set and the Vali- dation set at a ratio of 7:3.
Basic characteristics were compared between the glaucoma and normal groups using an independent t-test for continuous variables and chi-square test for categorical variables. ROC curves were constructed to assess the ability of each method to detect patients with early glaucoma and determine the op- timal cut-off value for the PTR and ATR. AUCs were also used to represent the diagnostic ability of each method and were compared using the DeLong method. The sensitivities and
specificities were compared using the McNemar test. All sta- tistical analyses were performed using SPSS, version 20 (IBM Corp., Armonk, NY, USA) and MedCalc, version 11.1.1.0 (Med- Calc, Marakierke, Belgium).
RESULTS
A total of 60 subjects with early glaucoma and 59 normal sub- jects were enrolled for the Training set, and 60 subjects (30 early glaucoma subjects and 30 normal controls) were en- rolled independently for the Validation set. Table 1 shows the basic characteristics of all subjects. For both the Training and Validation sets, there were no significant differences in age, gender, or AL between the glaucoma and normal subjects.
However, glaucoma subjects exhibited significantly worse MD and pattern standard deviation than the normal subjects (p<0.001), and the average RNFL thickness, mean PTR, and mean ATR were significantly lower in subjects with glaucoma than in normal subjects (p<0.001).
The ROC curves of the PTR and ATR were plotted, and their Fig. 1. PTR and ATR. (A) Each superior and inferior peak heights of the pRNFL thickness were measured independently in pixels, and the shorter one was divided by the longer one. PTR=α (the shorter pRNFL peak height)/β (the longer pRNFL peak height). (B) Average pRNFL thicknesses of quadrant maps were used to calculate ATR. ATR=S (the thinner quadrant pRNFL average thickness)/I (the thicker quadrant pRNFL average thickness). pRNFL, peri- papillary retinal nerve fiber layer; PTR, peak pRNFL thickness ratio; ATR, average pRNFL thickness ratio.
200
100
0
μm
0 30 60 90 120 150 180 210 240
Temporal Superior Nasal Inferior Temporal
75 56
107
A B 112
Table 1. Characteristics of Included Subjects
Training set Validation set
Glaucoma Normal p value Glaucoma Normal p value
Number 60 59 30 30
Age (years)* 59.07±12.15 59.19±13.11 0.216† 60.20±11.87 60.27±11.10 0.982†
Sex (M:F) 35:25 30:29 0.412‡ 12:18 18:12 0.121‡
AL (mm)* 24.51±1.70 24.20±1.35 0.285† 24.28±1.66 24.17±1.07 0.762†
MD (dB)* -2.65±1.50 -0.34±1.21 <0.001† -2.30±1.78 -0.42±1.00 <0.001†
PSD (dB)* 3.51±2.07 1.54±0.43 <0.001† 3.53±2.41 1.59±0.72 <0.001†
IOP (mm Hg) 15.47±3.90 14.15±2.95 0.041† 14.10±2.70 12.97±2.37 0.089†
CCT (µm) 542.39±34.14 542.36±35.50 0.997† 534.57±29.52 536.72±40.18 0.815†
Average RNFL thickness (µm) 76.92±8.82 94.32±7.53 <0.001† 80.03±9.64 95.30±6.73 <0.001†
PTR* 0.80±0.11 0.94±0.04 <0.001† 0.76±0.11 0.94±0.05 <0.001†
ATR* 0.83±0.11 0.93±0.05 <0.001† 0.81±0.14 0.93±0.06 <0.001†
M, male; F, female; AL, axial length; MD, mean deviation; PSD, pattern standard deviation; IOP, intraocular pressure; CCT, central corneal thickness; RNFL, retinal nerve fiber layer; PTR, peak peripapillary RNFL thickness ratio; ATR, average peripapillary RNFL thickness ratio.
*Presented as the mean±standard deviation, †p-values were derived from an independent t test, ‡p-values were derived from the chi-square test.
AUCs and cut-off values were determined (Fig. 2). For the PTR, the AUC was 0.898 and the optimal cut-off value was ≤0.8692.
For the ATR, the AUC was 0.765 and the cut-off value was 100
80
60
40 20
0
Sensitivity
0 20 40 60 80 100
100-specificity
PTR ATR
Fig. 2. Comparison of receiver operating characteristic curves among the PTR and ATR for the Training set. pRNFL, peripapillary retinal nerve fiber layer; PTR, peak pRNFL thickness ratio; ATR, average pRNFL thickness ratio.
Table 2. The Results of AUCs for the PTR, ATR, and Color Code Abnormalities for the Training Set
AUC SE p value* p value*
PTR 0.898 0.030 - 0.004‡
ATR 0.765 0.045 0.004† -
Color code on quadrants map 0.841 0.033 0.176† 0.129‡
Color code on clock-hour map 0.773 0.039 0.008† 0.879‡
AUC, area under the receiver operating characteristic curve; pRNFL, peripapillary retinal nerve fiber layer; SE, standard error; PTR, peak pRNFL thickness ratio;
ATR, average pRNFL thickness ratio.
*p-values were derived using the DeLong method, †p-values were compared to the AUC of the PTR, ‡p-values were compared to the AUC of the ATR.
Table 3. Sensitivities and Specificities of the PTR, ATR, and Color Code Abnormalities for the Training Set
Sensitivity (95% CI) Specificity (95% CI) PPV (95% CI) NPV (95% CI)
PTR 81.7 (69.6–90.5) 93.2 (83.5–98.1) 92.5 (81.8–97.9) 83.3 (72.1–91.4)
ATR 71.7 (58.6–82.6) 74.6 (61.6–85.0) 74.1 (61.0–84.7) 72.1 (59.2–82.9)
Color code on the quadrants map 75.0 (62.1–85.3) 93.2 (83.5–98.1) 91.8 (80.4–97.7) 78.6 (67.1–87.5) Color code on the clock-hour map 75.0 (62.1–85.3) 79.7 (67.2–89.0) 79.0 (66.1–88.6) 75.8 (63.3–85.8) pRNFL, peripapillary retinal nerve fiber layer; CI, confidence interval; PPV, positive predictive value; NPV, negative predictive value; PTR, peak pRNFL thickness ratio; ATR, average pRNFL thickness ratio.
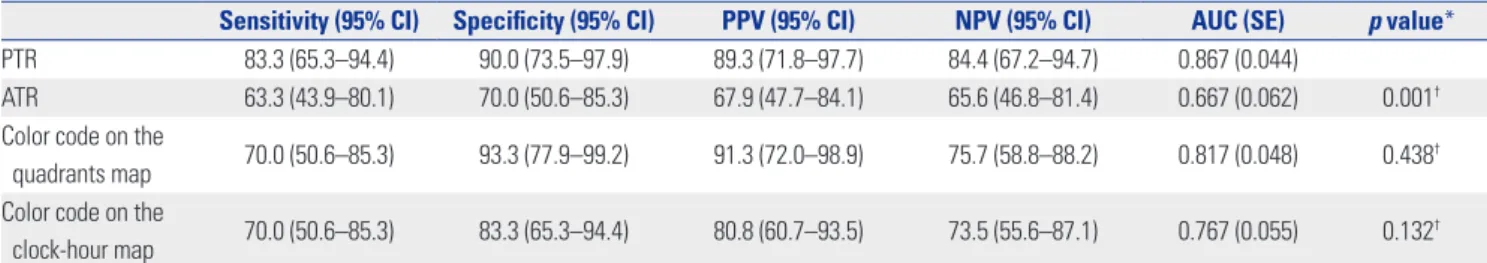
Table 4. Sensitivities, Specificities, AUCs of the PTR, ATR, and Color Code Abnormalities for the Validation Set
Sensitivity (95% CI) Specificity (95% CI) PPV (95% CI) NPV (95% CI) AUC (SE) p value*
PTR 83.3 (65.3–94.4) 90.0 (73.5–97.9) 89.3 (71.8–97.7) 84.4 (67.2–94.7) 0.867 (0.044)
ATR 63.3 (43.9–80.1) 70.0 (50.6–85.3) 67.9 (47.7–84.1) 65.6 (46.8–81.4) 0.667 (0.062) 0.001†
Color code on the
quadrants map 70.0 (50.6–85.3) 93.3 (77.9–99.2) 91.3 (72.0–98.9) 75.7 (58.8–88.2) 0.817 (0.048) 0.438† Color code on the
clock-hour map 70.0 (50.6–85.3) 83.3 (65.3–94.4) 80.8 (60.7–93.5) 73.5 (55.6–87.1) 0.767 (0.055) 0.132† AUC, area under the receiver operating characteristic curves; pRNFL, peripapillary retinal nerve fiber layer; CI, confidence interval; PPV, positive predictive value;
NPV, negative predictive value; SE, standard error; PTR, peak pRNFL thickness ratio; ATR, average pRNFL thickness ratio.
*p-values were derived using the DeLong method, †p-values were compared to the AUC of the PTR.
≤0.8934. When the AUCs were compared, the PTR showed significantly better diagnostic ability than the ATR and the clock-hour map, while the ATR did not show better diagnostic ability than color code classifications (Table 2). The sensitivity, specificity, positive predictive value (PPV), and negative pre- dictive value (NPV), shown in Table 3, indicate that of each method. The PTR was superior, particularly in terms of sensi- tivity, although there were no statistically significant differ- ences (data not shown).
Using the cut-off values obtained from the Training set, the diagnostic abilities of the PTR and ATR for the Validation set were confirmed. Although the sensitivities, specificities, and AUCs of the PTR and ATR were slightly lower when using the cut-off values, the overall diagnostic performances of the PTR and ATR were similar to those of the Training set. The PTR also proved to be superior in diagnostic ability, as shown in sensi- tivity, NPV, and AUC for the Validation set (Table 4).
DISCUSSION
This study developed a simple screening method that could easily be used by general ophthalmologists using OCT. To over-
come the drawbacks of the color code classification, which is widely used but is relatively inaccurate, we utilized the asym- metric nature of damage to the superior and inferior RNFL dur- ing the early stages of glaucoma.1 In our analysis, the PTR was found to potentially have a notable diagnostic value in early de- tection of glaucoma. The AUC of the PTR was high at approxi- mately 0.9, and the optimal cut-off value of the PTR was ap- proximately 0.87.
The use of asymmetry in glaucomatous damage has a clinical advantage because it largely reduces the influence of interin- dividual variation in factors such as age, gender, race, and several systemic factors. In addition, the asymmetry between the superior and inferior areas in the eye is less affected also by disc size, AL, and retinal vessel position. The glaucoma hemifield test of standard automated perimetry utilizes the asymmetry in sensitivity between the superior and inferior halves for glaucoma detection,16,17 and there have been several attempts to detect early glaucoma, based on the asymmetry be- tween the superior and inferior hemispheres using OCT.18-22 Sullivan-Mee, et al.18 investigated the inter- and intra-eye asym- metries in the pRNFL and macular thickness in early glaucoma, and reported that intra-eye macular thickness asymmetry was one of the most useful parameters for the detection of early glaucoma, Um, et al.21 also reported that asymmetry in hemi- field macular thickness could be an early indicator of glauco- matous damage, and Yamada, et al.22 reported that asymme- try in the ganglion cell layer showed the best diagnostic results for early glaucoma detection. Most these previous studies used the asymmetry of macular thickness rather than the pRN- FL thickness, because there is less variability in the former.
However, the use of asymmetry in macular thickness also has its limitations. First, the use of macular thickness asymmetry is limited when there is concurrent macular disease. As glau- coma is common in older patients, many glaucoma patients have concurrent macular disease. Second, damage outside the macular area may not be detected by macular analysis. How- ever, to the best of our knowledge, only one study has reported so far on the diagnostic ability of asymmetry in pRNFL thick- ness between the superior and inferior areas.18 In contrary to our results, the pRNFL thickness asymmetry in this study showed a poor diagnostic ability when measured with AUC.
This discrepancy could be explained by some methodological differences. First, we calculated the ratio of the superior to in- ferior pRNFL thicknesses while the previous study used the direct differences in thicknesses. It is quite likely that a ratio reflects the asymmetry better, especially in those eyes with thin pRNFL. Second, we evaluated the peak pRNFL thickness as well as the average pRNFL thickness. While the method utilizing the asymmetry in the average thickness also showed a poor diagnostic ability, the use of the peak thickness asym- metry was found to have a better diagnostic value.
The RNFL consists of ganglion cell axons, and axons from peripapillary ganglion cells run more superficially (close to the
vitreous) and occupy a more central portion of the ONH than those from peripheral ganglion cells.23 Considering that glau- comatous ONH damage (such as increased cup/disc ratio, notching, and rim thinning) progresses outward from the cen- ter, more superficial pRNFL might be damaged earlier in the progression of glaucoma. In a recent study with a rat model of glaucoma, early distortion of the axonal cytoskeleton was iden- tified near the RNFL surface.24 Although microscopic damage at the RNFL surface may not affect the RNFL thickness and could occur at any part of the RNFL, peak pRNFL thickness is likely to be the best indicator of any subtle change in RNFL.
Moreover, an asymmetric change in pRNFL thickness might be present very early on regardless of whether the RNFL dam- age manifests as localized or diffuse change as disease pro- gresses. Therefore, peak pRNFL thickness might be more sen- sitive to early glaucomatous damage than the average thickness as assessed by OCT. In our study, the PTR was superior to the ATR in its ability to diagnose early glaucoma. However, to the best of our knowledge, no previous studies have examined changes in peak pRNFL thicknesses in glaucoma, while nu- merous studies have investigated the association between glau- coma and average pRNFL thickness. Therefore, further inves- tigations are needed to confirm the advantages of using peak pRNFL thickness in the detection of glaucoma.
The limitations of this study are as follows. First, the subjects were studied retrospectively and selection bias cannot fully be excluded. Nevertheless, we tried to minimize the drawback of a retrospective design by recruiting another independent group for validation. Second, because this study was performed only with Korean participants, we cannot exclude the possi- bility of ethnic differences. Third, the sample size was relatively small. Therefore, we calculated the optimal sample size to achieve sufficient statistical power and enrolled more subjects than the optimal sample number. Lastly, we could not provide information on refractive errors, because subjects who had undergone previous cataract surgery or refractive surgery were also included in this study. Instead, we used AL to evalu- ate the degree of myopia. Further studies that include data on refractive errors may be helpful in evaluating the performance of PTR in subjects with myopia.
In conclusion, the PTR is a novel, simple, and accurate meth- od for diagnosis of early glaucoma. The PTR, together with other diagnostic tools, will improve the detection of early glau- coma in clinical practice, particularly when used by general ophthalmologists.
ACKNOWLEDGEMENTS
The authors are grateful to Hye Sun Lee (Department of Re- search Affairs, Biostatistics Collaboration Unit, Yonsei Univer- sity College of Medicine, Seoul, Republic of Korea) and Dong- Su Jang (Medical Illustrator, Medical Research Support Section, Yonsei University College of Medicine, Seoul, Republic of Ko-
rea) for their help with the statistics and figures, respectively.
ORCID
Hyoung Won Bae https://orcid.org/0000-0002-8421-5636 Gong Je Seong https://orcid.org/0000-0002-5456-4296
REFERENCES
1. Medeiros FA, Zangwill LM, Bowd C, Vessani RM, Susanna R Jr, Weinreb RN. Evaluation of retinal nerve fiber layer, optic nerve head, and macular thickness measurements for glaucoma detec- tion using optical coherence tomography. Am J Ophthalmol 2005;
139:44-55.
2. Wollstein G, Ishikawa H, Wang J, Beaton SA, Schuman JS. Compar- ison of three optical coherence tomography scanning areas for detection of glaucomatous damage. Am J Ophthalmol 2005;139:
39-43.
3. Hougaard JL, Heijl A, Bengtsson B. Glaucoma detection by Stra- tus OCT. J Glaucoma 2007;16:302-6.
4. Parikh RS, Parikh S, Sekhar GC, Kumar RS, Prabakaran S, Babu JG, et al. Diagnostic capability of optical coherence tomography (Stratus OCT 3) in early glaucoma. Ophthalmology 2007;114:
2238-43.
5. Nouri-Mahdavi K, Nikkhou K, Hoffman DC, Law SK, Caprioli J.
Detection of early glaucoma with optical coherence tomography (StratusOCT). J Glaucomas 2008;17:183-8.
6. Bowd C, Zangwill LM, Blumenthal EZ, Vasile C, Boehm AG, Gokhale PA, et al. Imaging of the optic disc and retinal nerve fiber layer: the effects of age, optic disc area, refractive error, and gen- der. J Opt Soc Am A Opt Image Sci Vis 2002;19:197-207.
7. Savini G, Zanini M, Carelli V, Sadun AA, Ross-Cisneros FN, Bar- boni P. Correlation between retinal nerve fibre layer thickness and optic nerve head size: an optical coherence tomography study. Br J Ophthalmol 2005;89:489-92.
8. Hougaard JL, Ostenfeld C, Heijl A, Bengtsson B. Modelling the normal retinal nerve fibre layer thickness as measured by Stratus optical coherence tomography. Graefes Arch Clin Exp Ophthal- mol 2006;244:1607-14.
9. Kim MJ, Lee EJ, Kim TW. Peripapillary retinal nerve fibre layer thickness profile in subjects with myopia measured using the Stratus optical coherence tomography. Br J Ophthalmol 2010;94:
115-20.
10. Leung CK, Mohamed S, Leung KS, Cheung CY, Chan SL, Cheng DK, et al. Retinal nerve fiber layer measurements in myopia: an optical coherence tomography study. Invest Ophthalmol Vis Sci 2006;47:5171-6.
11. Leung MM, Huang RY, Lam AK. Retinal nerve fiber layer thick- ness in normal Hong Kong chinese children measured with opti- cal coherence tomography. J Glaucoma 2010;19:95-9.
12. Vernon SA, Rotchford AP, Negi A, Ryatt S, Tattersal C. Peripapil- lary retinal nerve fibre layer thickness in highly myopic Caucasians as measured by Stratus optical coherence tomography. Br J Oph- thalmol 2008;92:1076-80.
13. Budenz DL, Chang RT, Huang X, Knighton RW, Tielsch JM. Re- producibility of retinal nerve fiber thickness measurements using the stratus OCT in normal and glaucomatous eyes. Invest Ophthal- mol Vis Sci 2005;46:2440-3.
14. Paunescu LA, Schuman JS, Price LL, Stark PC, Beaton S, Ishikawa H, et al. Reproducibility of nerve fiber thickness, macular thick- ness, and optic nerve head measurements using StratusOCT. In- vest Ophthalmol Vis Sci 2004;45:1716-24.
15. Akashi A, Kanamori A, Nakamura M, Fujihara M, Yamada Y, Negi A. Comparative assessment for the ability of Cirrus, RTVue, and 3D-OCT to diagnose glaucoma. Invest Ophthalmol Vis Sci 2013;
54:4478-84.
16. Susanna R Jr, Nicolela MT, Soriano DS, Carvalho C. Automated perimetry: a study of the glaucoma hemifield test for the detection of early glaucomatous visual field loss. J Glaucoma 1994;3:12-6.
17. Asman P, Heijl A. Evaluation of methods for automated Hemifield analysis in perimetry. Arch Ophthalmol 1992;110:820-6.
18. Sullivan-Mee M, Ruegg CC, Pensyl D, Halverson K, Qualls C. Diag- nostic precision of retinal nerve fiber layer and macular thickness asymmetry parameters for identifying early primary open-angle glaucoma. Am J Ophthalmol 2013;156:567-77.
19. Seo JH, Kim TW, Weinreb RN, Park KH, Kim SH, Kim DM. Detec- tion of localized retinal nerve fiber layer defects with posterior pole asymmetry analysis of spectral domain optical coherence tomog- raphy. Invest Ophthalmol Vis Sci 2012;53:4347-53.
20. Kawaguchi C, Nakatani Y, Ohkubo S, Higashide T, Kawaguchi I, Sugiyama K. Structural and functional assessment by hemispher- ic asymmetry testing of the macular region in preperimetric glau- coma. Jpn J Ophthalmol 2014;58:197-204.
21. Um TW, Sung KR, Wollstein G, Yun SC, Na JH, Schuman JS. Asym- metry in hemifield macular thickness as an early indicator of glau- comatous change. Invest Ophthalmol Vis Sci 2012;53:1139-44.
22. Yamada H, Hangai M, Nakano N, Takayama K, Kimura Y, Miyake M, et al. Asymmetry analysis of macular inner retinal layers for glaucoma diagnosis. Am J Ophthalmol 2014;158:1318-29.
23. Minckler DS. The organization of nerve fiber bundles in the pri- mate optic nerve head. Arch Ophthalmol 1980;98:1630-6.
24. Huang X, Kong W, Zhou Y, Gregori G. Distortion of axonal cyto- skeleton: an early sign of glaucomatous damage. Invest Ophthal- mol Vis Sci 2011;52:2879-88.