Abstract: Hydrographic data obtained from several ship experiments have shown that internal waves are frequently observed in the East (Japan) Sea, mostly in the continental slopes located along the western side of the East Sea. It is well known that oceanic internal waves can be detected well in synthetic aperture radar (SAR) images. Interactions between surface capillary-gravity waves and horizontally varying surface currents induced by internal waves produce variations in sea surface roughness which can be detected by SAR. C-band SAR images from ERS, ENVISAT ASAR and RADARSAT have been used to study the characteristics of internal waves in the East Sea. The observed properties of internal waves from many SAR images were compared and verified from in-situ measurements and theories.
Keywords: Internal Wave, SAR, East Sea.
1. Introduction
Internal (solitary) waves are an important small scale oceanographic phenomenon. They provide a mechanism to move (tidal) energy into the shorter wavelengths of the wave spectrum. The shoaling and breaking of internal waves is important to biological systems, providing nutrient mixing and sediment transport. It is well known that Synthetic Aperture Radar (SAR) is a versatile all weather instrument for measuring sea surface roughness that can be modulated by surface current variations. These surface current variations can be generated by oceanic phenomena such as internal waves or submarine topography. SAR images are often used to improve our understanding of internal wave generation and evolution because they cover such a large area of the ocean’s surface, several hundreds of kilometers on the side. Short period internal solitary waves have already been extensively observed and studied in the South China Sea [1][2], Straits of Gibraltar [3], Strait of Messina [4], and many other seas [5]-[7]. These studies demonstrate that they usually originate from tidal flow over topographic features such as shelf breaks or sills in a stratified ocean [8]-[11].
The East (Japan) Sea is a semi-enclosed deep basin surrounded by Korea, Japan and Russia, which is connected to the Pacific Ocean through only few shallow and narrow straits (Fig. 1). The East Sea which has relatively uniform slope close to the coast, is known for high spatial-temporal variability of current and hydrographic conditions. A typical hydrographical feature in this area is represented by the persistent existence of the cold water band over the continental shelf and slope along
the coast. And it is well known that sharp vertical density gradients exist in the sea. Therefore we can guess that internal waves may exist in the East Sea. In spite of the importance of internal waves in shallow-water coastal oceanography, the observation and study of internal waves in the East Sea was rare due to lack of measurement. In this study, the observation results of internal waves in the East Sea using various SAR sensors were presented.
2. SAR acquisition
In order to study the characteristics of internal waves generated in the East Sea, Both SAR observations and in- situ measurements were carried out. The currently operational SAR satellites are ERS-2, RADARSAT and ENVISAT, which all use C-band (5.3 GHz frequency) and are in sun-synchronous orbit. To observe the evolution of internal waves, the SAR image acquisitions were concentrated in the western part of the East Sea during the field experiments. More than 140 SAR images including ERS-1/2 quick look images, RADARSAT and ENVISAT ASAR [Advanced Synthetic Aperture Radar] images, were used to study internal waves. These SAR images were absolutely calibrated and geo-coded to extract
Study of the Characteristics of Internal Waves in the East (Japan) Sea by Synthetic Aperture Radar - ERS-1/2,
RADARSAT, and ENVISAT ASAR
Duk-jin Kim and Wooil M. Moon
ESI3 Laboratory, School of Earth and Environmental Sciences, Seoul National University, Seoul 151-742, Korea [email protected], [email protected]
Fig. 1. The location of East (Japan) Sea. The red box represents field experiment sites.
quantitative information of the wave signatures [12]-[14].
3. Imaging mechanisms of internal waves
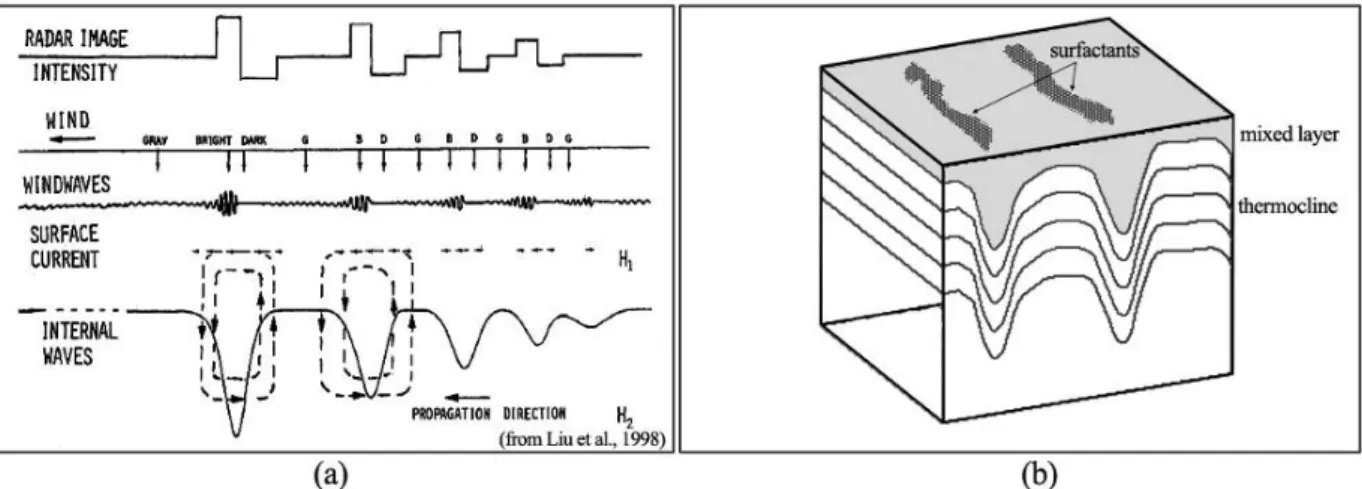
It is well known that oceanic internal waves can be detected in SAR images. Since the current variations induced by internal waves can influence the distribution of radar Bragg scattering waves, internal waves in the ocean can be imaged by SAR when they affect local velocities at the sea surface (Fig. 2). When internal wave amplitudes are sufficiently large, the local sea surface roughness is modulated by the hydrodynamic variation of surface waves (wave-current interactions) [1][15]. In this mechanism, the convergent zone may represent bright bands in SAR image. However on some occasions, they are seen as dark bands in high-frequency SAR images presumably in coastal waters due to the wave damping caused by surfactant films on the sea surface [6].
4. Observation results
Fig. 3(a) shows a RADARSAT image of typical rank- ordered packets of short-period internal waves off the coast of Korea propagating westward to the coast. The internal wave signatures have a bright front signature against a darker sea, which can be interpreted depression type internal solitary wave. The depression type internal waves can be identified as a bright band followed immediately by a dark band as induced by the surface current. If the SAR surface signatures of the internal waves were caused by surface surfactants induced by depression type internal waves, the wave bands may be different [1]. Fig. 3(b) shows internal wave packets which were not rank-ordered and single long solitary internal wave. Special kinds of internal waves such as onshore and offshore-traveling internal waves which were few reported any other seas, were observed from ENVISAT ASAR
image in the mid-east sea (Fig. 4(a)). Large scale internal waves off the GoSeong City propagating offshore direction were also observed (Fig. 4(b)). The scales of the internal wave train are about 27 km long (L) and 105 km wide (W).
In general, the internal solitary waves have wavelengths
Fig. 2. SAR imaging mechanisms of internal waves. (a) Interaction between surface capillary-gravity waves and horizontally varying surface currents induced by internal solitary wave produce variations in sea surface roughness which can be detected by SAR. In this mechanism, the convergent zone may represent bright bands in SAR image. (b) However on some occasions, they are seen as dark bands in high-frequency SAR images presumably in coastal waters due to surfactant films on the sea surface.
(a)
(b)
Fig. 3. Examples of short-period internal waves observed in the East Sea. (a) RADARSAT wide mode image collected off the GangNeung City at June 4, 2004. (b) RADARSAT scanSAR mode image collected off the east coast of Korea at August 18, 1997.
on the order of a few hundred meters, with the internal wave packets being separated by several kilometers.
These short-period internal waves are frequently observed
on the East Sea on continental shelf during the summer season due to the density stratification of the water. More than 140 SAR images including ERS-1/2 quick look images, RADARSAT and ENVISAT ASAR images mostly acquired over the western part of East Sea, were analyzed to obtain typical scales of short-period internal waves (Fig. 5). Common internal wave trains found in SAR images of East Sea have a relative difference in pixel value of 7 dB between crest and trough. Such wave trains are typically 43 km wide (W), 9 km long (L) and 1.5 km of the first wavelength (λ). If the generation frequency of internal waves in the East Sea (by tidal frequency or near- inertial frequency) is known, their propagation speed may be estimated from the average distance between the internal wave trains (D). Most of the internal solitary waves observed in SAR images were located in the continental shelf or slope of the western part of East (Japan) Sea and generated during summer season due to the density stratification of the water.
5. Conclusion and Discussion
In this study, the observation results of internal waves in the East Sea were presented. Typical scales of short- period internal waves observed in the East Sea were measured from more than 140 SAR images including ERS-1/2 quick look images, RADARSAT and ENVISAT ASAR images. The average scale of internal waves is 43 km wide, 9 km long and 1.5 km of the first wavelength.
Further study is needed to identify and verify the 3-D structure of internal waves using hydrographic data.
(a) (b)
Fig. 5. Distributions and scales of internal waves in the East Sea. (a) Most of the internal solitary waves observed in SAR images were located in the continental shelf or slope of the western part of East Sea and generated during summer season due to the density stratification of the water. (b) Definitions of mathematical quantities for internal waves (upper) and typical scales for internal waves in the East Sea (lower). The values in parenthesis are average scales of each quantity.
(a)
(b)
Fig. 4. ENVISAT ASAR wide swath mode images showing internal waves in the East Sea. (a) Onshore and offshore traveling internal waves. (b) Large scale internal solitary waves propagating offshore direction. The ENVISAT ASAR image was collected at September 13, 2003. Right figures show hydrographic conditions (temperature and salinity structures) during SAR acquisition.
Acknowledgments
The ENVISAT ASAR data used in this research were provided by the European Space Agency (ESA) Research Agreement (#797). The author (D. Kim) was supported by the BK 21 program through the School of the Earth and Environmental Sciences (SEES), Seoul National University. This research is partially supported from a NSERC of Canada Discovery Grant (#7400) to Wooil M.
Moon and from the KEOC and KISTEP, Korea.
References
[1] Liu, A. K., Y. S. Chang, M. Hsu, and N. K. Liang, 1998.
Evolution of nonlinear internal waves in the East and South China Seas, J. Geophys. Res., 103(C4): 7995-8008.
[2] Zhao, Z., V. V. Klemas, Q. Zheng, and X. Yan, 2003.
Satellite observation of internal solitary waves converting
polarity, Geophys. Res. Lett., 30,
doi:10.1029/2003GL018286.
[3] Brandt, P., W. Alpers, and J. O. Backhaus, 1996. Study of the generation and propagation of internal waves in the Strait of Gibraltar using a numerical model and synthetic aperture radar images of the European ERS 1 satellite, J.
Geophys. Res., 101(C6): 14237-14252.
[4] Brandt, P., R. Romeiser, and A. Rubino, 1999. On the determination of characteristics of the interior ocean dynamics from radar signatures of internal solitary waves, J.
Geophys. Res., 104(C12): 30039-30045.
[5] Apel, J. R., J. R. Holbrook, A. K. Liu, and J. J. Tsai, 1985.
The Sulu Sea Internal Soliton Experiment, J. Phys.
Oceanogr., 15: 1625-1651.
[6] da Silva, J. C. B., S. A. Ermakov, I. S. Robinson, D. R. G.
Jeans, and S. V. Kijashko, 1998. Role of surface films in ERS SAR signatures of internal waves on the shelf:
1.Short-period internal waves, J. Geophys. Res., 103(C4):
8009-8031.
[7] Porter, D. L., and D. R. Thompson, W. Alpers, and R.
Romeiser, 2001. Remotely sensed ocean observations of the Coastal Mixing and Optics site from synthetic aperture radars and advanced very high resolution radiometers, J.
Geophys. Res., 106(C5): 9623-9638.
[8] Lamb, K.G., 1994. Numerical experiments of internal wave generation by strong tidal flow across a finite amplitude bank edge, J. Geophys. Res., 99(C1): 843-864.
[9] Farmer, D. M., and L. Armi, 1999. The generation and trapping of internal solitary waves over topography, Science, 283: 188-190.
[10] Colosi, J. A., R. C. Beardsley, J. F. Lynch, G. Gawarkiewicz, C. Chiu, and A. Scotti, 2001. Observations of nonlinear internal waves on the outer New England continental shelf during the summer shelf break primer study, J. Geophys.
Res., 106(C5): 9587-9601.
[11] Zhao, Z., V. Klemas, Q. Zheng, and X. Yan, 2004. Remote sensing evidence for baroclinic tide origin of internal solitary waves in the northeastern South China Sea, Geophys. Res. Lett., 31: L06302.
[12] Laur, H., P. Bally, P. Meadows, J. Sanchez, B. Schaettler, E.
Lopinto, and D. Esteban, 1998. ERS SAR Calibration : Derivation of the Backscattering coefficient (σ0) in ESA ERS SAR PRI Products, ESA Documents, Document No : ES-TN-RS-PM-HL09, Issue 2, Rev. 5b.
[13] Srivastava, S., and N. Shepherd, 1998. Extraction of Beta
Naught and Sigma Naught from RADARSAT CDPF Products, Rev.2-22 May. Contract No.:9F005-6- 0025/001/SN.
[14] ESA, 2004. Absolute Calibration of ASAR Level 1 Products Generated with PF-ASAR, Technical Note, ENVI-CLVL- EOPG-TN-03-0010.
[15] Thompson, D. R., 1988. Calculation of Radar Backscatter Modulations From Internal Waves, J. Geophys. Res., 93(C10): 12371-12380.