• 검색 결과가 없습니다.

IEG 환경지질연구정보센터

N/A
N/A
Protected

Academic year: 2021

Share "IEG 환경지질연구정보센터"

Copied!
5
0
0

로드 중.... (전체 텍스트 보기)

전체 글

(1)

1. Introduction

Change of ocean with abnormal climate contributes the increase of SL and SST, the change of ocean surface circulation and the variation of sea level. SL and SST are the fundamental index for oceanography and climatology. In order to predict to change of ocean, it is necessary to monitor and predict the oceans in the long time by satellite data.

Several studies (Carnes, 1990), Cheney (1982) have found that SL derived from altimeter and subsurface temperature are highly correlated. The correlation between SL and SST is 0.6 (Nerem, 1997). Coupled Pattern Analysis (CPA) between global SL and SST presented annual cycle accounts for nearly all (95.3%) of the covariance. The spatial and temporal coefficients of the primary mode of a nonseasonal

CPA are correlated with ENSO events (Eric, 1999).

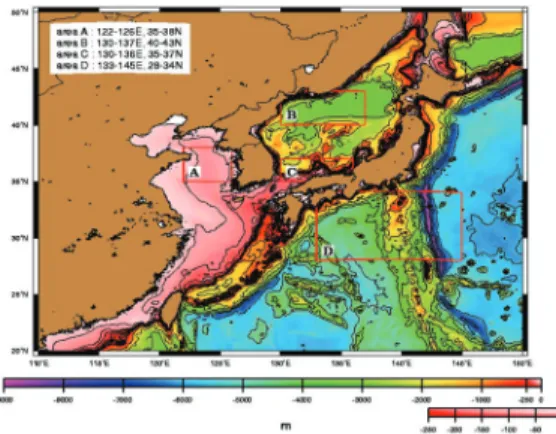
Here, we estimated characteristics on the variations and the correlations of SL and SST, and examined Empirical Orthogonal Function (EOF) analysis in the North East Asian Seas(Fig. 1).

2. Data and Method

Map of Sea Level Anomaly (MSLA) altimeter data have been generated for over 5.4 years, from October 1992 to May 1998, using AVISO GDR-M products for Topex / Poseidon (T/P), cycles 3 to 210.

MSLA was corrected for instrumental errors, environmental perturbations, ocean wave influence, tide influence. CSR3.0 tidal model and ECMWF dry troposhperic and inverse barometer corrections are

Variations of Sea Level and Sea Surface Temperature in Korean Seas by Topex/Poseidon and NOAA

Hong-Joo Yoon, Heung-Soon Kang, and Han-Keun Cho

Department of Satellite Information Sciences, Pukyung National University

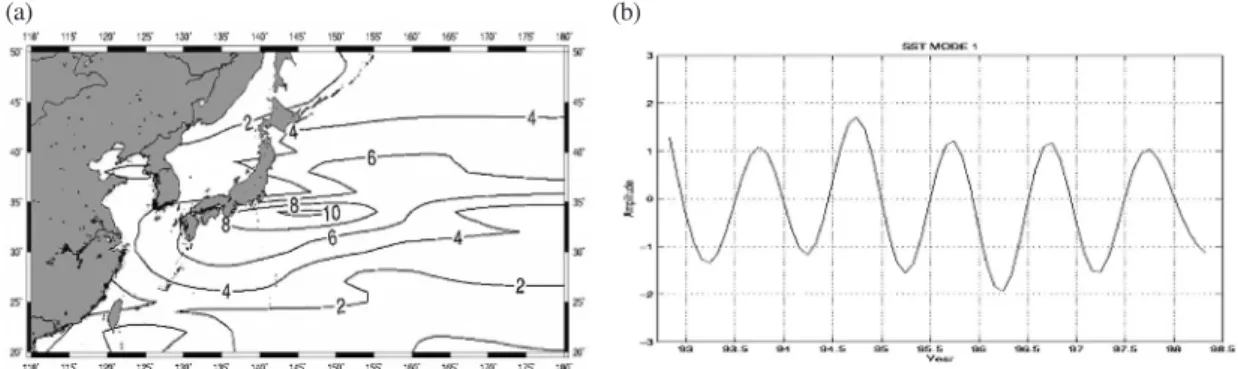
Abstract : Altimeter (Topex/Poseidon) and AVHRR (NOAA) data were used to study the variations and correlations of Sea Level (SL) and Sea Surface Temperature (SST) in the North East Asian Seas from November 1993 to May 1998. This region is influenced simultaneously to continental and oceanic climate as the border of the East Sea (Japan Sea). SL and SST have increased gradually every year because the global warming, and presented usually a strong annual variations in Kuroshio extension region with the influence of bottom topography.

Key Words : EOF Analysis, Sea Level, Sea Surface Temperature.

Korean Journal of Remote Sensing, Vol.23, No.1, 2007, pp.59~63

Received 16 January 2007; Accepted 24 February 2007.

Corresponding Author: H. _ J. Yoon ([email protected])

(2)

applied. MSLA are obtained using improved space/time objective analysis methods which takes into account long wave errors (Le,1998). The maps have resolution of 0.25 degrees by 0.25 degrees. The MSLA data temporally low-passed at 140 days cut off in order to remove tidal aliasing errors in shallow water. The Optimum Interpolation (OI) Sea Surface Temperature (SST) is produced weekly on a one- degree grid. It was removed the tidal aliasing errors from SSH data, and EOF analysis is applied to the 67 months of SL and SST data.

3. Results and Disscusion

In the eastern sea of Japan, SL showed a strong variations of 50-100cm in the region of Kuroshio extension with eddy activity and meandering (Fig.

2a). SST presented a small variations of 0.0-0.1˚C because of the continuous heat compensation of Kuroshio Warm Current (Fig. 2b). This region maintained the characteristics of oceanic climate. In the eastern sea of China, SL presented a small variations of 0-10cm in the Yellow Sea and the Southeast China sea (Fig. 2a).

But SL showed a strong variations of 50-90cm in the coastal areas of the Yellow and Yangtze river with eddy activity because of the confluence area Fig. 1. Schematic map shows bottom topography in the North

East Asian Seas. Area A presents the Yellow Sea, Area B the East Sea, Area C the Japan Sea and Area D the North Pacific Sea, respectively.

Fig. 3. Trends of mean sea level anomaly and sea surface temperature anomaly from 1993 to 1998.

Fig. 2. Variations of (a) sea level and (b) sea surface temperature from 1993 to 1998.

(a) (b)

(3)

between the China Continental Coast Waters and the huge freshwater. SST presented a strong variations of 0.3-0.6˚C (Fig. 2b).

Here, the high deviation of SST between Summer and Winter means a distinct seasonal variations. This region maintained the characteristics of continental climate. For variations and correlation of SL & SST (Fig. 3), they showed a remarkable seasonal variations and correlation coefficient was 65%, and then RMS was 5.1cm for SL and 3.9˚C for SST. The trends of SL and SST increased gradually in all periods as SL is 0.8cm/year and SST is 0.29˚C/year.

For the annual mode of EOF analysis (Fig. 4 and 5), the variance of original data of SL was 57% (first mode: 40%, second mode: 17%) and those of SST was 97% (first mode: 94%, second mode: 3%). In spatial structure for first mode (Fig. 4a and 5a), SL showed strong annual variation in the region of

Kuroshio extension and bottom topography, and SST presented annual variation in the northern part of Yellow Sea and East Sea. In temporal structure for first mode (Fig. 4b and 5b), SL and SST showed dominant annual variation in the Kuroshio region.

Fig. 6 and 7 show (a) cross spectral density and (b) phase between SST and SL in Area A and B in the North Asian Seas, respectively. Here, Area A is the Yellow Sea that is influenced by the continental climate and Area D is the East Sea that is influenced by the oceanic climate. In the distributions of energy on cross spectral density, Area A and D showed simultaneously a remarkable peaks at the annual and semi-annual period. Area D had a high energy levels in all periods against to Area A because of a strong variations due to the Kuroshio Current. In the differences of phase, plus (minus) value means that variations of SST (SL) leading to those of SL (SST).

Fig. 4. (a) spatial field and (b) temporal amplitude of the first mode(40%) for SL.

(a) (b)

Fig. 5. (a) spatial field and (b) temporal amplitude of the first mode(94%) for SST.

(a) (b)

(4)

In the annual period of phase, all Area A and D presented minus values with the leading of variations of SL. But in the semi-annual period of phase, Area A and D presented the mutual reverse values. That is say, the characteristics of plus value in Area A (minus value in Area D) is mainly decided by seasonal variations (influence of currents).

4. Conclusions

The eastern sea of Japan maintained the characteristics of oceanic climate by Kuroshion current, and the eastern sea of China maintained the characteristics of continental climate by Monsoon. SL and SST increased gradually in all periods and then

the slopes of SL and SST presented 0.84 cm/year and 0.29˚C/year, respectively. Their correlation coefficient showed 65 %. It should be considered that the increment of SST and SL is caused by the global warming. In EOF analysis for SST and SL, 97% and 57% of the variance are represented by the first two modes with a strong annual variations expected for steric changes. The correlated annual variations of SST and SL was dominant in the region of Kuroshio.

The second mode of SST shows 3~4 month offset, but that of SL presented a long-term variations.

Acknowledgements

This study was supported by Korea Remote Fig. 6. (a) Cross spectral density and (b) phase between SST and SL in Area A in the North East Asian Seas.

(a) (b)

Fig. 7. (a) Cross spectral density and (b) phase between SST and SL in Area D in the North East Asian Seas.

(a) (b)

(5)

Sensing Center (KRSC) project of the Korea Aerospace Research Institute which is concerned with the research for “Public Application of Satellite Data” and the second stage of Brain Korea 21 Project.

References

Carnes, M. R., J. L. Mitchell, and P. W. de Witt, 1990. Synthetic temperature profiles derived from Geosat altimetry: Comparision with air- dropped expendable bathythermograph profiles. J. Geophys. Res., 95: 17979-17992.

Cheney, R. E., 1982. Comparision data for Seasat

altimetry in the western North Atlantic. J.

Geophys. Res., 87: 3247-3253.

Eric W. Leuliette and John M. Wahr, 1999. Coupled Pattern Analysis of Sea Temperature and TOPEX/Poseidon Sea Surface Height. J.

Physic Ocean, 29: 599-611.

Le Traon, P. Y., F. Nadal, and N. Ducet, 1998. An improved mapping method of multi-satellite altimeter data. J. Atm. Ocean. Techn., 25:

522-534.

Nerem, R. S., and B. J. Haines., J. Hendricks, J. F.

Minster, G. T. Mitchum, and W. B. White, 1997.

Improved determinationof global mean sea level variations from TOPEX/Poseidonaltimeter data.

Geophys. Res. Lett., 24: 1331-1334.

수치

Fig. 3.  Trends of mean sea level anomaly and sea surface temperature anomaly from 1993 to 1998.
Fig. 6 and 7 show (a) cross spectral density and (b) phase between SST and SL in Area A and B in the North  Asian  Seas,  respectively
Fig. 7.  (a) Cross spectral density and (b) phase between SST and SL in Area D in the North East Asian Seas.

참조

관련 문서

The interannual variations of sea surface temperature (SST) in winter represented by the indicator SST of 6℃ are consistent with the east-west zonal areas in the central East

The continues strong wind drove the cold China Coastal Current intruded more southward into southern Peng-Hu Islands resulted in the SST (sea surface temperature) decreased to 13°C

ABSTRACT: In this study the spatial variations of the Plio-Quaternary tectonic activity and deformation of different fault segments of the North Anatolian Fault Zone NAFZ in the

A Correction of East Asian Summer Precipitation Simulated by PNU/CME CGCM Using Multiple Linear Regression.. Yoon-Jeong Hwang* and

Epicentral distribution of twelve earthquakes used in this study.... Focal mechanism for twelve earthquakes in the

(a) Interaction between surface capillary-gravity waves and horizontally varying surface currents induced by internal solitary wave produce variations in sea surface roughness which

Conclusively, possible sediment sources changed from Hida metamorphic belt, Mino-Tamba Terrane and East Asian continent

Using EOS and TAO data, dramatic changes in the patterns of satellite-derived pigment concentrations, sea-level height anomaly, sea surface temperature anomaly, and zonal wind