Spread Patterns of Thermal Effluent Discharged From Young-Kwang Nuclear Power Plant Using Remote Sensing
Data
J. G. Han, Y. K. Yeon, K. H. Chi
Geoinformation Center, Korea Institue of Geoscience & Mineral Resources 30 Gajeong-dong, Yuseong-gu, Daejeon 30-350, Korea
[email protected]
Abstract: This study is focused to analyze the movement of thermal effluent dischargeed from nuclear power plant by sea- son, ebb and flow, and before and after foundation of tide em- bankment using thermal infrared band image of 28 scenes ob- served from Landsat from 1987 to 2004, which is the early stage of operation of young-kwang nuclear power plant. In diffusion of thermal effluent discharge by seasons, spring and summer is spreading further than autumn and winter. It is con- sidered to distribute widely mixed with thermal effluent dis- charge and hot water, which is distributed naturally along the seaside. It is known the fact that tidal currents control the direc- tion of diffusion of thermal effluent discharge by the change of ebb and flow. Namely, it is distributed widely on the Southwest direction along the seaside by tidal currents when ebb and, it is moved widely on the Northeast direction along the seaside by tidal current when flood. However, in the early stage of flood current, the mainstream of thermal effluent discharge is spread on Southwest direction and, the direction is changed on North- east way when the latter period of flood current. Similarly, in the early stage of ebb current, the mainstream of thermal efflu- ent discharge is spread on Northeast direction and, the direction is changed on Southwest direction when the latter period of ebb current. As the result of comparing to the diffusion pattern of thermal effluent discharge before and after the foundation of seawall, discharged thermal effluent from the drain of plant by the foundation of dike is shown as curved circle pattern on Northeast to West direction from the ending portion of the seawall.
Keywords: Thermal effluent, Landsat, Nuclear power plant
1. Introduction
Korea has built and run numerous nuclear and thermoelectric power plants on the coast. Built on the coast, nuclear and thermoelectric power plants use sea- water as a coolant to reuse the steam, which has already been used for generation of electric power, by condensa- tion of water. From this process, the coolant is dis- charged to the sea because the temperature rises and, we call this as thermal effluent. Recently, the power plant has a tendency to large size and, it is constructed and managed as various power plants by one site. Therefore, it is required for proper ways and means to monitor and control that how much influences can be caused for the around of sea environment by discharged thermal efflu- ent.
It is important to understand for water temperature and its movement condition correctly as long as possible in order to analyze the influence of environment by thermal effluent discharge. Even though direct attempts to measure water temperature using probe vessel to do this are conducted, the measuring time takes long in case using probe vessel. So, the movement condition of ther- mal effluent discharge by the current should be consid- ered by time. Furthermore, because obtained materials are point data, it is not easy to understand exactly for the overall condition. And, there is also a weak point to spend lots of time, manpower, and cost, cause it should be observed periodically for a wide area at the same time by observation from a station. From this background, the need of remote sensing technology has been emphasized ever to collect objective data at the same time for a broad area by periodically.
Remote sensing is a technology that reflected or ra- diated electromagnetic waves are collected from the ob- ject of surface using loaded sensor from airline of satel- lite and, using the materials, the technology can get the data for the object about various conditions. Remote sensing has been started after NASA in the U.S. dis- charged the satellite for globe observation called ERTS-1 (later, it has been changed the name as Landsat-1). Cur- rently, applied study in the field of environment, investi- gation of resources, and ocean is in the processing and, because it is obtained marvelous outcome, the applied field has a tendency to increasing gradually.
The materials from artificial satellite and Airborne
Multi-spectral Scanner are used mainly as a technology
of remote sensing for observation of ocean environments
in domestically[1]. As a satellite data, NOAA, MODIS,
Landsat TM are used in large numbers. Korea launched
KOMPSAT-1 loaded with OSMI sensor to observe
ocean environments in 1991. But, in order to obtain the
materials connected with seawater temperature among
ocean environments, satellite data, which can be ob-
tained for the data of wavelength of thermal infrared, are
used NOAA SST data mainly[2, 3]. However, even
though NOAA SST materials are proper for the study of
wide area of thermal effluent discharge because they can
obtain spatial information of low resolution
(1.1km/pixel), as this study, satellite materials of high
resolution are needed to analyze the range of thermal
effluent discharge from localized nuclear power plants.
Therefore, wavelength of thermal infrared in high resolu- tion and Landsat satellite materials, which have 16 days observation cycle, are used mainly. Spatial resolution of wavelength image of thermal infrared of TM sensor, which is loaded onto Landsat 5, which is used for ther- mal effluent discharge study, is 120m/pixel and, it is operated currently. Spatial resolution of wavelength data of thermal infrared ETM+ sensor of Landsat 7, which has been started to operate from April 1999, is reached about 60m/pixel, which has better resolution than TM sensor about 2 times. However, due to the trouble of SLC (Scan Line Corrector), which corrects the distortion of image occurred by image scanning for ETM+ sensor on May in 2003, utilizing of Landsat 7 satellite images is restricted.
In this study, sea surface temperature around nuclear power plant coastal water is measured using thermal infrared band image, which is observed from Landsat affiliated satellite from initial operation of young-kwang nuclear power plant (1987) to at present (2004) and, it is analyzed for the movement and spreading pattern of dis- charged thermal effluent from nuclear power plant by seasons, ebb and flow, and numbers of operating nuclear power plant unit.
2. Materials and Method
1) Study area
Fig. 1 is topographical map on the periphery of young-kwang nuclear power plant. Young-kwang nu- clear power plant is located on Gaema-ri, Hongnong-eub, Youngkwang-gun, Chunranam-do. Gochang-gun, Chun- rabuk-do is located on Northeast direction, which is ad- jacent to drain. On Southwest direction, youngkwang and Hampyung is located and, Gochang and Buahn are on Northeast direction. Around 50 km on East-South direction, Gwangju is located and, around 65 km on South direction, Mokpo is located. Focused on nuclear power plant, Gomsoman is located on North and, Ham- pyungman is located on South. In those areas, inter-tidal flats are distributed widely. Especially, Youngkwang (Baeksu) intertidal flat, which is located upper side of Hampyungman, is important area for the study of ocean environmental system[4].
Located area of young-kwang nuclear power plant has topographical features to connect the west sea di- rectly because they have small numbers of coasts com- paring to west-south coasts, which is the closed due to it is surrounded by large and small coasts. Because such characteristic differences and various oceanographic workings of coast, in consequence, broad muddy tidal flat on West-South coast and sandy tidal flat on coast near around nuclear power plant are formed respectively.
And, on the South direction of studied area, Baeksu in- ter-tidal flat is located, which is one of the largest flats.
In the meantime, Gomsoman is located on north direc- tion. Inter-tidal flat is exposed zone on the air when the
tide is low and, it contacts with the air directly to ex- change the heat when the tide is low. After that, it ex- changes the heat again with seawater.
Fig. 1. Study area, Young-kwang nuclear power plant
2) The present condition of young-kwang nuclear power plant
After young-kwang nuclear power plant, which is located on West coast in Korea, was started to operate in commerce on August 1986 as a unit 1, nuclear power plants of 6 units are in operation so far [Table 1]. Intake and outlet of young-kwang nuclear power plant is com- posed by sea surface intake and sea surface outlet form.
Table 1. The present condition of intake and outlet at young- Kwang nuclear power plant
Unit Location Form Capac-
ity (mW)
Coolant (m3/sec)
Outlet water Form
Intaking water
form
Commercial Operating
day
1 950 57.5 ‘86. 08. 25
2 950 57.5 ‘87. 06. 10
3 1000 53.8 ‘95. 03. 31
4 1000 53.8 ‘96. 01. 01
5 1000 54.3 ‘02. 05. 21
6
Chunnam Young- kwang- gun
PWR
1000 54.3 Sea surface
Outlet Sea surface
intake
‘02. 12. 23
3) Thermal infrared band image of Landsat and meas- ure of sea surface temperature
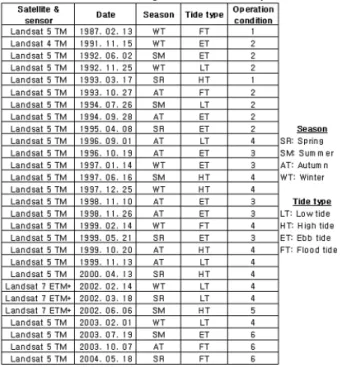
Total 28 scenes are used among Landsat thermal in-
frared band images, which have been photographed 1987
to 2004(at present) in order to analyze the movement and
spreading pattern of thermal effluent discharge at young-
kwang nuclear power plant [Table 2]. The images, which
has been used in this study, can be classified by seasons
as follows; 6 scenes of spring, 5 scenes of summer, 9
scenes of autumn, and 8 scenes of winter. If it is classi-
fied by ebb and flow, 7 scenes of low tide, 6 scenes of
high tide, 10 scenes of ebb tide, and 5 scenes of flood
tide. It is also can be classified by the unit number of
nuclear power plant as follows; 2 scenes as 1 unit is in operation, 7 scenes as 2 units are in operation, 5 scenes as 3 units are in operation, 10 scenes as 4 units are in operation, 1 scene as 5 units are in operation, and 3 scenes as 6 units are in operation.
Table 2. List of Landsat images used in this study
In order to measure seawater surface temperature from Landsat thermal infrared band images, developed model method by NASA is used[5, 6, 7]. Thermal band data (band 6) from Landsat 4/5 TM and 7 ETM+ can also is converted from spectral radiance to effective at- satellite temperature. The effective at-satellite tempera- ture of the imaged Earth surface assumes unity emissiv- ity. A conversion formula is
) 1 1 ln(
2
= + L
λK T K
Where:
T : Effective at-satellite temperature in K K2 : Calibration constant 2 in K
K1 : Calibration constant 1 in W/(m
2*sr * µm) Lλ : Spectral radiance at the sensor's aperture
Table 3 gives values of K1 and K2 defined for the Landsat 4/5 TM and 7 ETM+ sensors. The following equation is used to perform a Qcal to radiance(L
λ) con- version for a L1 product:
Where
L
λ: Spectral Radiance at the sensor's aperture In W/(m
2* sr * µm)
Qcal: The quantized calibrated pixel value in Digital Number (DN)
Qcalmin: The minimum quantized calibrated pixel value (DN=0) corresponding to LMIN
λQcalmax: The maximum quantized calibrated pixel value (DN=255) corresponding to LMAX
λLMIN
λ: The spectral radiance that is scaled to Qcalmin in W/(m
2*sr* µm)
LMAX
λ: The spectral radiance that is scaled to Qcalmax in W/(m
2*sr* µm)
The LMIN/LMAX set of TM Spectral Radiance Range of band 6 is 1.2378/15.303 watts/(meter squared * sr * µm) and ETM+ is 3.2/12.65 in high gain mode.
The foregoing water temperature, which is measured by seawater surface temperature, is computed under the assumption that the emissivity of the whole earth is same.
In this manner, it is needed to correct by water tempera- ture data through actual measurement because the emis- sivity can be shown differently in accordance with re- gion or target object in real world. Therefore, in this study, water temperature value from satellite images is calibrated to use water temperature value by actual measurement from intake and outlet of nuclear power plant, which is adjusted the photographing time from satellites.
Table 3. Values of K1, K2 defined for the Landsat 4/5 TM and 7 ETM+sensors.
Landsat Thermal Band Calibration Constants Units W/(m
2* sr * µm) Kelvin
Constant K1 K2
Landsat 4 671.62 1284.30
Landsat 5 607.76 1260.56
Landsat 7 666.09 1282.71
3. Test results
1) Spreading pattern of thermal effluent by the change of seasons.
In autumn and winter, seawater temperature is to be-
come lower when it is nearer to coastline. So, the bound-
ary between thermal effluent discharge from nuclear
power plant and ambient effluent can be divided into
clear. However, in spring and summer, due to the
characteristics of seasons that seawater temperature is
higher when it is nearer to coastline, the mixed zones of
thermal and ambient effluent have a difficulty to divide
into clear because the boundary between them is not
clear. Namely, the distinction of boundary between
thermal and ambient effluent, which are appeared the
coast by naturally in accordance with coastline, is not
easy. In order to analyze the spreading pattern of thermal
effluent by seasons, the diagram of surface seawater dis-
tribution is analyzed under the same condition of ebb
and flow and the operation of nuclear power plant. In
Graph 1, ebb and flow is high tide before the establish-
ment of sea wall and, it is indicated to measure the
spreading direction and distance of thermal effluent in
the diagram of seawater surface distribution extracted from satellite images, which were photographed by sea- sons when the unit 4 of nuclear power plant was in op- eration. When the thermal effluent is in high tide, it is spread further on Northeast direction in spring and sum- mer than autumn and winter. Even if such conditions, which have been distributed by naturally in accordance with coastline, happened because hot and thermal efflu- ent are mixed and distributed widely, additional study is needed to approve it.
계절별 온배수확산 패턴
0.0 2.0 4.0 6.0 8.0 10.0 12.0 14.0
Spring Summer Autumn Winter
2000. 04. 13 1997. 06. 16 1999. 10. 20 1997. 12. 25
km
NE W SW