IEG 환경지질연구정보센터
4
0
0
전체 글
(2) ω = gκ ⋅ tanh(κ d ). (1). where g is gravitational acceleration (9.8 m/s/s). Figure 4. Satellite SAR image of surface roughness over Keelung Sill during northwestward flood tide. The brighter pattern was produced by surface waves propagating upstream and resulted higher density of surface waves. Figure 2. The bathymetry near Keelung Sill (yellow line), between Keelung Islet and Keelung Habor... Waves will change its wavelength as they propagate through region of changing depth and changing current, but they will not change their frequency. This can easily be verified if we have a fixed sensor in the water tank, or a fixed station in the water. Near the sill, the water depth is mostly above 40 m. It is unrealistic to have a fixed station. So, we will observe the waves from a ship, as in Fig. 3.. The observed wave frequency ωD is Doppler shifted and has a new Dispersion Relation:. v v. ωD = κ ⋅ U + gκ ⋅ tanh(κ d ). (2). where U is approaching speed of the ship towardst the waves. 2. METHODS OF OBSERVATION 2.1 Photographic Images. If the sea surface is illuminated by diffuse sky light that is uniform in all directions, then the reflected skylight increases with the viewing angle α (zero for looking down a flat surface), or reflectance ρ(α) increases with α. For a camera with fixed inclination from horizontal plane, the viewing angle α increases when the sea surface is tilted away from camera, so is r(α), and the pixel is brighter. 2.2 Photos taken near the Bridge of R/V. Fig. 3: Measuring surface wave over Keelung Sill with wave gauges on the starboard side of Ocean Researcher 2. 1.3 Doppler Effect. Because the ship drifts with the current, the observed wave frequency is Doppler shifted towards higher frequency if the waves are propagating upstream, and towards lower frequency otherwise. We are interested in the waves that propagated upstream because these are the waves that have higher energy and they cause bright pattern on SAR images (Fig. 4) of the meeting.. Photos of sea surface were taken when R/V Ocean Researcher 2 drifted downstream, from region of smooth surface towards the sill top, and to the lee side of Keelung Sill In the zone above the Keelung Sill, surface waves of 5~10 meter long dominate wave amplitude, vs. further downstream These are not the short gravity – capillary waves that reflects satellite SAR energy by Bragg scattering It is difficult to compare the wavelength, or change of wavelength if we do not view the waves from directly above sea surface. Fig. 5 shows the original and orthonormally projected images of surface waves before.
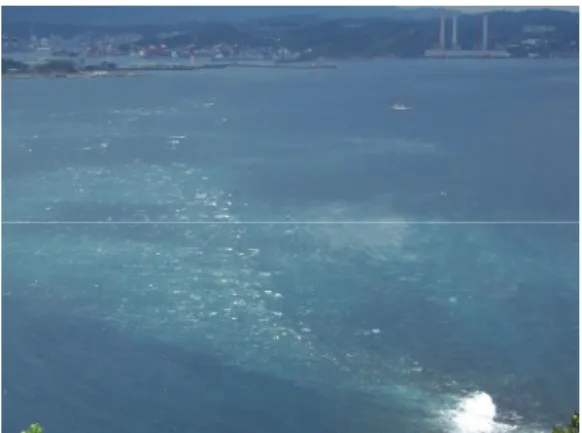
(3) they reach the sill. It is clear that the surface reflectance image is more wave-like pattern after the projection.. Figure 7. Surface roughness pattern that was observed from hilltop.. Figure 5. The original (left) and orthonormally projected (right) images of surface waves before they reach the sill. Fig. 6 shows the change of surface roughness as the waves propagated into the region of influence by the sill, and after the waves passing the sill. Figure 8. Photos from hill top is projected to geographic coordinate. 2.4 Photos from Unmanned Airborne Vehicle (UAV). Viewing large area with high spatial resolution and medium viewing angle can only be down with Unmanned Airborne Vehicle (UAV).. Figure 6. The original (left) and orthonormally projected (right) images of surface waves as they propagated into the region of influence by the sill, and after the waves passing the sill. 2.3 Photos from Hill Top. In order to continuous images of the same sea surface, one must stay at a fixed location. The only choice is taking photos from the hill top of Keelung Islet, Fig. 7. Projecting above image to geographic coordinate (Fig. 7) is a necessary step for cross comparison of images from the ship, and from UAV.. Figure 9. UAV operation from mobile ground station with tracking antenna (lower right), manual control for launching (lower left), and computer controlled flight over Keelung Sill (upper left) A comparison of images taken by various methods is shown in Figure 10..
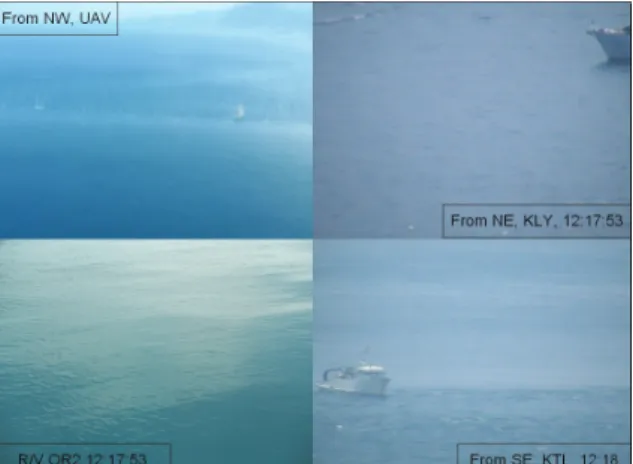
(4) (2) Derive image of slope in viewing direction (Fig. 12); (3) Make orthonormal projection to correct x-y aspect ratio (Fig. 13) (4) Take a slice of the image across the sill top (5) Take Huber-Huang Transformation to derive power spectral density (PSD) as a function of distance and wavenumber (Fig. 14).. Figure 10. The same sea surface that was photographed from different angle and different methods. 3. DATA ANALYSIS. The processing procedure of images is shown on UAV photos: (1) Select an image (Fig. 11);. Figure 11. A photo from UAV when the ship passing Keelung Sill. (courtesy of 智飛科技). Figure 13. Slope of sea surface that is projected to geographic coordinate.. Figure 14. Power spectral density as a function of time as derived with Hilbert-Huang Transformation 4. DISCUSSION. The implication of PSD from HHT (Fig. 14) is that: (1) PSD of 1~ 5m (k = 0.2~1 m-1) short waves dropped off near the sill, with 1-m long wave disappeared first; (2) These are not the wavelength for Bragg scattering as shown in SAR images; (3) PSD of 10 or 20 m long waves can pass over the sill, but they still loose some energy. References: Alpers, W., and I. Hennings, 1984. A theory of the imaging mechanism of underwater bottom topography by real and synthetic aperture radar. J G.R., 89(C6), 10529-10546, 1984.. Figure 12. Slope of sea surface in the viewing direction of UAV.. Liu, A., C.R. Ho and C.T. Liu, 2008. Satellite Remote Sensing of South China Sea. Tingmao, Taipei, Taiwan. pp. 312..
(5)
수치


관련 문서
웹 표준을 지원하는 플랫폼에서 큰 수정없이 실행 가능함 패키징을 통해 다양한 기기를 위한 앱을 작성할 수 있음 네이티브 앱과
- Spring is any natural occurrence where water flows on to the surface of the earth from below the surface (aquifer surface meets the ground surface)5. - Ground
_____ culture appears to be attractive (도시의) to the
1 John Owen, Justification by Faith Alone, in The Works of John Owen, ed. John Bolt, trans. Scott Clark, "Do This and Live: Christ's Active Obedience as the
The approach used in the following analysis is to investigate the effect of neglecting the strain energy due to the 2 nd invariant of the strains in the middle surface
Micro- and nano-sized pores were formed on the surface of the alloy using PEO and anodization methods, and the pore shape change according to the Zr
• Concentration gradient of the oxidizing component, H 2 O 2 in the etch solution close to the surface and inside the thin surface oxide, during a wet chemical
Effect on the shear bond strength of resin cement to IPS Empress 2 ceramic by plasma surface treatmentD.
