• 검색 결과가 없습니다.

Effects of Super-Ultramarathon Races (622 km) on Cardiac Bio-Markers and Markers of Muscle Damage

N/A
N/A
Protected

Academic year: 2021

Share "Effects of Super-Ultramarathon Races (622 km) on Cardiac Bio-Markers and Markers of Muscle Damage"

Copied!
8
0
0

로드 중.... (전체 텍스트 보기)

전체 글

(1)

https://doi.org/10.5763/kjsm.2018.36.3.135 pISSN 1226-3729 eISSN 2288-6028

초 울트라마라톤대회(622 km) 경기가 심장마커와 근손상마커에 미치는 영향

신성대학교 임상병리학과

1

, 인제대학교 상계백병원 재활의학과

2

, 성신여자대학교 운동재활복지학과

3

신경아

1

ㆍ박용범

2

ㆍ김영주

3

Effects of Super-Ultramarathon Races (622 km) on Cardiac Bio-Markers and Markers of Muscle Damage

Kyung-A Shin 1 , Yongbum Park 2 , Young-Joo Kim 3

1

Department of Clinical Laboratory Science, Shinsung University, Dangjin,

2

Department of Rehabilitation Medicine, Sanggye-Paik Hospital, Inje University College of Medicine, Seoul,

3

Department of Exercise Rehabilitation Welfare, Soojung Campus, Sungshin University, Seoul, Korea

Purpose: Changes in serum biomarkers of cardiac and muscle damage have been studied in ultra-marathon runners for distances up to 308 km. We investigated these biomarker changes following a 622-km super-ultramarathon race.

Methods: A group of men with a mean age of 52.7±4.8 years participated. Blood samples were obtained pre-race, during the race, and post-race, to analyze the aforementioned biomarkers.

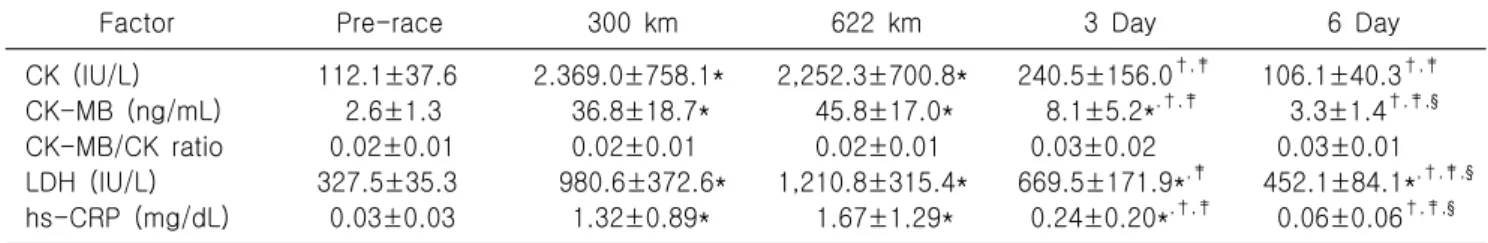
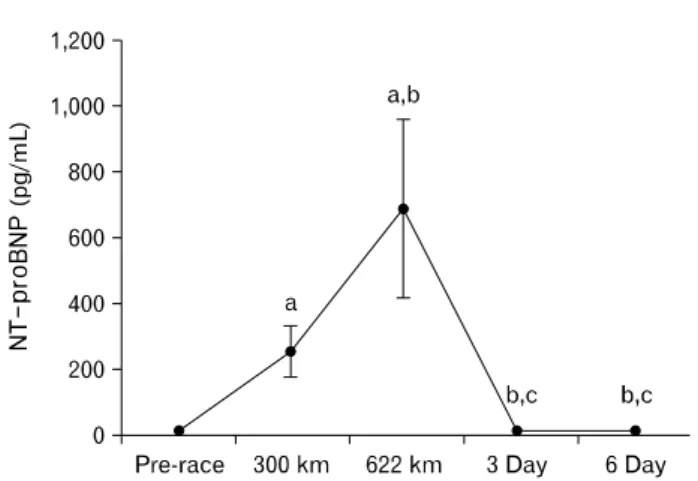
Results: Creatine kinase and creatine kinase-MB (CK-MB) levels increased during the race, and both steadily declined post-race with CK-MB declining at a slower rate. Lactic acid dehydrogenase levels overall were increased over pre-race levels. White blood cell counts increased during the race. Red blood cell decreased from pre-race to 300 km and 622 km. Platelet increased only in the recovery period. High-sensitivity C-reactive protein levels were increased throughout the race and at day 3 compared to pre-race levels. Cardiac troponin I (cTnI) levels increased during the race. N-terminal pro b-type natriuretic peptide (NT-proBNP) levels increased during the race.

Conclusion: The rise in cTnI was not clinically significant, and highly elevated NT-proBNP levels during the race indicates that myocardial burden rose linearly as running distance increased. However, no clinical risk was found as most of the markers returned to normal range during the recovery.

Keywords: Creatine kinase, Creatine Kinase-MB, N-terminal pro-BNP, Rhabdomyolysis

Received: May 31, 2018 Revised: August 13, 2018 Accepted: August 24, 2018 Correspondence: Young-Joo Kim

Department of Exercise Rehabilitation Welfare, Soojung Campus, Sungshin University, Bomun-ro 34da-gil, Seongbuk-gu, Seoul 02844, Korea Tel: +82-2-920-7942, Fax: +82-2-920-7942, E-mail: [email protected]

*This work was supported by the Sungshin University research grant of 2017.

Copyright ©2018 The Korean Society of Sports Medicine

CC

This is an Open Access article distributed under the terms of the Creative Commons Attribution Non-Commercial License (http://creativecommons.org/

licenses/by-nc/4.0) which permits unrestricted non-commercial use, distribution, and reproduction in any medium, provided the original work is properly cited.

(2)

Introduction

An intense long-distance run like a marathon or ultra-marathon increases levels of cardiac troponin I (cTnI) and cardiac troponin T, which are typically detected in patients after myocardial infarction 1,2 . N-terminal pro b-type natriuretic peptide (NT- proBNP) levels, which reflect left ventricular volume or pressure overload, also increase during a long-distance race 3 . Excessive long-distance running can cause reversible damage to muscles, such as occurs in rhabdomyolysis 4 . The elevation of cardiac markers during a long-distance run is reversible; however, the underlying mechanism that leads to the expression of cardiac markers has not been clearly identified 5 . Cardiac marker elevations during an intensive long-distance run reflect the intensity and duration of the exercise 6-8 . Recently, marathons (when run at an average speed of 11.3 km/hr) and 100-km ultramarathons (run at an average speed of 7.4 km/hr) have been reported to increase cTnI, whereas less intense runs, such as the 308 km marathon (average speed of 4.9 km/hr), did not. However, NT-proBNP was reportedly increased during long-distance runs, regardless of the intensity 9 . Although it was hypothesized that elevations of cardiac and muscle biomarkers in myocardial infarction and renal failure as a result of intense long-distance exercise are associated with sudden death, the hypothesis has not been proved. Until now, many studies have documented the consequences of various ultra-marathon distances including 100 km 10 , 160 km 11 , 216 km 12 , 246 km 13 , and the longest distance at 308 km 14 with respect to the changes in cardiac markers. In these studies, most of the cardiac markers increased during the extreme exercise but returned to normal range during the recovery. The 622 km race conducted in this study is an extreme competition that walks and runs twice as far as the distance studied so far, and it is the first research to investigate physiological changes in cardiac markers and muscle damage markers in this race environment. The aim of this study was to investigate the effects of 622 km super-ultramarathon on cardiac and muscle damage markers at time points including pre-race, mid-race, immediately post-race, and during the recovery period.

Methods

1. Subjects and study protocol

The study subjects were middle-aged ultramarathon runners who volunteered to participate. The general entrance conditions for a 622-km marathon competition included a previous record of completing a 200-km race within 33 hours or completing a 308-km race within 64 hours. Among the marathon runners who participated in the 622-km race, 28 runners voluntarily enrolled in this study, 22 of them completed at least 300 km, and 18 completed the entire course of 622 km. Of those 18, 10 remained until the end of the recovery period (3 and 6 days post-race).

The 622-km race required the completion of the half marathon (300 km) within 64 hours 15 minutes, and the full marathon (622 km) in 150 hours. There were time limits set for each of the checkpoints set roughly 50 km apart, and food and drinks containing carbohydrates and proteins were available at the checkpoints. The participants were excluded in any of the following conditions: if they had cardiovascular disease, liver disease, diabetes, or hypertension; if they failed to meet the time limits;

or if they dropped out during the race. The marathon started at 6 am. The minimum temperature was 23 o C and maximum temperature was 32 o C with a 50%–70% relative humidity. The participants’ personal information was collected via questionnaire.

2. Graded exercise testing

The study volunteers completed a graded exercise test (GXT)

1 month before the marathon competition. In the test, an

incremental, symptom-limited GXT was conducted using the Bruce

protocol. To determine the heart rate at rest and during exercise,

as well as to identify potential myocardial ischemia or arrhythmias,

a 12-channel real-time electrocardiogram (Q4500; Quinton

Instrument, Boston, MA, USA) was used. The maximum oxygen

uptake was measured using the Quinton metabolic cart respiratory

gas analyzer (Quinton Instrument). Blood pressure during exercise

was measured using an automatic measuring instrument (Model

412, Quinton Instrument). To apply stress at each stage, we used

a treadmill for GXT (Medtrack ST 55, Quinton Instrument).

(3)

Table 1. Characteristics of demographics and cardio- respiratory fitness in study participants (n=10)

Variable Mean±SD

Age (yr) 52.7±4.8

Height (cm) 171.6±4.6

Weight (kg) 70.5±5.1

BMI (kg/m

2

) 23.9±1.6 Marathon experience (mo) 94.5±23.1 No. of participated marathons 51.12±54.22 Race completion time (min) 8,754.0±152.2 VO

2max

(mL/kg/min) 50.8±7.5 HR

rest

(bpm) 64.1±8.7 SBP

rest

(mm Hg) 127.0±10.9 DBP

rest

(mm Hg) 82.2±5.5

HR

max

(bpm) 174.7±6.5

SBP

max

(mm Hg) 218.9±18.1 DBP

max

(mm Hg) 75.0±9.6

SD: standard deviations, BMI: body mass index, HR: heart rate, SBP: systolic blood pressure, DBP: diastolic blood pressure.

3. Blood sampling

To identify changes in the serum biochemical composition, antecubital vein blood samples were collected before the race, at 300 km, at 622 km, and at 3 and 6 days after the race, according to the Clinical and Laboratory Standards Institute standards and guidelines. To determine plasma concentration status of hemoglobin and hematocrit, samples were collected using K2-EDTA tubes (BD Vacutainer, Franklin Lakes, NJ, USA) at each time point.

After collection, the samples were immediately centrifuged using an automatic LH 750 (Beckman Coulter, Miami, FL, USA). For the biochemical analysis, the samples were collected in vacuum SST blood collection tubes (SST, BD Vacutainer) containing gel and clot activator, and then centrifuged at 3,400 rpm for 10 minutes to separate the serum. The separated serum was stored at –70 o C for subsequent cardiac marker analysis.

4. Blood analysis

Serum creatine kinase (CK) and lactate dehydrogenase (LDH) levels were measured using commercially available reagents (Denka Seiken, Tokyo, Japan), according to the methods recomm- ended by the Japan Society of Clinical Chemistry. Highly sensitive C-reactive protein (hs-CRP) levels were measured using the immunoturbidimetric assay method on a TBA-200FR NEO (Toshiba, Tokyo, Japan) using specific reagents (HBI Co., Anyang, Korea). The creatine kinase-MB (CK-MB) and NT-proBNP measurements were performed using a Modular Analytics E170 (Roche Diagnostics, Mannheim, Germany) and the electro- chemiluminescence immunoassay method. The cTnI levels were measured using an ADVIA centaur (Siemens, Washington, DC, USA), which is based on the chemiluminescence immunoassay method. The reference ranges for the biomarkers were set at 58–348 IU/L or less for CK, 260 IU/L or less for LDH, 5.0 ng/mL or less for CK-MB, 0.78 ng/mL or less for cTnI, 125 pg/mL or less for NT-proBNP, and 0.3 mg/dL or less for HS-CRP. The coefficients of variation were computed to assess the levels of precision in the laboratory measurements, which were 1.2% for CK, 4% for LDH, 3.8% for CK-MB, 10.8% for cTnI, 2% for NT-proBNP and 9.3% for hs-CRP. white blood cell (WBC), red blood cell (RBC), and platelet counts were measured using the automatic LH 750 (Beckman Coulter). Hematocrit and hemoglobin

levels were measured and the resulting data was used to calculate dehydration-induced changes in plasma volume and subsequent applications 15 .

5. Statistical analysis

The changes in serum composition at each distance and time point during the 622-km race were analyzed using the S-Link statistical package for descriptive statistics. To identify changes in serum markers at the five different time points (pre-race, 300 km, 622 km, 3 days post-race, and 6 days post-race), the Friedman test was used as a nonparametric alternative. If significant differences were observed in the statistical tests, a paired Wilcoxon signed-rank test was conducted for a post-hoc analysis. As there were five time points, 10 statistical tests were carried out to determine the differences at each time point. To adjust the errors associated with the multiple post-hoc tests, a Bonferroni correction was used.

The level of statistical significance was set at p<0.05 for the Friedman test and the post-hoc comparisons at each time point.

Results

Table 1 shows the demographics and cardiorespiratory fitness

of the participants. Changes in the biomarkers of cardiac, muscle

(4)

Table 3. Changes in hematological parameters at each distance and time point

Factor Pre-race 300 km 622 km 3 Day 6 Day

WBC (10

3

/UL) 6.3±1.1 11.9±3.8* 12.0±4.1* 6.9±2.2

†,‡

6.5±1.2

†,‡

RBC (10

6

/ L) 4.5±0.5 4.1±0.3* 4.1±0.4* 4.2±0.5 4.3±0.5

Hb (g/dL) 14.4±1.5 13.1±0.7* 12.8±1.1* 13.6±1.3 13.9±1.3

Hct (%) 40.9±3.7 38.0±1.9 37.9±3.0 39.9±3.2 40.8±3.4

Platelet (×10

3

/ L) 211.4±54.3 207.8±49.0 224.8±45.5 287.3±62.0*

,†,‡

293.8±78.0*

,†,‡

Values are presented as mean±standard deviation.

WBC: white blood cell, RBC: red blood cell, Hb: hemoglobin, Hct: hematocrit.

*Significantly different from the pre-race at p<0.05;

Significantly different from the 300 km at p<0.05;

Significantly different from the 622 km at p<0.05.

Table 2. Changes in the bio-markers of cardiac and muscle damage at each distance and time point

Factor Pre-race 300 km 622 km 3 Day 6 Day

CK (IU/L) 112.1±37.6 2.369.0±758.1* 2,252.3±700.8* 240.5±156.0

†,‡

106.1±40.3

†,‡

CK-MB (ng/mL) 2.6±1.3 36.8±18.7* 45.8±17.0* 8.1±5.2*

,†,‡

3.3±1.4

†,‡,§

CK-MB/CK ratio 0.02±0.01 0.02±0.01 0.02±0.01 0.03±0.02 0.03±0.01 LDH (IU/L) 327.5±35.3 980.6±372.6* 1,210.8±315.4* 669.5±171.9*

,‡

452.1±84.1*

,†,‡,§

hs-CRP (mg/dL) 0.03±0.03 1.32±0.89* 1.67±1.29* 0.24±0.20*

,†,‡

0.06±0.06

†,‡,§

Values are presented as mean±standard deviation.

CK: creatine kinase (normal range, 58–348 IU/L), CK-MB: creatine kinase MB (normal range, 0–5.0 ng/mL), CK-MB/CK ratio: normal range, <2.5%), LDH: lactate dehydrogenase (normal range, ≤260 IU/L), hs-CRP: highlysensitive C-reactive protein (normal range, ≤0.3 mg/dL).

*Significantly different from the pre-race at p<0.05;

Significantly different from the 300 km at p<0.05;

Significantly different from the 622 km at p<0.05;

§

Significantly different from the 3 day at p<0.05.

Fig. 1. Changes in troponin I at each distance and time point. Values are presented as mean±standard deviation.

a: significantly different from the pre-race at p<0.05, b:

significantly different from the 300 km at p<0.05, c: sig- nificantly different from the 622 km at p<0.05. cTnI, car- diac troponin I (normal range, ≤0.78 ng/mL).

damage and hematological parameters at each distance and time point are shown in Tables 2, 3 and Figs. 1, 2. CK levels increased from the pre-race (112.1±37.6) to 300 km (2,369.0±758.1) and 622 km (2,252.3±700.8) (p<0.05) and decreased at day 3 (240.5±156.0) and day 6 (106.1±40.3) after the race (p<0.05).

CK-MB levels increased from pre-race (2.6±1.3) to 300 km (36.8±18.7) and 622 km (45.8±17.0) (p<0.05). The level on day 3 (8.1±5.2) was higher than the pre-race value (p<0.05) but lower than the levels measured at 300 km and 622 km (p<0.05).

The level on day 6 (3.3±1.4) was further reduced, compared with the previous measurements at 300 km, 622 km, and day 3 (p<0.05). However, the CK-MB/CK ratio showed no significant differences in relation to distance or time points. LDH levels increased from pre-race (327.5±35.3) to 300 km (980.6±372.6), 622 km (1,210.8±315.4), day 3 (669.5±171.9) and day 6 (452.1±84.1) (p<0.05). The level was reduced on post-race day 3 from the preceding measurement at 622 km (p<0.05) and further reduced compared to the levels at 300 km, 622 km and day 3 although it was still higher than the pre-race level (p<0.05).

The hs-CRP levels increased from pre-race (0.03±0.03) to 300 km (1.32±0.89), 622 km (1.67±1.29) and day 3 (0.24±0.20) (p<

0.05). However, the level on day 3 was lower than the previous

(5)

Fig. 2. Changes in NT-proBNP at each distance and time point. Values are presented as mean±standard deviation.

a: significantly different from the pre-race at p<0.05, b:

significantly different from the 300 km at p<0.05, c: sig- nificantly different from the 622 km at p<0.05. NT-pro BNP, N-terminal pro b-type natriuretic peptide (normal range, ≤125 pg/mL).

levels at 300 km and 622 km (p<0.05), and the level was further decreased on day 6 (0.06±0.06) (p<0.05). WBC counts increased from pre-race (6.3±1.1 10 3 /UL) to 300 km (11.9±3.8 10 3 /UL) and 622 km (12.0±4.1 10 3 /UL) (p<0.05), and then decreased by day 3 (6.9±2.2 10 3 /UL) and day 6 (6.5±1.2 10 3 /UL) after the race (p<0.05). RBC levels decreased from pre-race (4.5±0.5 10 6 / L) to 300 km (4.1±0.3 10 6 / L) and 622 km (4.1±0.4 10 6 / L) (p<0.05). Hb levels decreased from pre-race (14.4±1.5 g/dL) to 300 km (13.1±0.7 g/dL) and 622 km (12.8±1.1 g/dL) (p<0.05), and increased from 622 km (12.8±1.1 g/dL) to day 6 (13.9±1.3 g/dL) (p<0.05). However, hematocrit showed no significant differences in relation to distance or time points. Platelet increased from pre-race (211.4±54.3 ×10 3 / L), 300 km (207.8±49.0 ×10 3 / L) and 622 km (224.8±45.5 ×10 3 / L) to day 3 (287.3±62.0 ×10 3 / L) and day 6 (293.8±78.0 ×10 3 / L) (p<0.05). The cTnI levels increased from pre-race (0.0063±0.001 ng/ L) to 300 km (0.0086±0.002 ng/ L) and 622 km (0.0086±0.002 ng/L) (p

< 0.05), and the level on day 6 (0.0079 ng/mL) was lower than those at 300 km and 622 km (p<0.05). NT-proBNP levels increased from pre-race (32.5±20.4 pg/mL) to 300 km (254.1±78.3 pg/mL) and 622 km (690.5±266.1 pg/mL) (p<0.05), and there was a gradual increase in the levels with increasing distance (p<0.05).

The post-race levels decreased at day 3 (33.0±13.4) and day 6 (29.4±11.9), compared with those measured at 300 km and 622 km (p<0.05).

Discussion

This study identified changes in the biomarkers of cardiac and muscle damage during an intense long-distance race that took a week to complete. Among the serum biomarkers, WBC and hs-CRP rose significantly during and immediately after the race, but returned to the normal levels on post-race day 6, although the long-distance exercise continued for 1 week. Long-distance races such as the marathon and ultra-marathon increased WBC and hs-CRP levels 16 . Exercise-induced inflammatory responses produce oxygen free-radicals and causes damage to cellular walls leading to rupture of muscle cell membranes 17 . Levels of hs-CRP are used as predictors of risk in coronary artery disease in the clinical context 18 , and it is also used as a marker of systemic inflammation. In particular, although platelets increase with inflammatory markers in extreme exercise and are reduced by the feedback system, they demonstrate an increasing tendency in recovery period since their lifespan is 7–10 days 19 .

Elevations of CK and LDH following extreme exercise was observed in this study, suggesting the possibility that increased WBC and hs-CRP levels were induced by reversible damage to active muscles rather than vascular inflammation.

The elevation of CK and LDH as a consequence of extreme

exercise has been well documented 4,20,21 . CK and LDH are

biochemical markers of tissue injury related to the osmotic pressure

of cell membranes 22 . These enzymes display increased serum

activity with mechanical cellular damage and exertional

rhabdomyolysis. Consequently, cellular membrane permeability

and enzyme secretion from other tissues such as skeletal muscles

will increase 23 . In this study, there were high concentrations of

CK and LDH at 300 km and 600 km, with a return to the normal

levels on post-race day 6. The 622-km race is strenuous exercise

that requires prolonged running over a 1 week period. Although

the intensity is rather low, this type of strenuous exercise causes

increases in the levels of musculoskeletal injury markers, regardless

of exercise intensity. Here, the total CK levels were indicators

of myocardial injury based on a calculated ratio of CK-MB to

total CK. Extreme increases in exercise led to increases in CK

and the CK-MB isoenzyme, which are markers of skeletal muscle

damage and cardiac injury, respectively 4 . Notably, a CK-MB/CK

ratio of 2.5% or greater represents myocardial injury more so

(6)

than musculoskeletal injury 24 . In this study, since the CK-MB/CK ratio was 2.5% or lower, myocardial injury was not a significant concern. We confirmed that cTnI was a reliable marker to accurately identify whether myocardial injury was induced by the intensive long-distance run. Elevated levels of cTnI are diagnostic markers associated with clear biochemical evidence of myocardial infarction in clinical practice 25 . Nonetheless, the mechanism whereby cTnI increases during intensive exercise has not been clearly elucidated.

Possible reasons for the elevation of cTnI include free radical effects, changes in glucose and fat metabolism, intracellular calcium overloading, increased plasma catecholamine levels, and mechanically-induced damage to myocardial cell membranes 26 . Particularly, the high-volume pressure in the myocardium during exercise increases cellular membrane permeability and accelerates the expression of cTnI 27 . Serrano-Ostariz et al. 7 reported a positive correlation between the average heart rate and cTnI concentrations in a 206-km bicycle race, citing exercise intensity as the main cause of the rise in cTnI. Kim et al. 14 examined the changes in cTnI concentrations at each distance of 100 km in a 308-km race and found no significant changes, which they attributed to low exercise intensity (average speed of 4.9 km/hr). In animal studies, highly intense exercise increases oxygen free-radicals, oxidative stress in the myocardium, and breaks down cell membranes, thereby promoting the secretion of cTnI 28 . Therefore, the expression of cTnI is likely to be associated with exercise intensity. In this study, cTnI as a marker of myocardial injury, significantly increased at 300 km and 622 km, compared with the pre-race value (in the range of 0.0063±0.001 ng/mL to 0.0086±0.002 ng/mL), but remained within the actual normal range (<0.78 ng/mL), indicating a clinically negligible rise. The slight elevation of cTnI at 300 km and 622 km may stem from the long-distance run that continued for an entire week, the lack of sleep (average 12 hours per week), and the physical and mental exhaustion related to the high temperatures 29 o –32 o and relative humidity of 60%–70% during the daytime hours. Under such circumstances, increases in heart rate and blood pressure cannot be ruled out.

NT-proBNP steeply rises in patients with chronic renal failure, thereby reflecting myocardial wall stress caused by myocardial pressure overload 29 . That is, NT-proBNP is elevated as a defensive mechanism to reduce myocardial stress in response to high myocardial load and pressure. This is achieved by a reduction

of preload and afterload through vascular volume expansion, natriuresis, and sympathetic nervous system blockade 5 . This mechanism also exerts effects during exercise, as the NT-proBNP rises beyond the normal range in 77% of subjects after intense endurance exercises that include marathons, 100-km runs, and marathon mountain bike races 10 . Yoon et al. 9 reported that NT-proBNP was significantly elevated after completion of 100-km marathons and 308-km ultramarathons. Particularly, the increased levels following the 100-km and 308-km ultramarathons were higher than the average upper reference limit (125 pg/mL). In our study, NT-proBNP levels significantly increased at 300 km (7.8-fold higher than the pre-race value) and 622 km (22.4-fold), exceeding the highest level previously reported (690.5±266.1 pg/mL). This result may be explained by the linear increases in myocardial pressure and load with running distance. However, this biomarker returned to its normal level on post-race day 3, even after 1 week of extreme exercise.

This study has several limitations. First, the participants’ food intake could not be controlled as they were free to consume food and water offered at each distance of 50 km of the 622-km race.

Second, the sleep hours were also not controllable, as the participants determined their own sleep hours during the race. Third, calorie consumption during the race, dehydration status, and changes in blood pressure, heart rate, and body fat could not be studied.

In conclusion, all the biomarkers of skeletal muscle injury and inflammation, except for the CK-MB/CK ratio, increased at 300 km and 622 km in a 622-km race, and these markers returned to normal 6 days after the race. cTnI was slightly elevated during the race, but this increase was not clinically significant.

NT-proBNP increased by 7.8- and 22.4-fold at 300 km and 622 km, respectively, thus exhibiting a positive correlation with running distance. This marker returned to normal 3 days after the race.

Therefore, there was no myocardial injury due to extreme competition, and there was a temporary burden on the myocardium and muscles, but most of them returned to normal range during the recovery period and there was no clinical risk.

Conflict of Interest

No potential conflict of interest relevant to this article was

reported.

(7)

Acknowledgements

We would like to thank collaborators, professor, Shunzhe Piao, and Dr. Yoon-Hee Lee, for kind technical support.

References

1. Fortescue EB, Shin AY, Greenes DS, et al. Cardiac troponin increases among runners in the Boston Marathon. Ann Emerg Med 2007;49:137-43.e1.

2. Sedaghat-Hamedani F, Kayvanpour E, Frankenstein L, et al.

Biomarker changes after strenuous exercise can mimic pulmonary embolism and cardiac injury: a metaanalysis of 45 studies.

Clin Chem 2015;61:1246-55.

3. Herrmann M, Scharhag J, Miclea M, Urhausen A, Herrmann W, Kindermann W. Post-race kinetics of cardiac troponin T and I and N-terminal pro-brain natriuretic peptide in marathon runners. Clin Chem 2003;49:831-4.

4. Clarkson PM. Exertional rhabdomyolysis and acute renal failure in marathon runners. Sports Med 2007;37:361-3.

5. Scharhag J, George K, Shave R, Urhausen A, Kindermann W. Exercise-associated increases in cardiac biomarkers. Med Sci Sports Exerc 2008;40:1408-15.

6. Legaz-Arrese A, George K, Carranza-Garcia LE, Munguia- Izquierdo D, Moros-Garcia T, Serrano-Ostariz E. The impact of exercise intensity on the release of cardiac biomarkers in marathon runners. Eur J Appl Physiol 2011;111:2961-7.

7. Serrano-Ostariz E, Legaz-Arrese A, Terreros-Blanco JL, et al.

Cardiac biomarkers and exercise duration and intensity during a cycle-touring event. Clin J Sport Med 2009;19:293-9.

8. Serrano-Ostariz E, Terreros-Blanco JL, Legaz-Arrese A, et al.

The impact of exercise duration and intensity on the release of cardiac biomarkers. Scand J Med Sci Sports 2011;21:

244-9.

9. Yoon JH, Park Y, Ahn J, Shin KA, Kim YJ. Changes in the markers of cardiac damage in men following long-distance and ultra-long-distance running races. J Sports Med Phys Fitness 2016;56:295-301.

10. Scharhag J, Herrmann M, Urhausen A, Haschke M, Herrmann W, Kindermann W. Independent elevations of N-terminal pro- brain natriuretic peptide and cardiac troponins in endurance athletes after prolonged strenuous exercise. Am Heart J 2005;150:1128-34.

11. Scott JM, Esch BT, Shave R, Warburton DE, Gaze D, George K. Cardiovascular consequences of completing a 160-km ultra- marathon. Med Sci Sports Exerc 2009;41:26-34.

12. Roth HJ, Leithauser RM, Doppelmayr H, et al. Cardio- specificity of the 3rd generation cardiac troponin T assay during and after a 216 km ultra-endurance marathon run in Death Valley. Clin Res Cardiol 2007;96:359-64.

13. Bartzeliotou AI, Margeli AP, Tsironi M, et al. Circulating levels of adhesion molecules and markers of endothelial activation in acute inflammation induced by prolonged brisk exercise.

Clin Biochem 2007;40:765-70.

14. Kim YJ, Shin YO, Lee JB, et al. The effects of running a 308 km ultra-marathon on cardiac markers. Eur J Sport Sci 2014;14 Suppl 1:S92-7.

15. Dill DB, Costill DL. Calculation of percentage changes in volumes of blood, plasma, and red cells in dehydration. J Appl Physiol 1974;37:247-8.

16. Wu HJ, Chen KT, Shee BW, Chang HC, Huang YJ, Yang RS. Effects of 24 h ultra-marathon on biochemical and hemat- ological parameters. World J Gastroenterol 2004;10:2711-4.

17. Warhol MJ, Siegel AJ, Evans WJ, Silverman LM. Skeletal muscle injury and repair in marathon runners after competition.

Am J Pathol 1985;118:331-9.

18. Ridker PM, Hennekens CH, Buring JE, Rifai N. C-reactive protein and other markers of inflammation in the prediction of cardiovascular disease in women. N Engl J Med 2000;342:

836-43.

19. Heber S, Volf I. Effects of physical (in)activity on platelet function. Biomed Res Int 2015;2015:165078.

20. Kim HJ, Lee YH, Kim CK. Biomarkers of muscle and cartilage damage and inflammation during a 200 km run. Eur J Appl Physiol 2007;99:443-7.

21. Kobayashi Y, Takeuchi T, Hosoi T, Yoshizaki H, Loeppky JA. Effect of a marathon run on serum lipoproteins, creatine kinase, and lactate dehydrogenase in recreational runners. Res Q Exerc Sport 2005;76:450-5.

22. Rose LI, Bousser JE, Cooper KH. Serum enzymes after marathon running. J Appl Physiol 1970;29:355-7.

23. Milne CJ. Rhabdomyolysis, myoglobinuria and exercise. Sports Med 1988;6:93-106.

24. Pearson JR, Carrea F. Evaluation of the clinical usefulness of a chemiluminometric method for measuring creatine kinase MB. Clin Chem 1990;36:1809-11.

25. Thygesen K, Alpert JS, White HD; Joint ESC/ACCF/AHA/

WHF Task Force for the Redefinition of Myocardial Infarction.

Universal definition of myocardial infarction. Eur Heart J 2007;28:2525-38.

26. Shave R, Baggish A, George K, et al. Exercise-induced

cardiac troponin elevation: evidence, mechanisms, and

implications. J Am Coll Cardiol 2010;56:169-76.

(8)

27. Kim YJ, Shin YO, Lee YH, et al. Effects of marathon running on cardiac markers and endothelin-1 in EIH athletes.

Int J Sports Med 2013;34:777-82.

28. Nie J, Close G, George KP, Tong TK, Shi Q. Temporal association of elevations in serum cardiac troponin T and myocardial oxidative stress after prolonged exercise in rats.

Eur J Appl Physiol 2010;110:1299-303.

29. Omland T, de Lemos JA, Morrow DA, et al. Prognostic

value of N-terminal pro-atrial and pro-brain natriuretic peptide

in patients with acute coronary syndromes. Am J Cardiol

2002;89:463-5.

수치

Table  1.  Characteristics  of  demographics  and  cardio- cardio-respiratory  fitness  in  study  participants  (n=10)
Table  2.  Changes  in  the  bio-markers  of  cardiac  and  muscle  damage  at  each  distance  and  time  point
Fig. 2. Changes in NT-proBNP at each distance and time point. Values are presented as mean±standard deviation

참조

관련 문서

It considers the energy use of the different components that are involved in the distribution and viewing of video content: data centres and content delivery networks

After first field tests, we expect electric passenger drones or eVTOL aircraft (short for electric vertical take-off and landing) to start providing commercial mobility

The present study examined the accuracy of cardiac rhythm analysis with an automated external defibrillator during ambulance transfer using human body models

Keywords □ acute coronary syndrome, discharge medication patterns, Korea, tertiary hospital, follow-up evaluation, troponin-T,

The purpose of this study was to identify the frequency and related factors of advanced airway management for patients with cardiac arrest by the

The positive change pattern of CK-MB according to time on acute myocardiac infarction patient.. The positive change pattern of troponin-T according to time on

Result: During the study period, 482 patients had elevated cardiac troponin-T levels. The positive predictive value for the.. The diagnostic importance of

Approved clinical use of bone marrow stem cells for myocardial infarction treatment... Cardiac