pISSN 1976-1457 eISSN 2005-6168
Vitamin D status and its association with cardiometabolic risk factors in Korean adults based on a 2008-2010 Korean National Health and Nutrition Examination Survey
Ji-Youn Chung 1 and Sung-Ho Hong 2§
1
Department of Family Medicine, Seoul Red Cross Hospital, Seoul 157-863, Korea
2
Department of Family Medicine, Soonchunhyang University College of Medicine, 657 Hannam-dong, Yongsan-gu, Seoul 140-743, Korea
Abstract
Recent studies suggest that vitamin D deficiency and cardiometabolic disorders are becoming increasingly more prevalent across multiple populations.
However, there is a lack of comprehensive data for Korean adults. We investigated the vitamin D status, the prevalence of vitamin D deficiency and its association with metabolic syndrome (MS) risk in Korean adults aged 20 years or older. The study subjects (n = 18,305) were individuals who participated in the Korean National Health Examination and Nutrition Survey (KNHANES) in 2008-2010. Vitamin D status (25-hydroxyvitamin D [25(OH)D]) was categorized as < 20, 21-29, and ≥ 30 ng/mL, which are the cut-off points for deficiency, insufficiency and normal limits. A wide variety of cardiometabolic risk factors were compared according to the vitamin D status. Vitamin D deficiency was found in 53.9% of men and 70.5% of women. Mean BMI, systolic BP, HbA1c and low density lipoprotein cholesterol (LDL-C) were highest in the vitamin D deficiency group in both genders. Further, the MS was most prevalent in the vitamin D deficiency group in both genders (12.3%, P = 0.002 in men and 9.2%, P < 0.001 in women). Compared to the vitamin D normal group, the adjusted odds ratio (ORs) (95% confidence interval [95% CI]) for MS in the vitamin D deficiency group were 1.46 (1.05-2.02) in men and 1.60 (1.21-2.11) in women, after adjusting for confounding variables. In conclusion, Vitamin D deficiency is a very common health problem in Korean adults and is independently associated with the increasing risk of MS.
Key Words: Vitamin D, prevalence, metabolic syndrome, cardiovascular disease, Korean National Health and Nutrition Examination Survey
Introduction 11)
Cardiometabolic disorders, including cardiovascular disease (CVD), type 2 diabetes mellitus (DM) and metabolic syndrome (MS), are major causes of morbidity and mortality worldwide [1,2]. Hypertension (HTN), dyslipidemia, central obesity and glycemic dysregulations are the known risk factors for CVD [2].
MS represents the clustering of these risk factors, which together lead to an increased risk of developing CVD and DM [3] Thus, early identification of the associated risk factors for CVD and MS is important from the public health perspective.
As more and more people live in cities spending a majority of their time indoors, people hardly get enough sunlight exposure for adequate cutaneous production of vitamin D. Thus, vitamin D deficiency has become a major health concern in the modern society. In recent studies, it is estimated that between 30% and 50% of the general population have vitamin D deficiency [4,5].
In Korea, vitamin D deficiency is also very common. In an international epidemiologic study that investigated the vitamin D status among postmenopausal osteoporotic women, including 101 Koreans, the mean serum 25-hydroxyvitamin D [25(OH)D]
level of the Korean participants was 17.6 ng/mL, which was the
lowest among 18 countries. Moreover, the prevalence of 25(OH)D less than 30 ng/mL was the highest in Korea with a rate of 92.1%
[6].
Vitamin D is known to play an important role in bone and mineral homeostasis, and has also been linked with multiple pathophysiological mechanisms. The vitamin D binding receptor is not only expressed in tissues involved in calcium homeostasis, but is also found in more than 36 other tissue types [7]. Further, vitamin D has more recently been implicated in a number of additional pathological processes. These processes include cancer, multiple sclerosis, psoriasis and inflammatory response [8,9].
There is also a growing evidence to support the link between abnormal levels of vitamin D and CVD and MS [4,10]. However, there is a paucity of data that measure the effects of vitamin D status on the cardiometabolic risk factors in the Korean population. Thus, we investigated the vitamin D status, the prevalence of vitamin D deficiency, its association with MS risk and surrogate CVD risk factors, such as inflammatory markers, using the representative data for Korean men and women over 19 years of age (aged 20-87 years) who participated in the Korean National Health Examination and Nutrition Survey (KNHANES) in 2008-2010.
§
Corresponding Author: Sung-Ho Hong, Tel. 82-2-709-9460, Fax. 82-2-709-9459, Email. [email protected] Received: June 18, 2013, Revised: October 8, 2013, Accepted: October 11, 2013
ⓒ2013 The Korean Nutrition Society and the Korean Society of Community Nutrition
This is an Open Access article distributed under the terms of the Creative Commons Attribution Non-Commercial License (http://creativecommons.org/licenses/by-nc/3.0/)
which permits unrestricted non-commercial use, distribution, and reproduction in any medium, provided the original work is properly cited.
Subjects and Methods
Study population
This study was based on data obtained from the 2008-2010 KNHANES, a nationally-representative survey conducted by the Korean Ministry of Health and Welfare. The survey’s target population included non-institutionalized civilians over one year of age in Korea. Sampling units consisted of households selected through a stratified, multistage, probability-sampling design, based on geographic area, sex and age group using household registries. Participants completed four parts of a questionnaire that consisted of a health interview, a health behavior, a health examination and a nutrition survey. After excluding 7,664 individuals younger than 20 years of age, 21,571 subjects were used for the current study. Subjects who had not fasted for at least 12 hours prior to blood sampling, subjects with a triglyceride level exceeding 400 mg/dL and subjects with any missing data for the blood vitamin D measurements (serum 25(OH)D levels) and the MS component of the survey were excluded (n = 1,936).
Those who had not performed a whole body dual energy X-ray absorptionmetry (DXA) scan were also excluded (n = 1,247).
After the exclusion of individuals with liver cirrhosis or other chronic liver or renal diseases (n = 83), 18,305 subjects (aged 20-87 years: 7,957 men, 10,348 women) were included in our final analysis. The study protocol was approved by the Institutional Review Board of Soonchunhyang University College of Medicine (IRB No.2013~042).
Data collection
For the 2008-2010 KNHANES, citizens were informed that they had been randomly selected as a household to voluntarily participate in a nationally representative survey conducted by the Korean Ministry of Health and Welfare, and that they had the right to refuse to participate in accordance with the National Health Enhancement Act, supported by the National Statistics Law of Korea. All study participants provided written informed consent. The Korean Centers for Disease Control and Prevention also obtained written informed consent to use blood samples from the participants for further analysis. The health examination, which was performed in 2008-2010, included a medical disease history, a physical examination, a questionnarie about health- related behaviors, anthropometric, biochemical measurements and DXA. Physical examinations were performed by trained medical staff following the standardized procedures. Participants were asked about lifestyle behaviors, including cigarette smoking, alcohol consumption and physical activity. Participants were categorized as either nonsmokers or current smokers. Regular alcoholic consumption was considered as two or more drinks per week. All subjects were instructed to record their daily engagement in moderate or vigorous activity during the previous 7-day period. Regular exercise was defined as follows: subjects
who were engaged in moderate intensity exercise ≥ 5 times/week or in vigorous intensity exercise ≥ 3 times/week. Completed questionnaires were reviewed by trained staff and were entered into a database. Body weight and height were measured to the nearest 0.1 kg and 0.1 cm, respectively, with the subject wearing light indoor clothing without shoes. Waist circumference (WC) was measured at the narrowest point between the lower border of the rib cage and the iliac crest. Body mass index (BMI) was calculated as the ratio of weight (kg)/height squared (m
2). Blood pressure (BP) was measured after the subject had rested for five minutes in a sitting position. BP was measured in the right arm using a standard mercury sphygmomanometer (Baumanometer, USA). Two systolic blood pressure (SBP) and diastolic blood pressure (DBP) readings were recorded at 5-min intervals and averaged for analysis. After a 12 hours overnight fast, blood samples were obtained from the antecubital vein. Samples were immediately sent to a central certified laboratory and the plasma was separated by centrifugation. Fasting plasma glucose, total cholesterol (TC), triglycerides (TG) and high density lipoprotein cholesterol (HDL-C) levels were measured using a Hitachi 700- 110 Chemistry Analyzer (Hitachi, Tokyo, Japan). Fasting insulin levels were measured by immunoradiometric assay (Biosource, Belgium) using a γ-counter (1470 Wizard; PerikinElmer, Turku, Finland). HbA1c was measured by high performance liquid chromatography (HLC-723G7, Tosch, Japan). White blood cell (WBC) counts were quantified by an automated blood cell counter (ADIVA 120, Bayer, NY, USA). Serum ferritin levels were measured by immunoradiometric assay (DiaSorin Inc., Stillwater, MN, USA) using a γ-counter. The DXA scan was performed for each subject to measure total body fat mass (kg) and total body fat percentage (%) using fan-beam technology (Lunar Corp., Madison, WI). Plasma low density lipoprotein cholesterol (LDL-C) values were estimated using the following formula: TC (mg/dL) - HDL-C (mg/dL) - TG (mg/dL)/5 [11]. The homeostasis model assessment of insulin resistance (HOMA-IR) was calculated using the following formula: [fasting plasma glucose (mg/dL) × fasting insulin (μIU/mL)/18]/22.5 [12].
Measurement of serum 25(OH)D
For measurements of serum 25(OH)D levels, the blood samples
of individual subjects were collected during the survey. Blood
samples were properly processed, immediately refrigerated and
transported in cold storage to the Central Testing Institute in
Seoul, Korea. Blood samples were analyzed within 24 hours after
transportation. Serum 25(OH)D levels were measured using a
γ -counter (1470 Wizard, Perkin-Elmer Finland) with a RIA
(DiaSorin, Still Water, MN). The interassay coefficients of variation
were 11.7%, 10.5%, 8.6% and 12.5% at 8.6, 22.7, 33.0 and 49.0
ng/mL, respectively.
Characteristics Total
(n = 7,957) Vitamin D deficiency
(n = 4,295) Vitamin D insufficiency
(n = 2,854) Normal
(n = 808) P
2)Age (yrs) 43.5 ± 0.3 41.1 ± 0.32 46.1 ± 0.4 49.9 ± 0.7 < 0.001
Current smoking 3,514 (44.2) 2,035 (47.4) 1,141 (40.0) 338 (41.8) < 0.001
Alcohol drinking 3,120 (39.2) 1,542 (35.9) 1,174 (41.1) 404 (50.0) < 0.001
Regular exercise
3)2,256 (28.4) 1,090 (25.4) 891 (31.2) 275 (34.0) < 0.001
Anthropometric index
BMI (kg/m
2) 24.1 ± 0.05 24.1 ± 0.07 24.1 ± 0.06 23.7 ± 0.10 0.009
WC (cm) 84.3 ± 0.30 84.4 ± 0.21 84.3 ± 0.49 84.2 ± 0.40 0.900
Total body fat mass (kg) 14.8 ± 0.12 15.2 ± 0.20 14.3 ± 0.20 13.2 ± 0.30 < 0.001
Total body fat percentage (%) 224 ± 0.15 23.0 ± 0.20 21.9 ± 0.20 20.9 ± 0.30 < 0.001
Blood pressure
SBP (mmHg) 118.9 ± 0.49 119.6 ± 0.60 118.5 ± 0.38 117.0 ± 0.30 < 0.001
DBP (mmHg) 93.4 ± 1.03 95.7 ± 1.40 91.6 ± 0.60 87.7 ± 0.60 0.096
Glucose tolerance index
Fasting glucose (mg/dL) 98.9 ± 0.30 99.1 ± 0.51 98.8 ± 0.70 97.8 ± 0.41 0.116
Fasting insulin (μIU/mL) 10.1 ± 0.10 10.5 ± 0.13 9.7 ± 0.13 8.9 ± 0.20 < 0.001
HOMR-IR 2.5 ± 0.03 2.6 ± 0.04 2.4 ± 0.05 2.2 ± 0.06 < 0.001
HbA1c (%) 7.3 ± 0.07 7.4 ± 0.1 7.2 ± 0.1 6.9 ± 0.1 0.006
Lipid profile
TC (mg/dL) 186.8 ± 0.5 187.6 ± 0.8 186.0 ± 1.5 185.6 ± 0.7 0.107
TG (mg/dL) 122.7 (81.1-188.6) 123.5 (82.1-190.5) 122.3 (79.0-177.9) 120.1 (80.5-187.2) 0.007
HDL-C (mg/dL) 49.5 ± 0.2 49.2 ± 0.23 49.9 ± 0.3 50.3 ± 0.5 0.019
LDL-C (mg/dL) 106.2 ± 0.5 107.0 ± 0.8 105.8 ± 1.5 103.8 ± 0.6 0.003
Inflammatory index
WBC count (cells/μL) 6.6 ± 0.02 6.6 ± 0.03 6.5 ± 0.04 6.4 ± 0.06 < 0.001
Ferritin (ng/mL) 99.1 (65.1-152.3) 99.4(64.7-151.5) 99.1(65.9-155.4) 98.1(65.2-152.6) 0.822
BMI, Body mass index; WC, Waist circumference; SBP, Systolic blood pressure; DBP, Diastolic blood pressure; HOMA-IR, Homeostasis model assessment of insulin resistance;
TC, Total cholesterol; TG, Triglyceride; HDL-C, High density lipoprotein cholesterol; LDL-C, Low density lipoprotein cholesterol; WBC, White blood cell.
1)
Values are presented as means ± standard errors, median (inter-quartile range), or number (%).
2)
Calculated by complex samples general linear model ANOVA or χ
2-test.
3)
Defined as vigorous intensity exercise ≥ 3/week or moderate intensity exercise ≥ 5/week.
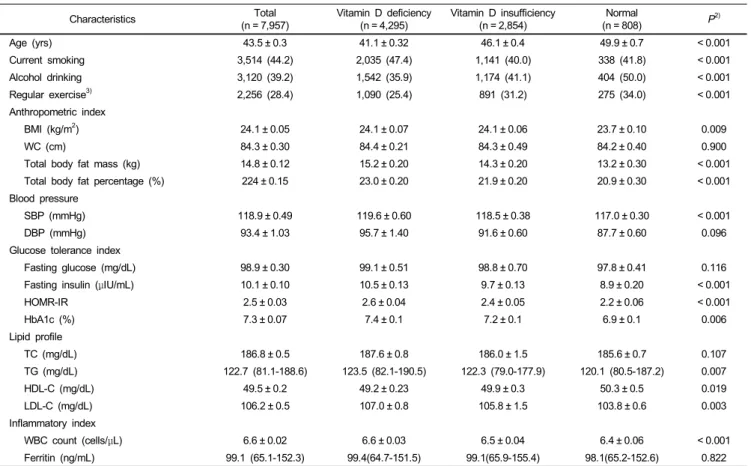
Table 1. Characteristics according to vitamin D status in men
1)Diagnostic criteria of vitamin D deficiency and vitamin D insufficiency
To categorize the serum 25(OH)D levels in our sample population, we used the cutoffs reported in a review published by Holick and Chen in 2008 [13]. Vitamin D deficiency was considered as < 20 ng/mL (50 nmol/L); a level of 21-29 ng/mL (52-72 nmol/L) was considered to indicate vitamin D insufficiency, whereas a level of 30 ng/mL (> 75 nmol/L) or greater was considered normal (sufficient or optimum).
Definition of MS
The definition for MS and its components were based on the National Cholesterol Education Program Adult Treatment Panel III guidelines, and we used the ethnicity-specific values for WC based on data from the World Health Organization and the Korean Society for the Study of Obesity [14]. MS was thus defined by the presence of three or more of the following risk factors: central obesity (WC ≥ 90 cm for men, and ≥ 80 cm for women); SBP ≥ 130 mmHg and DBP ≥ 85 mmHg; fasting glucose levels ≥ 100 mg/dL; TG levels ≥ 150 mg/dL; and low
HDL-C levels (< 40 mg/dL for men, and < 50 mg/dL for women).
Subjects who reported taking antihypertensive or antidiabetes medications were considered to have elevated BP or high fasting glucose levels.
Statistical analysis
All data on the continuous variables were presented as mean
± standard errors (SEs). Data from the National Census from
the Korea National Statistical Office were used to define the standard
population. Statistical estimates were weighted to represent the
total population of Korea. In order to represent the entire Korean
adults without biased estimates, sampling weights were used to
account for the complex sampling. Clinical and biochemical
characteristics of the study population were compared according
to the vitamin D status using a one-way analysis of variance
(ANOVA) test for continuous variables and the chi-square test
for categorical variables. Serum 25(OH)D levels were calculated
according to the number of metabolic risk factors. The prevalence
of MS was compared according to the vitamin D status. Odds
ratios (ORs) and 95% confidence intervals (95% CIs) for MS
were calculated using multiple logistic regression analyses after
Characteristics Total
(n = 10,348) Vitamin D deficiency
(n = 7,292) Vitamin D insufficiency
(n = 2,532) Normal
(n = 524) P
2)Age (yrs) 45.4 ± 0.3 43.8 ± 0.3 49.0 ± 0.5 53.7 ± 0.9 < 0.001
Current smoking 603 (5.8) 451 (6.3) 123 (4.9) 29 (5.5) 0.427
Alcohol drinking 943 (9.1) 637 (8.7) 260 (10.3) 46 (8.8) 0.123
Regular exercise
3)2,555 (24.7) 1,675 (22.9) 708 (27.9) 172 (32.8) < 0.001
Anthropometric index
BMI (kg/m
2) 23.4 ± 0.15 23.5 ± 0.10 23.3 ± 0.10 23.1 ± 0.20 < 0.001
WC (cm) 79.4 ± 0.5 79.6 ± 0.6 79.2 ± 0.3 77.3 ± 0.2 < 0.001
Total body fat mass (kg) 18.2 ± 0.10 18.2 ± 0.12 18.1 ± 0.18 17.5 ± 0.30 0.079
Total body fat percentage (%) 34.3 ± 0.10 34.4 ± 0.16 34.2 ± 0.20 33.6 ± 0.40 0.134
Blood pressure
SBP (mmHg) 117.3 ± 0.2 118.3 ± 0.1 115.5 ± 0.5 112.8 ± 0.3 < 0.001
DBP (mmHg) 90.1 ± 0.8 91.3 ± 0.6 88.1 ± 0.8 83.6 ± 0.4 < 0.001
Glucose tolerance index
Fasting glucose (mg/dL) 96.9 ± 0.7 97.3 ± 0.9 96.4 ± 0.5 94.7 ± 0.3 0.005
Fasting insulin (μIU/mL) 10.0 ± 0.08 10.1 ± 0.1 9.9 ± 0.2 9.7 ± 0.2 0.186
HOMR-IR 2.4 ± 0.03 2.4 ± 0.05 2.4 ± 0.03 2.4 ± 0.1 0.789
HbA1c (%) 7.4 ± 0.01 7.4 ± 0.10 7.4 ± 0.08 6.9 ± 0.1 0.002
Lipid profile
TC (mg/dL) 190.4 ± 0.7 190.9 ± 0.9 190.4 ± 0.2 184.8 ± 0.5 < 0.001
TG (mg/dL) 94.0 (67.2-132.5) 95.4 (68.6-136.7) 91.6 (63.6-138.1) 87.0 (60.8-131.5) 0.201
HDL-C (mg/dL) 54.3 ± 0.2 53.8 ± 0.6 55.4 ± 0.3 55.6 ± 0.2 0.016
LDL-C (mg/dL) 108.1 ± 0.4 114.1 ± 0.9 112.8 ± 0.7 107.2 ± 0.5 < 0.001
Inflammatory index
WBC count (cells/μL) 5.8 ± 0.10 5.8 ± 0.02 5.8 ± 0.02 5.7 ± 0.04 0.680
Ferritin (ng/mL) 44.3 (27.4-69.7) 46.5 (24.5-76.1) 40.6 (21.5-67.2) 32.2 (16.1-55.9) < 0.001
BMI, Body mass index; WC, Waist circumference; SBP, Systolic blood pressure; DBP, Diastolic blood pressure; HOMA-IR, Homeostasis model assessment of insulin resistance;
TC, Total cholesterol; TG, Triglyceride; HDL-C, High density lipoprotein cholesterol; LDL-C, Low density lipoprotein cholesterol; WBC, White blood cell.
1)
Values are presented as means ± standard errors, median (inter-quartile range), or number (%).
2)
Calculated by complex samples general linear model ANOVA or χ
2-test.
3)
Defined as vigorous intensity exercise ≥ 3/week or moderate intensity exercise ≥ 5/week.
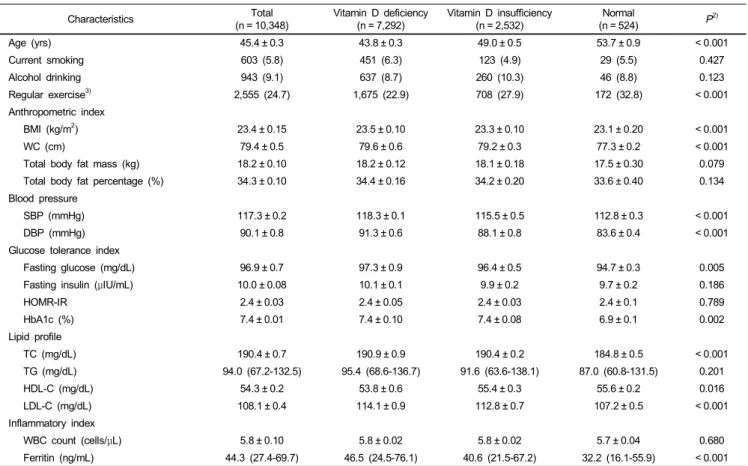
Table 2. Characteristics according to vitamin D status in women
1)adjusting for confounding variables, according to the vitamin D status. All analyses were conducted using the SAS statistical software (version 9.1; SAS Institute Inc., Cary, NC, USA).
Finally, all statistical tests were two-sided and the results with a P-value < 0.05 were considered statistically significant.
Results
Clinical and biochemical characteristics according to vitamin D status in the study population
The clinical and biochemical characteristics according to vitamin D status and gender are presented in Tables 1 and 2.
There were 7,957 men (mean age 43.5 ± 0.3 years) and 10,348 women (mean age 45.4 ± 0.3 years) involved in the study. The mean serum 25(OH)D levels were 19.5 ± 0.2 mg/dL for men and 16.9 ± 0.2 mg/dL for women. Vitamin D deficiency was found in 53.9% of men and 70.5% of women, whereas vitamin D insufficiency was found in 35.9% of men and 24.5% of women.
The percentage of current smokers was significantly higher in the vitamin D deficiency group than in any other group for both
genders. Subjects in the vitamin D deficiency group were less likely to exercise regularly than those in any other group for both genders. For anthropometric indices, the vitamin D group showed a higher BMI than any other group for both genders.
Mean values of total body fat mass and fat percentage were highest in the vitamin D deficiency group in men, and the mean values of WC was highest in the vitamin D deficiency group in women. In the metabolic profiles, SBP, HbA1c and LDL-C were highest in the vitamin D deficiency group in both genders, whereas the mean values of HDL-C were lowest in the vitamin D deficiency group. Mean values of fasting insulin, HOMA-IR and TG were highest in the vitamin D deficiency group in men, and the mean values of DBP, fasting glucose and TC were highest in the vitamin D deficiency group in women. For inflammatory markers, WBC counts were highest in the vitamin D deficiency group in men and ferritin levels were highest in the vitamin D deficiency group in women.
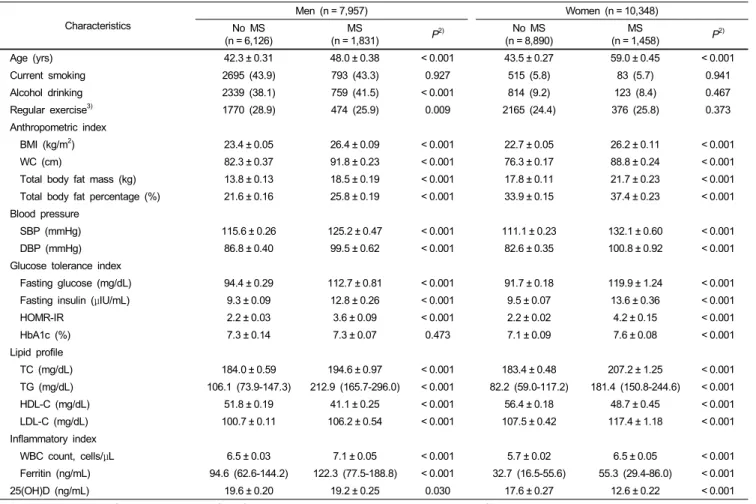
Comparisons of cardiovascular risk factors according to MS status and gender
Table 3 shows the comparison of cardiovascular risk factors
Characteristics
Men (n = 7,957) Women (n = 10,348)
No MS
(n = 6,126) MS
(n = 1,831) P
2)No MS
(n = 8,890) MS
(n = 1,458) P
2)Age (yrs) 42.3 ± 0.31 48.0 ± 0.38 < 0.001 43.5 ± 0.27 59.0 ± 0.45 < 0.001
Current smoking 2695 (43.9) 793 (43.3) 0.927 515 (5.8) 83 (5.7) 0.941
Alcohol drinking 2339 (38.1) 759 (41.5) < 0.001 814 (9.2) 123 (8.4) 0.467
Regular exercise
3)1770 (28.9) 474 (25.9) 0.009 2165 (24.4) 376 (25.8) 0.373
Anthropometric index
BMI (kg/m
2) 23.4 ± 0.05 26.4 ± 0.09 < 0.001 22.7 ± 0.05 26.2 ± 0.11 < 0.001
WC (cm) 82.3 ± 0.37 91.8 ± 0.23 < 0.001 76.3 ± 0.17 88.8 ± 0.24 < 0.001
Total body fat mass (kg) 13.8 ± 0.13 18.5 ± 0.19 < 0.001 17.8 ± 0.11 21.7 ± 0.23 < 0.001
Total body fat percentage (%) 21.6 ± 0.16 25.8 ± 0.19 < 0.001 33.9 ± 0.15 37.4 ± 0.23 < 0.001
Blood pressure
SBP (mmHg) 115.6 ± 0.26 125.2 ± 0.47 < 0.001 111.1 ± 0.23 132.1 ± 0.60 < 0.001
DBP (mmHg) 86.8 ± 0.40 99.5 ± 0.62 < 0.001 82.6 ± 0.35 100.8 ± 0.92 < 0.001
Glucose tolerance index
Fasting glucose (mg/dL) 94.4 ± 0.29 112.7 ± 0.81 < 0.001 91.7 ± 0.18 119.9 ± 1.24 < 0.001
Fasting insulin (μIU/mL) 9.3 ± 0.09 12.8 ± 0.26 < 0.001 9.5 ± 0.07 13.6 ± 0.36 < 0.001
HOMR-IR 2.2 ± 0.03 3.6 ± 0.09 < 0.001 2.2 ± 0.02 4.2 ± 0.15 < 0.001
HbA1c (%) 7.3 ± 0.14 7.3 ± 0.07 0.473 7.1 ± 0.09 7.6 ± 0.08 < 0.001
Lipid profile
TC (mg/dL) 184.0 ± 0.59 194.6 ± 0.97 < 0.001 183.4 ± 0.48 207.2 ± 1.25 < 0.001
TG (mg/dL) 106.1 (73.9-147.3) 212.9 (165.7-296.0) < 0.001 82.2 (59.0-117.2) 181.4 (150.8-244.6) < 0.001
HDL-C (mg/dL) 51.8 ± 0.19 41.1 ± 0.25 < 0.001 56.4 ± 0.18 48.7 ± 0.45 < 0.001
LDL-C (mg/dL) 100.7 ± 0.11 106.2 ± 0.54 < 0.001 107.5 ± 0.42 117.4 ± 1.18 < 0.001
Inflammatory index
WBC count, cells/μL 6.5 ± 0.03 7.1 ± 0.05 < 0.001 5.7 ± 0.02 6.5 ± 0.05 < 0.001
Ferritin (ng/mL) 94.6 (62.6-144.2) 122.3 (77.5-188.8) < 0.001 32.7 (16.5-55.6) 55.3 (29.4-86.0) < 0.001
25(OH)D (ng/mL) 19.6 ± 0.20 19.2 ± 0.25 0.030 17.6 ± 0.27 12.6 ± 0.22 < 0.001
BMI, Body mass index; WC, Waist circumference; SBP, Systolic blood pressure; DBP, Diastolic blood pressure; HOMA-IR, Homeostasis model assessment of insulin resistance;
TC, Total cholesterol; TG, Triglyceride; HDL-C, High density lipoprotein cholesterol; LDL-C, Low density lipoprotein cholesterol; WBC, White blood cell; 25(OH)D, 25-hydroxyvitamin D.
1)
Values are presented as means ± standard errors, median (inter-quartile range), or number (%).
2)
Calculated by complex samples general linear model ANOVA or χ
2-test.
3)
Defined as vigorous intensity exercise ≥ 3/week or moderate intensity exercise ≥ 5/week.
Table 3. Comparisons of cardiovascular risk factors according to MS status and gender
1)Vitamin D status in men Vitamin D status in women
Normal Vitamin D insufficiency Vitamin D deficiency Normal Vitamin D insufficiency Vitamin D deficiency
Model 1
1)1.00 1.16 (0.88-1.53) 1.61 (1.20-2.15) 1.00 1.18 (0.49-2.82) 2.41 (1.78-3.27)
Model 2
2)1.00 1.21 (0.90-1.63) 1.42 (1.03-1.95) 1.00 1.34 (0.46-1.32) 1.70 (1.24-2.32)
Model 3
3)1.00 1.18 (0.87-1.58) 1.46 (1.06-2.01) 1.00 1.34 (0.45-1.32) 1.62 (1.23-2.13)
Model 4
4)1.00 1.16 (0.83-1.56) 1.45 (1.05-2.02) 1.00 1.32 (0.44-1.31) 1.60 (1.21-2.11)
1)
Unadjusted.
2)
Adjusted for age.
3)
Adjusted for age, smoking, alcohol drinking, and regular exercise, occupation.
4)