PGHN
Original Article
Investigation of Blood Betatrophin Levels in Obese Children with Non-Alcoholic Fatty Liver Disease
Fatih Battal, Hakan Türkön*, Nilüfer Aylanç
†, Hakan Aylanç, Şule Yıldırım, Nazan Kaymaz, and Sema Uysal*
Departments of Pediatrics, *Biochemistry, and †Radiology, Faculty of Medicine, Çanakkale Onsekiz Mart University, Çanakkale, Turkey
Purpose: The prevalence of obesity has significantly increased among children and adolescents worldwide and is becoming an important health care problem in parallel with the increased prevalence of obesity pediatric non-alco- holic fatty liver disease. Betatrophin is a newly define hormone that is commonly secreted by liver and plays role in glucose tolerance. This study aimed to investigate the relationship between serum betatrophin levels and non-alco- holic fatty liver disease in obese children.
Methods: The study included 40 obese children with a body mass index (BMI) above 95th centile, and 35 non-obese subjects with a BMI 3-85th centile, whose age and gender were similar to those of the patient group. For the evaluation of metabolic parameters fasting serum glucose, insulin, alanine aminotransferase, aspartate aminotransferase, lipid profile and serum betatrophin levels were measured. Total cholesterol: high-density lipoprotein cholesterol and low-density lipoprotein cholesterol: high-density lipoprotein cholesterol ratios were calculated as “atherogenic indices.”
Results: Serum betatrophin levels of the obese subjects were similar to that of non-obese subjects (p=0.90).
Betatrophin levels were not correlated with the metabolic parameters.
Conclusion: In the present study, levels of betatrophin are not different between obese and insulin resistant children and non-obese subjects, and they are not correlated with atherogenic indices. To elucidate the exact role of beta- trophin in obesity, further studies are required to identify the betatrophin receptor and/or other possible cofactors.
Key Words: Betatrophin, Child, Obesity, Liver
Received:October 14, 2017, Revised:December 19, 2017, Accepted:January 9, 2018
Corresponding author: Şule Yıldırım, Department of Pediatrics, Çanakkale Onsekiz Mart University Hospital, Çanakkale 17000, Turkey. Tel:
+90-286-2200206, Fax: +90-286-2635956, E-mail: [email protected] Copyright ⓒ 2018 by The Korean Society of Pediatric Gastroenterology, Hepatology and Nutrition
This is an openaccess article distributed under the terms of the Creative Commons Attribution NonCommercial License (http://creativecommons.org/licenses/by-nc/4.0/) which permits unrestricted noncommercial use, distribution, and reproduction in any medium, provided the original work is properly cited.
INTRODUCTION
The prevalence of obesity has significantly in-
creased among children and adolescents worldwide and is becoming an important health care problem.
Recently, in parallel with the increased prevalence of
obesity pediatric non-alcoholic fatty liver disease (NAFLD) has also become widespread both in devel- oped and developing countries and also an im- portant medical problem worldwide [1,2]. Increased prevalence of NAFLD has been reported in various studies, it is suggested that increased incidence of NAFLD is a consequence of the increased incidence of obesity and metabolic syndrome in Western world [3]. The prevalence of pediatric NAFLD is estimated between 2.6% and 9.6% and associated with age, sex and ethnicity [4]. Excess lipid accumulation in adi- pose tissue can lead to ectopic fat deposition in non-adipose tissues, such as muscle, liver and pan- creas [5]. Furthermore, as a key metabolic organ of the body, the liver has a critical role in lipid metabo- lism [6]. Moreover, NAFLD is one of the most com- mon complications of pediatric obesity strongly as- sociated with the clinical features of insulin resist- ance, especially including type 2 diabetes mellitus (T2DM) and metabolic syndrome in obese youth [7].
It was shown that metabolic changes are associated with leptin, adiponectin, irisin, fibroblast-like growth factor and some cytokines in obesity [8,9].
Betatrophin is a newly define hormone that is commonly secreted by liver but also from adipose tis- sue and leads proliferation and development of pan- creas β cells and plays role in glucose tolerance [10].
Accumulation of free fatty acids in the hepatocytes of patients with NAFLD might be associated with the levels of betatrophin in insulin-resistant obesity. The studies about effects of betatrophin are in obese or diabetic adults and in experimental animals [11,12].
There are only a few studies about betatrophin levels in obese children [13]. In the present study we aimed to introduce serum betatrophin levels in obese chil- dren with NAFLD.
MATERIALS AND METHODS
Ethics statement
This prospective study was approved by the local ethics committee of Çanakkale Onsekiz Mart Univer- sity Faculty of Medicine (IRB no. EK-2014-172) and conducted in accordance with the principles of the
Declaration of Helsinki. An equal number of pediatric patients diagnosed with exogenous obesity and healthy control subjects were recruited for the study after informed consent was obtained from their parents.
Study population
The study was conducted at the Pediatric Unit of the Çanakkale Onsekiz Mart University, Faculty of Medicine, from December 2014 to July 2015. The study included 58 obese children and adolescents with a body mass index (BMI) above 95th centile, ac- cording to reference curves for Turkish children [14].
All children had diagnosis of exogenous obesity and the exclusion criteria included hepatic virus in- fections (hepatitis A, B, C, cytomegalovirus and Epstein-Barr virus infections), history of parenteral nutrition, alcohol consumption, and drug history that affect carbohydrate metabolism and body weight and induce steatosis (e.g., valproic acid, amiodarone, L-asparaginase, glucocorticoids). Meta- bolic and autoimmune, α-1-antitrypsin associated liv- er disease and Wilson’s disease were ruled out based on standard clinical and laboratory criteria. Familial history of obesity and diabetes was questioned. None of the patients had a familial history of T2DM. The exclusion criteria also included a previous diagnosis of any disease affecting the endocrine system (e.g., hypothyroidism, Cushing’s disease), any syndrome associated with obesity (e.g., Prader-Willi and Laurence-Moon-Biedle syndromes), other systemic disorders, and/or a history of drug use. Exogenous obesity was defined as no endocrine, metabolic, or genetic causes of obesity. Twenty-four healthy in- dividuals with a BMI 3-85th centile, whose age and gender were similar to those of the patient group were enrolled as normal weight group.
Subjects and study design
The subjects were divided into three group.
NAFLD obese group consisted of 16 girls and 16 boys with mean age: 13.31 years, mean BMI 30 kg/m2 (±6) and ultrasound evidence of fatty changes in the liver (Table 1).
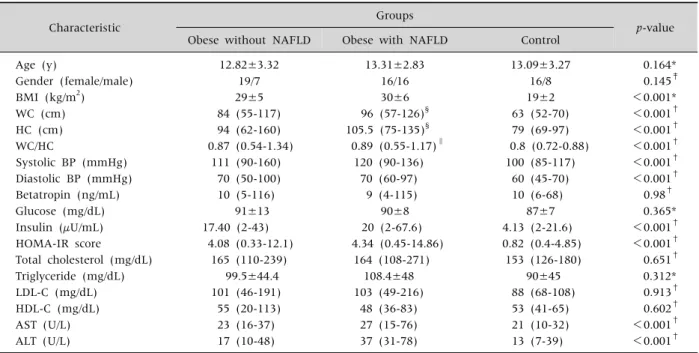
Table 1.The Clinical and Laboratory Characteristics of Study Groups
Characteristic Groups
p-value Obese without NAFLD Obese with NAFLD Control
Age (y) 12.82±3.32 13.31±2.83 13.09±3.27 0.164*
Gender (female/male) 19/7 16/16 16/8 0.145‡
BMI (kg/m2) 29±5 30±6 19±2 <0.001*
WC (cm) 84 (55-117) 96 (57-126)§ 63 (52-70) <0.001†
HC (cm) 94 (62-160) 105.5 (75-135)§ 79 (69-97) <0.001†
WC/HC 0.87 (0.54-1.34) 0.89 (0.55-1.17)∥ 0.8 (0.72-0.88) <0.001†
Systolic BP (mmHg) 111 (90-160) 120 (90-136) 100 (85-117) <0.001†
Diastolic BP (mmHg) 70 (50-100) 70 (60-97) 60 (45-70) <0.001†
Betatropin (ng/mL) 10 (5-116) 9 (4-115) 10 (6-68) 0.98†
Glucose (mg/dL) 91±13 90±8 87±7 0.365*
Insulin (μU/mL) 17.40 (2-43) 20 (2-67.6) 4.13 (2-21.6) <0.001†
HOMA-IR score 4.08 (0.33-12.1) 4.34 (0.45-14.86) 0.82 (0.4-4.85) <0.001†
Total cholesterol (mg/dL) 165 (110-239) 164 (108-271) 153 (126-180) 0.651†
Triglyceride (mg/dL) 99.5±44.4 108.4±48 90±45 0.312*
LDL-C (mg/dL) 101 (46-191) 103 (49-216) 88 (68-108) 0.913†
HDL-C (mg/dL) 55 (20-113) 48 (36-83) 53 (41-65) 0.602†
AST (U/L) 23 (16-37) 27 (15-76) 21 (10-32) <0.001†
ALT (U/L) 17 (10-48) 37 (31-78) 13 (7-39) <0.001†
Values are presented as mean±standard deviation, number only, or median (range).
NAFLD: non-alcoholic fatty liver disease, BMI: body mass ındex, WC: waist circumference, HC: hip circumference, BP: blood pressure, HOMA-IR: homeostasis model assessment-insulin resistance index, LDL-C: low-density lipoprotein cholesterol, HDL-C:
high-density lipoprotein cholesterol, AST: aspartate aminotransferase, ALT: alanine aminotransferase.
*ANOVA, †Kruskal-Wallis test, ‡chi-square test. §p<0.016 (Bonferroni correction) comparison between obese group without NAFLD and obese group with NAFLD. ∥p>0.016 (Bonferroni correction) comparison between obese group without NAFLD and obese group with NAFLD.
Non-NAFLD obese group consisted of 19 girls and 7 boys with mean age 12.82 years, mean BMI 29 kg/m2 (±5) and with no ultrasound evidence of fatty changes in the liver (Table 1).
Non-obese (normal weight) control group in- cluded 16 girls and 8 boys with mean age: 13.09 years, mean BMI 19 kg/m2 (±2) (Table 1). This con- trol group consisted of healthy subjects presented to the hospital for minor illnesses such as conjunctivitis, common cold or other similar conditions. None of the subjects was vegetarian.
Anthropometric measurement
Height was measured to the nearest 0.5 cm with the subject naked feet, eyes looking straight ahead, back against the wall. Weight was measured in the post absorptive state, using a standard lever scale, sensitive to 100 g and BMI was calculated as weight in kilograms divided by the square of height in
meters. The same investigator (FB) measured body weight and height using a stadiometer (Seca 703, ac- curate to 100 g; Seca GmBH&Co. Kg, Hamburg, Germany).
Blood pressure
After resting for at least 5 minutes, diastolic and systolic pressure (mmHg) were measured with chil- dren in a sitting position, using a cuff appropriate for body size and a mercury-gravity manometer.
Biochemical analysis
Following overnight fasting, blood samples were collected from obese children in the morning using venous puncture technique into VacutainerⓇ serum tubes with gel separator (BD Vacutainer, Plymouth, UK). The samples were then analyzed on the same day for serum lipid profile (total cholesterol [TC], high-density lipoprotein cholesterol [HDL-C], low-
Fig. 1. Comparison of serum betatrophin concentration between obese and non-obese subjects.
density lipoprotein cholesterol [LDL-C], and trigly- cerides [TG]), and plasma glucose by enzymatic methods using Roche Cobas c 501 analyzer (Roche Diagnostics, Indianapolis, IN, USA) and for insulin measurement by electrochemiluminescence immu- noassay using Roche Cobas e 601 analyzer (Roche Diagnostics). Insulin resistance was assessed through the homeostasis model assessment-insulin resist- ance index (HOMA-IR). The status of insulin resist- ance was determined using different cut-off values for prepubertal (>2.5) and pubertal (>4) stages [15].
Measurement of betatrophin levels
Serum samples collected for betatrophin were kept at −80o until analysis. Serum levels of beta- trophin were measured with enzyme-linked im- munosorbent assay kit in accordance with the manu- facturer’s instructions (Cat. no: YHB3586Hu, Yehua Biological Technology, Shangai, China). The intra- and inter-assay coefficients of variations were <10%
and <12% for betatrophin (ng/L) respectively.
Liver ultrasonography
All patients with abnormally high transaminase levels and those having abnormal liver images on ul- trasound were screened for other liver conditions (hepatitis B surface antigen, hepatitis C antibody, se- rum iron level, total iron-binding capacity, pro- thrombin time, ferritin, and antinuclear antibodies) which were all negative. Liver ultrasonography was carried out by an experienced operator (NA) who was not aware of clinical and laboratory character- istics of the subjects. Scans were performed with a Toshiba Aplio XG model ultrasonography using 3.5 MHz prob. The presence of NAFLD was evaluated ac- cording to the scoring system defined by Singh et al.
[16] based on the visibility of vascular structures, hy- perechogenicity of liver tissue and difference in echogenicity between liver and diaphragm. Pediatric NAFLD is defined as chronic hepatic steatosis in chil- dren aged less than 18 years without an etiology of genetic or metabolic disorders, medications, ethanol consumption, infections or malnutrition [17].
Statistical analysis
Statistical analysis was performed using IBM SPSS Statistics ver. 21.0 (IBM Co., Armonk, NY, USA). Normality of the variables was evaluated through visual (histograms, probability plots) and analytical methods (Shapiro-Wilk’s test). According to tests of normality, either the Student’s t-test or Mann-Whitney U-test was used depending on the results of normality tests in order to compare differ- ences between NAFLD with obese and non-obese children. Pearson’s correlation was used to inves- tigate the correlations between the independent parameters. The p<0.05 values were considered statistically significant.
RESULTS
Clinical and laboratory characteristics of the study population
The clinical and laboratory characteristics of the children are summarized in Table 1. NAFLD obese subjects had significantly higher values of BMI, sys- tolic blood pressure (SBP), and diastolic blood pres- sure (DBP) compared with gender- and age-match- ed non-obese subjects. No significant differences were detected in serum betatrophin levels between three subgroups.
Furthermore, there were not statistically sig- nificant differences between non-obese and NAFLD
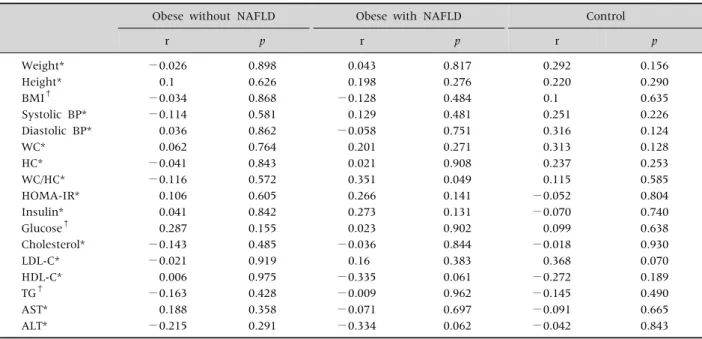
Table 2.The Correlations between Betatrophin Levels and Clinical and Laboratory Parameters in the Study Groups
Obese without NAFLD Obese with NAFLD Control
r p r p r p
Weight* −0.026 0.898 0.043 0.817 0.292 0.156
Height* 0.1 0.626 0.198 0.276 0.220 0.290
BMI† −0.034 0.868 −0.128 0.484 0.1 0.635
Systolic BP* −0.114 0.581 0.129 0.481 0.251 0.226
Diastolic BP* 0.036 0.862 −0.058 0.751 0.316 0.124
WC* 0.062 0.764 0.201 0.271 0.313 0.128
HC* −0.041 0.843 0.021 0.908 0.237 0.253
WC/HC* −0.116 0.572 0.351 0.049 0.115 0.585
HOMA-IR* 0.106 0.605 0.266 0.141 −0.052 0.804
Insulin* 0.041 0.842 0.273 0.131 −0.070 0.740
Glucose† 0.287 0.155 0.023 0.902 0.099 0.638
Cholesterol* −0.143 0.485 −0.036 0.844 −0.018 0.930
LDL-C* −0.021 0.919 0.16 0.383 0.368 0.070
HDL-C* 0.006 0.975 −0.335 0.061 −0.272 0.189
TG† −0.163 0.428 −0.009 0.962 −0.145 0.490
AST* 0.188 0.358 −0.071 0.697 −0.091 0.665
ALT* −0.215 0.291 −0.334 0.062 −0.042 0.843
NAFLD: non-alcoholic fatty liver disease, BMI: body mass ındex, BP: blood pressure, WC: waist circumference, HC: hip circumference, HOMA-IR: homeostasis model assessment-insulin resistance index, LDL-C: low-density lipoprotein cholesterol, HDL-C: high-density lipoprotein cholesterol, TG: triglyceride, AST: aspartate aminotransferase, ALT: alanine aminotransferase.
*Spearman correlation, †Pearson correlation.
obese groups regarding the TG, TC, HDL-C, LDL-C, HOMA-IR, serum insulin, and betatrophin (Table 1, Fig. 1). Serum betatrophin level was similar in the obese subjects with NAFLD compared to the non- NAFLD group (median, 9 [4-115]; median, 10 [5-116];
p=0.90, respectively).
Correlation of betatrophin with clinical parameters
In study groups, serum betatrophin levels were not correlated with the glucose, fasting serum in- sulin, HOMA-IR, TG, TC, HDL-C, LDL-C, BMI, SBP, DBP, alanine aminotransferase, and aspartate ami- notransferase (p>0.05) (Table 2).
There was also no correlation between degree of hepatosteatosis and serum betatrophin levels (r=0.139, p=0.449).
DISCUSSION
In the present study there were no difference of se- rum betatrophin levels of obese and control groups.
There are only a few studies in the childhood or ado- lescence about the relations between circulating be- tatrophin concentrations and metabolic parameters.
Gómez-Ambrosi et al. [11] showed decreased beta- trophin levels, while Fu et al. [10] demonstrated in- creased betatrophin levels in T2DM patients. On the other hand, Fenzl et al. [18] did not find any correla- tion between serum glucose and/or insulin levels and circulating betatrophin concentrations in the obese adult patients. Wu et al. [13] showed that betatrophin levels were higher in insulin-resistant patients com- pared to non-insulin resistant subjects. However, in that study, betatrophin levels were not increased sig- nificantly in the obese children compared with age- and gender-matched normal-weight children. Hu et al. [19] found a negative correlation between beta- trophin levels and insulin sensitivity, Gómez-Ambrosi et al. [11] found a positive correlation between these two parameters in T2DM patients. A more recent study with a large sample size of T2DM patients, re- ported no significant correlation between beta- trophin levels and insulin resistance [20]. In our
study, we could not find any correlation between be- tatrophin and HOMA-IR in obese and control persons. The differences among published reports may be due to the design and sample size and varia- tions in demographics and ethnic characteristics of the studies. The variations among the studies in terms of betatrophin levels in these metabolic dis- orders may also be related to the inflammation degree. Calan et al. [21] reported a strong positive correlation between betatrophin and serum high sensitivity C-reactive protein (hs-CRP) which is an inflammatory marker. Moreover, several multiple linear regression analyses indicated that betatrophin levels are affected by hs-CRP independently. Thus, further human studies are warranted to clarify the relationship between betatrophin levels and insulin resistance.
Additionally, betatrophin is involved in the regu- lation of lipid metabolism by reducing triglyceride clearance [12,22]. Moreover, lipid metabolism is known to be affected by the variations in betatrophin sequence [23]. Although there is an evidence show- ing a strong association between betatrophin and lipid homeostasis, human studies on this issue are not sufficient. Betatrophin has been reported to be positively correlated with both LDL-C and TC [18].
Gao et al. [24] also reported a positive correlation be- tween betatrophin and TG. On the other hand, in an- other study, betatrophin levels were found to be pos- itively correlated with HDL-C and negatively corre- lated with TG [11]. In addition, Chen et al. [25] re- ported a negative correlation between betatrophin and TC, LDL-C and HDL-C. In our study, obese chil- dren did not exhibit dyslipidemia compared with controls. No significant correlations were found be- tween betatrophin levels and atherogenic lipid pro- files and also no significant correlation with HDL-C was detected in obesity and control groups.
The present study has some limitations. First, our study sample included small number of children.
Second limitation of the study is the technique used to evaluate insulin resistance. Although it is inferior to the clamp technique, we used the less invasive HOMA-IR method due to ethical considerations.
This should be taken into consideration in future studies about betatrophin levels. Finally, partic- ipants were not screened for the variations in beta- trophin sequence.
In summary, the present work is of importance be- cause we demonstrated that levels of betatrophin did not increase in obese and insulin resistant children compared to non-obese subjects, and they are not correlated with atherogenic indices. However, fur- ther studies are required to identify the betatrophin receptor and/or other possible cofactors in order to elucidate the exact role of betatrophin in obesity and/or insulin resistance.
REFERENCES
1. Schwimmer JB, Deutsch R, Kahen T, Lavine JE, Stanley C, Behling C. Prevalence of fatty liver in chil- dren and adolescents. Pediatrics 2006;118:1388-93.
2. Takahashi Y, Fukusato T. Pediatric nonalcoholic fatty liver disease: overview with emphasis on histology.
World J Gastroenterol 2010;16:5280-5.
3. Wong RJ, Ahmed A. Obesity and non-alcoholic fatty liv- er disease: disparate associations among Asian populations. World J Hepatol 2014;6:263-73.
4. Tominaga K, Kurata JH, Chen YK, Fujimoto E, Miyagawa S, Abe I, et al. Prevalence of fatty liver in Japanese children and relationship to obesity. An epi- demiological ultrasonographic survey. Dig Dis Sci 1995;40:2002-9.
5. Liu L, Mei M, Yang S, Li Q. Roles of chronic low-grade inflammation in the development of ectopic fat deposition. Mediators Inflamm 2014. doi: 10.1155/
2014/418185.
6. Nguyen P, Leray V, Diez M, Serisier S, Le Bloc'h J, Siliart B, et al. Liver lipid metabolism. J Anim Physiol Anim Nutr (Berl) 2008;92:272-83.
7. Marzuillo P, Del Giudice EM, Santoro N. Pediatric non-alcoholic fatty liver disease: new insights and fu- ture directions. World J Hepatol 2014;6:217-25.
8. Dali-Youcef N, Mecili M, Ricci R, Andrès E. Metabolic inflammation: connecting obesity and insulin resistance.
Ann Med 2013;45:242-53.
9. Wellen KE, Hotamisligil GS. Obesity-induced in- flammatory changes in adipose tissue. J Clin Invest 2003;112:1785-8.
10. Fu Z, Berhane F, Fite A, Seyoum B, Abou-Samra AB, Zhang R. Elevated circulating lipasin/betatrophin in
human type 2 diabetes and obesity. Sci Rep 2014;4:
5013.
11. Gómez-Ambrosi J, Pascual E, Catalán V, Rodríguez A, Ramírez B, Silva C, et al. Circulating betatrophin con- centrations are decreased in human obesity and type 2 diabetes. J Clin Endocrinol Metab 2014;99:E2004-9.
12. Wang Y, Quagliarini F, Gusarova V, Gromada J, Valenzuela DM, Cohen JC, et al. Mice lacking ANGPTL8 (Betatrophin) manifest disrupted trigly- ceride metabolism without impaired glucose homeo- stasis. Proc Natl Acad Sci U S A 2013;110:16109-14.
13. Wu S, Gao H, Ma Y, Fu L, Zhang C, Luo X.
Characterisation of betatrophin concentrations in childhood and adolescent obesity and insulin resis- tance. Pediatr Diabetes 2016;17:53-60.
14. Ozturk A, Mazicioglu MM, Hatipoglu N, Budak N, Keskin G, Yazlak Z, et al. Reference body mass index curves for Turkish children 6 to 18 years of age. J Pediatr Endocrinol Metab 2008;21:827-36.
15. Valerio G, Licenziati MR, Iannuzzi A, Franzese A, Siani P, Riccardi G, et al. Insulin resistance and impaired glu- cose tolerance in obese children and adolescents from Southern Italy. Nutr Metab Cardiovasc Dis 2006;16:
279-84.
16. Singh D, Das CJ, Baruah MP. Imaging of non alcoholic fatty liver disease: a road less travelled. Indian J Endocrinol Metab 2013;17:990-5.
17. Vos MB, Abrams SH, Barlow SE, Caprio S, Daniels SR, Kohli R, et al. NASPGHAN clinical practice guideline for the diagnosis and treatment of nonalcoholic fatty liver disease in children: recommendations from the Expert Committee on NAFLD (ECON) and the North American Society of Pediatric Gastroenterology, Hepa- tology and Nutrition (NASPGHAN). J Pediatr Gastro- enterol Nutr 2017;64:319-34.
18. Fenzl A, Itariu BK, Kosi L, Fritzer-Szekeres M, Kautzky-Willer A, Stulnig TM, et al. Circulating beta- trophin correlates with atherogenic lipid profiles but not with glucose and insulin levels in insulin-resistant individuals. Diabetologia 2014;57:1204-8.
19. Hu H, Sun W, Yu S, Hong X, Qian W, Tang B, et al.
Increased circulating levels of betatrophin in newly di- agnosed type 2 diabetic patients. Diabetes Care 2014;
37:2718-22.
20. Abu-Farha M, Abubaker J, Al-Khairi I, Cherian P, Noronha F, Hu FB, et al. Higher plasma beta- trophin/ANGPTL8 level in Type 2 Diabetes subjects does not correlate with blood glucose or insulin resis- tance. Sci Rep 2015;5:10949.
21. Calan M, Yilmaz O, Kume T, Unal Kocabas G, Yesil Senses P, Senses YM, et al. Elevated circulating levels of betatrophin are associated with polycystic ovary syndrome. Endocrine 2016;53:271-9.
22. Zhang R. Lipasin, a novel nutritionally-regulated liv- er-enriched factor that regulates serum triglyceride levels. Biochem Biophys Res Commun 2012;424:
786-92.
23. Quagliarini F, Wang Y, Kozlitina J, Grishin NV, Hyde R, Boerwinkle E, et al. Atypical angiopoietin-like pro- tein that regulates ANGPTL3. Proc Natl Acad Sci U S A 2012;109:19751-6.
24. Gao T, Jin K, Chen P, Jin H, Yang L, Xie X, et al.
Circulating betatrophin correlates with triglycerides and postprandial glucose among different glucose toler- ance statuses--a case-control study. PLoS One 2015;
10:e0133640.
25. Chen X, Lu P, He W, Zhang J, Liu L, Yang Y, et al.
Circulating betatrophin levels are increased in patients with type 2 diabetes and associated with insulin resistance. J Clin Endocrinol Metab 2015;100:E96-100.