PGHN
Original Article
Low Serum Potassium Levels Associated with Disease Severity in Children with Nonalcoholic Fatty Liver Disease
Adam Tabbaa, Mina Shaker, Rocio Lopez, Kazem Hoshemand*, Valerio Nobili*, and Naim Alkhouri
Digestive Disease Institute, Cleveland Clinic, Cleveland, OH, USA, *Bambino Gesu Children’s Hospital, Rome, Italy
Purpose: Recent studies have suggested that decreased serum potassium level may contribute to various metabolic disorders in adult patients including nonalcoholic fatty liver disease (NAFLD). We aimed to study the correlation between serum potassium levels and the histologic severity of NAFLD in children.
Methods: Pediatric patients with biopsy-proven NAFLD were included in this study. Demographic, clinical, and histo- pathological data were obtained. Multivariable logistic regression analysis was used to assess whether potassium levels are associated with the presence of nonalcoholic steatohepatitis (NASH) or fibrosis after adjusting for possible confounders. A p-value <0.05 was considered statistically significant.
Results: Among 125 biopsies, 49.6% (62) had evidence of NASH while 66.4% (83) had some degree of fibrosis (stage 1-3). Mean serum potassium was significantly lower in NASH group as compared to non-NASH group (4.4±0.42 mmoL/L vs. 4.8±0.21, p<0.001). Higher potassium level had negative correlation with presence of steatosis, balloon- ing, lobular inflammation, fibrosis and NAFLD activity score (p<0.05). On multivariable analysis and after adjusting for the metabolic syndrome and insulin resistance, higher potassium level was significantly associated with lower likelihood of having a histological diagnosis of NASH on biopsy (odds ratio [OR], 0.12; 95% confidence interval [95%
CI], 0.05-0.28; p<0.001). Similarly, the likelihood of having fibrosis decreases by 76% for every 0.5 mmoL/L increase in potassium (OR ,0.24; 95% CI, 0.11-0.54; p<0.001).
Conclusion: Our study shows an inverse relationship between serum potassium levels and the presence of ag- gressive disease (NASH and fibrosis) in children with NAFLD.
Key Words: Pediatrics, Fibrosis, Anatomy & histology, Non-alcoholic fatty liver disease, Non-alcoholic steatohepatitis, Potassium
Received:April 13, 2015, Revised:June 26, 2015, Accepted:August 24, 2015
Corresponding author: Naim Alkhouri, Digestive Disease Institute, Cleveland Clinic, 9500 Euclid Avenue, Cleveland, OH 44195, USA.
Tel: +1-216-445-7126, Fax: +1-216-444-2974, E-mail: [email protected] Copyright ⓒ 2015 by The Korean Society of Pediatric Gastroenterology, Hepatology and Nutrition
This is an openaccess article distributed under the terms of the Creative Commons Attribution NonCommercial License (http://creativecommons.org/licenses/by-nc/4.0/) which permits unrestricted noncommercial use, distribution, and reproduction in any medium, provided the original work is properly cited.
INTRODUCTION
Nonalcoholic fatty liver disease (NAFLD) is a spec-
trum of related disorders characterized by hepatic steatosis with progression to nonalcoholic steatohe- patitis (NASH), fibrosis and eventually cirrhosis. It is
now understood that NAFLD is effectively the hep- atic manifestation of the metabolic syndrome and both insulin resistance and obesity are closely asso- ciated with NAFLD [1,2]. Indeed, the incidence of NAFLD in the pediatric population has paralleled the rise of the obesity epidemic and is now the most com- mon cause of liver disease in children and adults in the developed world [3,4]. The progression of simple steatosis to NASH requires several factors acting to- gether in parallel, as proposed in the “multiple hit”
hypothesis [5]. Insulin resistance plays a central role in the development & progression of NAFLD [6].
Multiple studies have suggested a link between se- rum potassium and insulin resistance [7-9]. More recently, data from an adult population suggested a link between serum potassium levels and NAFLD [10]. Lipid peroxidation and oxidative stress are known mechanisms that contribute to disease pro- gression to NASH and liver fibrosis [11]. Recent evi- dence suggests that potassium-rich diets can lower lipid-induced oxidative stress in obese individuals [12]. We aimed to study the correlation between se- rum potassium levels and the histologic severity of NAFLD in children.
MATERIALS AND METHODS
Patients
Consecutive pediatric patients with biopsy-proven NAFLD from Bambino Gesu Children’s Hospital, Rome, Italy, were enrolled into a prospectively main- tained database and included in this study. Inclusion criteria were a biopsy consistent with the diagnosis of NAFLD, persistently increased aminotransferase levels, and diffusely echogenic liver on imaging stud- ies suggestive of fatty liver [13,14]. Exclusion criteria were hepatic virus infections (hepatitis A, B, C, D, and E); cytomegalovirus; and Epstein-Barr virus), alcohol consumption, history of parenteral nutrition, and use of known steatosis-inducing drugs (such as valproate, amiodarone, or prednisone) or drugs known to affect body weight, carbohydrate metabolism, and potassium levels (such as insulin and hydrochlo- rothiazide). Autoimmune liver disease, metabolic
liver disease, Wilson disease and alpha1-antitryp- sin-associated liver disease were ruled out using standard clinical, laboratory, and histological criteria.
The ethics committee of the Bambino Gesu Children’s Hospital and Research Institute approved the study.
Demographic and clinical data
We obtained demographic data (including age at first visit and sex) and recorded the clinical variables, including waist circumference (WC), height, and weight. We calculated the body mass index (BMI) and its standard deviation score (z score) [15]. We defined obesity by a BMI ≥95th percentile adjusted for age and sex. Metabolic syndrome (Mets) was de- fined as the presence of ≥3 of the following 5 criteria [16]: abdominal obesity (defined by WC ≥90th per- centile for age) [17]; hypertriglyceridemia as trigly- ceride (TG) >95th percentile for age, sex, and race;
low high-density lipoprotein cholesterol as concen- trations <5th percentile for age and sex; hyper- tension as systolic or diastolic blood pressure >95th percentile for age and sex [18]; and impaired fasting glucose or known type 2 diabetes mellitus [19].
Laboratory tests, including potassium, sodium, crea- tinine, bilirubin and albumin, platelet count, meta- bolic syndrome, alanine aminotransferase, aspartate aminotransferase (AST), gamma-glutamyltranspepti- dase, alkaline-phosphate, fasting glucose and in- sulin, ferritin, cholesterol and TGs, were performed in all subjects within 1 week before liver biopsy. The homeostasis model assessment index of insulin re- sistance (HOMA-IR) [20], insulin sensitivity index [21], and the quantitative insulin sensitivity check index (QUICKI) [22] were calculated as surrogate markers of insulin sensitivity. All the data were uni- formly collected at the time of patient evaluation to avoid recall bias.
Liver histology
The clinical indications for liver biopsy included the need to assess the presence of NASH and degree of fibrosis or to identify other likely independent or competing liver diseases. Liver biopsy was performed in all children, after an overnight fast, using an auto-
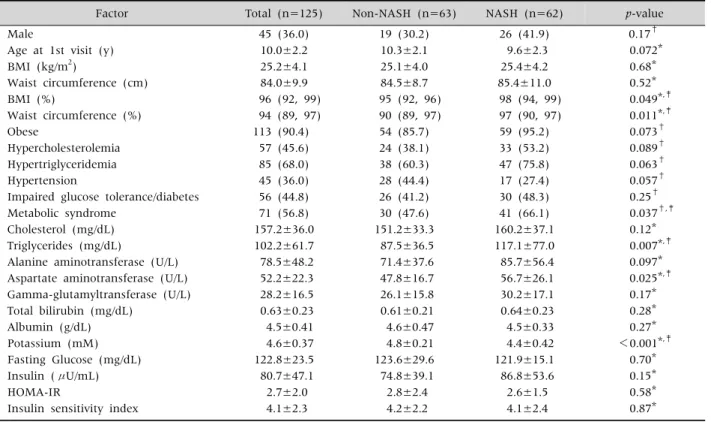
Table 1.Demographic and Clinical Characteristics
Factor Total (n=125) Non-NASH (n=63) NASH (n=62) p-value
Male 45 (36.0) 19 (30.2) 26 (41.9) 0.17†
Age at 1st visit (y) 10.0±2.2 10.3±2.1 9.6±2.3 0.072*
BMI (kg/m2) 25.2±4.1 25.1±4.0 25.4±4.2 0.68*
Waist circumference (cm) 84.0±9.9 84.5±8.7 85.4±11.0 0.52*
BMI (%) 96 (92, 99) 95 (92, 96) 98 (94, 99) 0.049*,‡
Waist circumference (%) 94 (89, 97) 90 (89, 97) 97 (90, 97) 0.011*,‡
Obese 113 (90.4) 54 (85.7) 59 (95.2) 0.073†
Hypercholesterolemia 57 (45.6) 24 (38.1) 33 (53.2) 0.089†
Hypertriglyceridemia 85 (68.0) 38 (60.3) 47 (75.8) 0.063†
Hypertension 45 (36.0) 28 (44.4) 17 (27.4) 0.057†
Impaired glucose tolerance/diabetes 56 (44.8) 26 (41.2) 30 (48.3) 0.25†
Metabolic syndrome 71 (56.8) 30 (47.6) 41 (66.1) 0.037†,‡
Cholesterol (mg/dL) 157.2±36.0 151.2±33.3 160.2±37.1 0.12*
Triglycerides (mg/dL) 102.2±61.7 87.5±36.5 117.1±77.0 0.007*,‡
Alanine aminotransferase (U/L) 78.5±48.2 71.4±37.6 85.7±56.4 0.097*
Aspartate aminotransferase (U/L) 52.2±22.3 47.8±16.7 56.7±26.1 0.025*,‡
Gamma-glutamyltransferase (U/L) 28.2±16.5 26.1±15.8 30.2±17.1 0.17*
Total bilirubin (mg/dL) 0.63±0.23 0.61±0.21 0.64±0.23 0.28*
Albumin (g/dL) 4.5±0.41 4.6±0.47 4.5±0.33 0.27*
Potassium (mM) 4.6±0.37 4.8±0.21 4.4±0.42 <0.001*,‡
Fasting Glucose (mg/dL) 122.8±23.5 123.6±29.6 121.9±15.1 0.70*
Insulin (μU/mL) 80.7±47.1 74.8±39.1 86.8±53.6 0.15*
HOMA-IR 2.7±2.0 2.8±2.4 2.6±1.5 0.58*
Insulin sensitivity index 4.1±2.3 4.2±2.2 4.1±2.4 0.87*
Values presented as number (%), mean±standard deviation, or median (25th, 75th percentiles).
NASH: nonalcoholic steatohepatitis, BMI: body mass index, HOMA-IR: homeostasis model assessment index of insulin resistance.
*ANOVA, †Pearson's chi-square test, ‡p-values are statistically significant.
matic core biopsy 18-gauge needle (Biopince, Amedic, Sweden) under general anesthesia and ultrasound guidance. A Sonoline Omnia ultrasound machine (Siemens, Munich, Germany) equipped with a 5-MHz probe (5.0 C 50; Siemens) and a biopsy adaptor was used. We performed 2 biopsy passes within different liver segments for each subject and recorded the length of the liver specimen (in millimeters). Only samples with a length ≥15 mm and including at least 5 to 6 complete portal tracts [23] were consid- ered adequate for the purpose of the study. Biopsies were evaluated by a single hepatopathologist who was blinded to clinical and laboratory data. Biopsies were routinely processed (i.e., formalin-fixed and paraffin-embedded) and sections of liver tissue, 5-mm thick, were stained with hematoxylin-eosin, Van Gieson, periodic acid-Schiff diastase, and Pru- ssian blue stain.
Patients were divided into 2 groups according to
the pathologic diagnosis: NASH and non-NASH (simple steatosis). Liver biopsy features were graded according to the NAFLD activity scoring (NAS) sys- tem proposed by Kleiner et al. [24]. Briefly, grade of steatosis was scored as 0, ≤5%; 1, 5% to 33%; 2, ≥33%
to 66%; and 3, ≥66%; grade of lobular inflammation was scored as 0, no foci; 1, <2 foci/200× field; 2, 2 to 4 foci/200× field; and 3, >4 foci/200× field; and grade of ballooning was scored as 0, none; 1, few bal- looning cells; and 2, many cells/prominent bal- looning. The grades of steatosis (0-3), lobular in- flammation (0-3), and ballooning (0-2) were then combined to determine the NAS (0-8). Fibrosis was scored as 0, none; 1, periportal or perisinusoidal fib- rosis; 2, perisinusoidal and portal/periportal fibrosis;
3, bridging fibrosis; and 4, cirrhosis.
Statistical analysis
Descriptive statistics were computed for all factors.
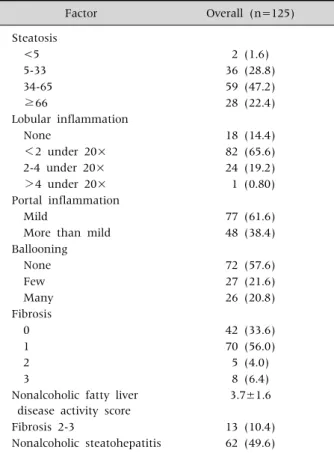
Table 2. Histological Features
Factor Overall (n=125)
Steatosis
<5 2 (1.6)
5-33 36 (28.8)
34-65 59 (47.2)
≥66 28 (22.4)
Lobular inflammation
None 18 (14.4)
<2 under 20× 82 (65.6)
2-4 under 20× 24 (19.2)
>4 under 20× 1 (0.80)
Portal inflammation
Mild 77 (61.6)
More than mild 48 (38.4)
Ballooning
None 72 (57.6)
Few 27 (21.6)
Many 26 (20.8)
Fibrosis
0 42 (33.6)
1 70 (56.0)
2 5 (4.0)
3 8 (6.4)
Nonalcoholic fatty liver disease activity score
3.7±1.6
Fibrosis 2-3 13 (10.4)
Nonalcoholic steatohepatitis 62 (49.6)
Values are presented as number (%) or mean±standard deviation.
Data are presented as mean±standard deviation, median (25th, 75th percentiles) or n (%). A uni- variable analysis was performed to compare subjects with NAS ≥4 to those with NAS 1-3; ANOVA was used to compare potassium levels and Kruskal-Wallis test was used to compare potassium tertiles (3.6-4.4, 4.5-4.8 and 4.9-5.2). The same was done for any fib- rosis (fibrosis stage 1-3) and moderate fibrosis (fibrosis stage 2-3). Spearman’s correlations coefficients were used to assess correlations between bilirubin levels and histologic features. In addition, multivariable lo- gistic regression analysis was used to further assess whether potassium levels are associated with NAS ≥4 or fibrosis after adjusting for possible cofounders.
Potassium level, HOMA and MS were forced into the models and an automated stepwise variable selection method performed on 1,000 bootstrap samples was used to choose the final models. A p<0.05 was con- sidered statistically significant. All analyses were performed using SAS software (version 9.2; SAS Institute, Cary, NC, USA) and R (version 2.15.2; The R Foundation for Statistical Computing, Vienna, Austria).
RESULTS
Patient characteristics
A total of 125 children (36.0% boys) with biop- sy-proven NAFLD were included. The baseline an- thropometric, clinical and laboratory data are sum- marized in Table 1. The mean age at the initial visit was 10.0±2.2 years. More than half of the patients had MetS, and 113 patients (90.4%) were obese.
Patients with NASH had significantly higher BMI percentile, WC percentile, TG level, AST level, preva- lence of MetS, and lower high-density lipoprotein level than patients in the non-NASH group; p-value
<0.05 for all (Table 1). The main histological fea- tures are included in Table 2. A total of 49.6% of the cases (62 patients) was classified as NASH according to pathologist diagnosis. Two-thirds of the patients had mild severity of lobular inflammation, while 61.6% revealed at least mild portal inflammation.
Ballooning was present in only 42.4% of patients.
Some degree of fibrosis was seen in the majority of patients (66.4%): mild fibrosis (stage 1) in 70 pa- tients (56.0%), moderate fibrosis (stage 2) in 5 pa- tients (4.0%), and advanced fibrosis (stage 3) in 8 pa- tients (6.4%). None of the patients included in the study had liver cirrhosis. The mean NAS was 3.7±1.6.
Serum potassium levels in relation to histo- pathological features
Mean serum potassium was significantly lower in NASH group as compared to non-NASH group (4.4±0.42 mmoL/L vs. 4.8±0.21, p<0.001; Fig. 1).
Higher potassium level had negative correlation with presence of steatosis, ballooning, lobular inflamma- tion, fibrosis and NAFLD activity score (p<0.05; Table 3). On multivariable analysis and after adjusting for the metabolic syndrome and insulin resistance, higher potassium level was significantly associated
Fig. 1. Potassium levels in patients with and without nonalcoholic steatohepatitis (NASH). The box represents the interquartile range (25th and 75th percentiles) from the median (the horizontal line). The bars represent the 95% confidence interval. The median potassium level was significantly lower than in the NASH group compared with the non-NASH group (4.4±0.42 mmoL/L vs.
4.8±0.21, p<0.001).
Table 3. Correlations between Potassium and Histological Features
Factor rho 95% confidence
interval p-value
Steatosis −0.34 −0.51-−0.17 <0.001
Inflammation −0.18 −0.36-−0.01 0.039
Ballooning −0.53 −0.68-−0.38 <0.001
NAS −0.54 −0.69-−0.39 <0.001
Fibrosis −0.25 −0.43-−0.08 0.005
NAS: nonalcoholic fatty liver disease activity score, rho: Spearman correlation coefficient.
with lower likelihood of having a histological diag- nosis of NASH on biopsy (odds ratio [OR], 0.12; 95%
confidence interval [95% CI], 0.05-0.28); p<0.001].
Similarly, the likelihood of having fibrosis decreases by 76% for every 0.5 mmoL/L increase in potassium (OR, 0.24; 95% CI, 0.11-0.54; p<0.001).
DISCUSSION
The main finding of this study is the negative asso- ciation between serum potassium levels and histo- logical severity of NAFLD in pediatric patients.
Serum potassium levels negatively correlate with the presence of both fibrosis and NASH on liver biopsy.
After adjusting for HOMA, MetS, TGs, bilirubin and gender, for every 0.5 mmoL/L increase in potassium, the likelihood of having NASH decreases by 88%
(OR, 0.12; 95% CI, 0.05-0.28; p<0.001). While this is the first study that demonstrates a correlation be- tween potassium and histological severity of NAFLD, the literature reveals an association between potas- sium levels, insulin resistance and the metabolic syndrome. A large population-based study showed an inverse relationship between serum potassium level and prevalence of metabolic syndrome among a group of 10,341 Chinese adults [25]. Interestingly,
that study also found that the prevalence rate of in- sulin resistance decreases with increased serum po- tassium quartiles (p<0.0001). Insulin resistance is closely associated with development and pro- gression of NAFLD. Schwimmer et al. [2] demon- strated that severity of steatosis was predicted by the combination of age, ethnicity, and insulin sensitivity (QUICKI) in a group of 43 children with biop- sy-proven NAFLD. Indeed, HOMA-IR and QUICKI were used in the predictive models of that study and proved to be important correlates of liver histopa- thology. The dramatic increase in pediatric NAFLD is directly related to consumption of high fat and Western diets that are rich in oils, sugar, and sweet- eners and contain negligible amounts of macro- minerals such as potassium. In a recent study, hydro- chlorothiazide and high fat diet intake caused a sig- nificant reduction in magnesium and potassium lev- els leading to an increase in hepatic oxidative stress and lipid peroxidation in rats [26]. These findings may provide a mechanistic link for the association between low potassium levels and the development of advanced NAFLD that we found in our study.
The association between low serum potassium lev- els and NAFLD has been described in a cross-sec- tional study involving 8,592 Chinese adult patients, 30.3% of whom had NAFLD diagnosed on liver ultra- sound [10]. In that study, patients with NAFLD had lower serum potassium levels than patients without NAFLD. Histopathological data were not obtained in that study, so that benign hepatic steatosis could not be differentiated from severe disease activity such as fibrosis or NASH.
The strengths of this study are the inclusion of a large group of children with biopsy-proven NAFLD with the full spectrum of disease along with an ex- tensive characterization of their clinical, metabolic, and histological profile. This gives us the opportunity to identify a subgroup of patients who may be at a higher risk for developing NASH, and may require even closer follow-up.
Our study has some limitations including the fact that patients were seen at a large referral tertiary care medical center as evidenced by the fact that two-thirds of our patients with NAFLD had NASH on biopsy. The results may not be generalized to differ- ent populations and settings. Second, most of the pa- tients were Caucasian, making it difficult to deter- mine whether the association between potassium levels and histological severity of NAFLD is different among other ethnic groups. This study does not at- tempt to propose any mechanistic links between se- rum potassium levels and severity of histological fea- tures, but that was not the purpose of this study. As this was a cross-sectional study, there was no fol- low-up information available on serum potassium levels in our patients. Lastly, we do not have in- formation on patient dietary and potassium intake.
In conclusion, our study shows an inverse rela- tionship between serum potassium levels and the presence of aggressive disease (NASH and fibrosis) in children with NAFLD. Future studies are needed to investigate the mechanism of this association and determine if increasing potassium level through medications or dietary intake could be effective to ameliorate the severity of NAFLD.
REFERENCES
1. Marchesini G, Brizi M, Bianchi G, Tomassetti S, Bugianesi E, Lenzi M, et al. Nonalcoholic fatty liver dis- ease: a feature of the metabolic syndrome. Diabetes 2001;50:1844-50.
2. Schwimmer JB, Deutsch R, Rauch JB, Behling C, Newbury R, Lavine JE. Obesity, insulin resistance, and other clinicopathological correlates of pediatric non- alcoholic fatty liver disease. J Pediatr 2003;143:500-5.
3. Ogden CL, Carroll MD, Kit BK, Flegal KM. Prevalence
of obesity and trends in body mass index among US chil- dren and adolescents, 1999-2010. JAMA 2012;307:
483-90.
4. Pacifico L, Nobili V, Anania C, Verdecchia P, Chiesa C.
Pediatric nonalcoholic fatty liver disease, metabolic syndrome and cardiovascular risk. World J Gastroen- terol 2011;17:3082-91.
5. Tilg H, Moschen AR. Evolution of inflammation in non- alcoholic fatty liver disease: the multiple parallel hits hypothesis. Hepatology 2010;52:1836-46.
6. Asrih M, Jornayvaz FR. Inflammation as a potential link between nonalcoholic fatty liver disease and in- sulin resistance. J Endocrinol 2013;218:R25-36.
7. Norbiato G, Bevilacqua M, Meroni R, Raggi U, Dagani R, Scorza D, et al. Effects of potassium supplementation on insulin binding and insulin action in human obesity:
protein-modified fast and refeeding. Eur J Clin Invest 1984;14:414-9.
8. Mariosa LS, Ribeiro-Filho FF, Batista MC, Hirota AH, Borges RL, Ribeiro AB, et al. Abdominal obesity is asso- ciated with potassium depletion and changes in glucose homeostasis during diuretic therapy. J Clin Hypertens (Greenwich) 2008;10:443-9.
9. Rowe JW, Tobin JD, Rosa RM, Andres R. Effect of ex- perimental potassium deficiency on glucose and insulin metabolism. Metabolism 1980;29:498-502.
10. Sun K, Lu J, Jiang Y, Xu M, Xu Y, Zhang J, et al. Low serum potassium level is associated with nonalcoholic fatty liver disease and its related metabolic disorders.
Clin Endocrinol (Oxf) 2014;80:348-55.
11. Alkhouri N, Dixon LJ, Feldstein AE. Lipotoxicity in nonalcoholic fatty liver disease: not all lipids are cre- ated equal. Expert Rev Gastroenterol Hepatol 2009;
3:445-51.
12. Azadbakht L, Mirmiran P, Esmaillzadeh A, Azizi T, Azizi F. Beneficial effects of a dietary approaches to stop hypertension eating plan on features of the metabolic syndrome. Diabetes Care 2005;28:2823-31.
13. Nobili V, Marcellini M, Devito R, Ciampalini P, Pie- monte F, Comparcola D, et al. NAFLD in children: a pro- spective clinical-pathological study and effect of life- style advice. Hepatology 2006;44:458-65.
14. Manco M, Bedogni G, Marcellini M, Devito R, Ciampal- ini P, Sartorelli MR, et al. Waist circumference corre- lates with liver fibrosis in children with non-alcoholic steatohepatitis. Gut 2008;57:1283-7.
15. Cole TJ, Bellizzi MC, Flegal KM, Dietz WH. Establish- ing a standard definition for child overweight and obe- sity worldwide: international survey. BMJ 2000;320:
1240-3.
16. Boney CM, Verma A, Tucker R, Vohr BR. Metabolic syn-
drome in childhood: association with birth weight, ma- ternal obesity, and gestational diabetes mellitus. Pe- diatrics 2005;115:e290-6.
17. Fernández JR, Redden DT, Pietrobelli A, Allison DB.
Waist circumference percentiles in nationally repre- sentative samples of African-American, European- American, and Mexican-American children and ado- lescents. J Pediatr 2004;145:439-44.
18. Zahka KG. Report of the second task force on blood pres- sure control in children. Md Med J 1987;36:323-5.
19. Genuth S, Alberti KG, Bennett P, Buse J, Defronzo R, Kahn R, et al; Expert Committee on the Diagnosis and Classification of Diabetes Mellitus. Follow-up report on the diagnosis of diabetes mellitus. Diabetes Care 2003;26:3160-7.
20. Matthews DR, Hosker JP, Rudenski AS, Naylor BA, Treacher DF, Turner RC. Homeostasis model assess- ment: insulin resistance and beta-cell function from fasting plasma glucose and insulin concentrations in man. Diabetologia 1985;28:412-9.
21. Matsuda M, DeFronzo RA. Insulin sensitivity indices obtained from oral glucose tolerance testing: compar- ison with the euglycemic insulin clamp. Diabetes Care 1999;22:1462-70.
22. Katz A, Nambi SS, Mather K, Baron AD, Follmann DA, Sullivan G, et al. Quantitative insulin sensitivity check index: a simple, accurate method for assessing insulin sensitivity in humans. J Clin Endocrinol Metab 2000;
85:2402-10.
23. Poynard T, Halfon P, Castera L, Charlotte F, Le Bail B, Munteanu M, et al; FibroPaca Group. Variability of the area under the receiver operating characteristic curves in the diagnostic evaluation of liver fibrosis markers:
impact of biopsy length and fragmentation. Aliment Pharmacol Ther 2007;25:733-9.
24. Kleiner DE, Brunt EM, Van Natta M, Behling C, Contos MJ, Cummings OW, et al; Nonalcoholic Steatohepatitis Clinical Research Network. Design and validation of a histological scoring system for nonalcoholic fatty liver disease. Hepatology 2005;41:1313-21.
25. Sun K, Su T, Li M, Xu B, Xu M, Lu J, et al. Serum potas- sium level is associated with metabolic syndrome: a population-based study. Clin Nutr 2014;33:521-7.
26. Ribeiro MC, Avila DS, Barbosa NB, Meinerz DF, Waczuk EP, Hassan W, et al. Hydrochlorothiazide and high-fat diets reduce plasma magnesium levels and in- crease hepatic oxidative stress in rats. Magnes Res 2013;26:32-40.