PGHN
Original Article
The Clinical Significance of Serum Ferritin in Pediatric Non-Alcoholic Fatty Liver Disease
Ji Hoon Na, So Won Park, Yunkoo Kang, Hong Koh and Seung Kim
Department of Pediatrics, Severance Children’s Hospital, Yonsei University College of Medicine, Seoul, Korea
Purpose: Non-alcoholic fatty liver disease (NAFLD) in children has become an important public health issue because of its high prevalence and severity. Several noninvasive methods for estimating NAFLD are under investigation.
We aimed to evaluate the usefulness of serum ferritin as a biomarker of severity of pediatric NAFLD patients.
Methods: A total of 64 NAFLD patient were enrolled from Severance Children’s Hospital from March 2010 to February 2013. Serum ferritin levels, liver related laboratory tests, liver magnetic resonance imaging (MRI) (2-dimensional [2D] proton density-fat fraction) and NAFLD severity markers were compared between obese group and overweight group. Correlation analyses were performed between serum ferritin and laboratory values including NAFLD severity markers.
Results: In obese group, serum ferritin, alanine aminotransferase (ALT), total bilirubin, international normalized ratio (INR), MRI 2D proton density-fat fraction, aspartate aminotransferase (AST) to platelet ratio index (APRI) and fib- rosis-4 (FIB-4) (an index score calculated from platelet count, ALT, AST and age) were significantly higher than those of overweight group. NAFLD severity markers, APRI and FIB-4, and liver specific important laboratory values, AST, ALT, INR, cholesterol, triglyceride and low density lipoprotein show significant correlation with serum ferritin in NAFLD patients.
Conclusion: Serum ferritin concentrations could be a candidate of useful severity marker in the pediatric NAFLD patients.
Key Words: Non-alcoholic fatty liver disease, Child, Ferritins, Biological markers, Obesity
Received:August 28, 2014, Revised:September 23, 2014, Accepted:October 3, 2014
Corresponding author: Seung Kim, Department of Pediatrics, Severance Children’s Hospital, 50-1, Yonsei-ro, Seodaemun-gu, Seoul 120-749, Korea. Tel: +82-2-2227-2743, Fax: +82-2-393-3080, E-mail: [email protected]
Copyright ⓒ 2014 by The Korean Society of Pediatric Gastroenterology, Hepatology and Nutrition
This is an openaccess article distributed under the terms of the Creative Commons Attribution NonCommercial License (http://creativecommons.org/licenses/by-nc/3.0/) which permits unrestricted noncommercial use, distribution, and reproduction in any medium, provided the original work is properly cited.
INTRODUCTION
Non-alcoholic fatty liver disease (NAFLD) repre- sents a spectrum of liver diseases ranging from hep- atocellular steatosis to irreversible liver cirrhosis and
is closely related to obesity and metabolic syndrome [1]. Metabolic syndrome is characterized by obesity, hyperlipidemia, diabetes mellitus (DM), and insulin resistance. In adults, as well as hypertension, obe- sity, and DM, the frequency of metabolic syndrome
is increasing gradually. Metabolic syndrome can be manifested as NAFLD in the liver [2-4]. The preva- lence of NAFLD is also increasing due to the increase in the rate of metabolic syndrome. NAFLD is raising the morbidity and mortality rates associated with the liver [5]. In western countries, the morbidity of NAFLD is 20-30% of total adults and 90% of obese adults. Moreover, non-alcoholic steatohepatitis (NASH) is affecting an estimated 2-3% of the general pop- ulation and up to 37% of obese individuals [1].
Approximately 10% of patients with NAFLD progress to NASH, and 8-26% of NASH patients progress to cirrhosis [2].
The prevalence of NAFLD in children and young adults is also increasing rapidly. Studies have re- ported about 3% prevalence of NAFLD in the general pediatric population and 53% in obese children [1].
Due to the Westernized lifestyle and diet, pediatric NAFLD is expected to increase significantly in the fu- ture globally. Furthermore, NAFLD can have more severe influence to children due to longer duration of the disease. Therefore, as with adults, the im- portance of the early diagnosis and proper treatment of NAFLD and NASH in children is increasing in or- der to prevent liver cirrhosis and hepatocellular carcinoma.
NAFLD can be diagnosed after the exclusion of other liver diseases and identifying image studies of the fatty liver [6]. To diagnose NASH, various meth- ods―including magnetic resonance imaging (MRI) proton density-fat fraction (PDFF), which has been actively studied recently―are being used. MRI PDFF is a non-invasive and quantitative means of quanti- fying hepatic steatosis in patients with NAFLD [7].
However, the exact cut-off value has yet not been es- tablished, and the MRI equipment itself is not easily obtained due to its high price. Confirmation of the disease can be made only by pathology, which is characterized as steatosis, lobular inflammation, and hepatocellular ballooning [2,8]. However, liver biopsy is invasive in children. Furthermore, there is the possibility of sampling error of liver biopsy speci- mens [9]. Therefore, to follow up on the progression of NAFLD, repeated liver biopsies are nearly impos-
sible, especially for children. Thus, researchers are seeking non-invasive and cost-effective tools for the diagnosis of NAFLD and NASH. They are making ef- forts to develop biological markers to predict the pro- gression from simple fatty liver to NASH, liver fib- rosis, cirrhosis, and hepatocellular carcinoma [10].
In recent adult studies, serum ferritin levels were re- ported to be an independent predictor of advanced hepatic fibrosis in patients with NAFLD based on its correlation with hepatic inflammation and hepatic iron storage [10]. Serum ferritin levels are known to be elevated in patients with NAFLD and seem to be related to insulin resistance and hepatocyte damage [11]. So researchers are interested in serum ferritin as a biomarker that can reflect the inflammatory change of the liver for children as well. In fact, pedia- tric gastroenterologists are more earnestly seeking simple and noninvasive biologic markers for NAFLD.
If simple and non-invasive biologic markers for NAFLD are found, it will be very helpful in disease management due to improved compliance of fol- low-up. Also early detection or screening could be possible for the pediatric NAFLD patients who may progress to liver cirrhosis. Proper medical treatment to the patients could be provided at an appropriate time accordingly. We also can expect an additional effect that might reduce patient's medical expenses from other expensive and invasive diagnostic meth- ods and its possible complications. For these reasons, we were to investigate the clinical significance of se- rum ferritin in pediatric NAFLD patients as a candi- date of effective and less-invasive biological marker.
MATERIALS AND METHODS
Study design
A total of 64 patients diagnosed as NAFLD at Seve- rance Children’s Hospital, Seoul, Korea, from March 2010 to February 2013 were included in this study.
We selected patients whose repetitive alanine amino- transferase (ALT) was abnormal (30 U/L or more for men and 19 U/L or more for women) [12] for un- known reasons in the regular check-up. Patients with ALT elevation for certain reasons (e.g., hepatitis B,
Table 1.Characteristics of Patients of Non-Alcoholic Fatty Liver Disease (NAFLD) Children
Variable Total (n=64) Overweight (n=16) Obese (n=48) p-value
Age AST (IU/L) ALT (IU/L) Albumin (g/dL) Total bilirubin (mg/dL) Platelet count (103/μL) INR
Transferein saturation (%) Serum iron (μg/dL) Cholesterol (mg/dL) Triglyceride (mg/dL) HDL (mg/dL) LDL (mg/dL) MRI 2D PDFF
NAFLD severity markers APRI
AAR FIB-4
13.35 (9.80-20.00) 52.00 (12.00-451.00) 108.50 (16.00-591.00)
4.70 (4.10-5.20) 0.50 (0.20-1.80) 312.00 (189.00-587.00)
0.98 (0.86-1.11) 27.00 (2.00-335.10) 96.00 (11.00-185.00) 189.50 (109.00-374.00) 135.50 (53.00-516.00)
47.00 (25.00-68.00) 118.00 (42.00-178.00)
36.00 (6.00-47.20)
0.40 (0.14-1.92) 0.54 (0.30-1.84) 0.24 (0.11-0.95)
11.70 (10.10-15.10) 49.50 (30.00-101.00) 94.00 (55.00-155.00)
4.70 (4.30-4.90) 0.45 (0.20-0.70) 339.50 (266.00-403.00)
0.98 (0.94-1.11) 29.00 (17.00-316.00) 97.00 (58.00-127.00) 178.00 (155.00-374.00) 175.50 (70.00-289.00)
48.00 (25.00-61.00) 103.20 (81.60-146.00)
32.80 (6.00-47.20)
0.33 (0.24-0.95) 0.52 (0.30-1.84) 0.16 (0.12-0.61)
14.15 (9.80-20.00) 54.00 (12.00-451.00) 120.50 (16.00-591.00)
4.60 (4.10-5.20) 0.50 (0.20-1.80) 303.00 (189.00-587.00)
0.98 (0.86-1.10) 26.50 (2.00-335.10) 95.50 (11.00-185.00) 191.50 (109.00-269.00) 131.50 (53.00-516.00)
47.00 (27.00-68.00) 122.00 (42.00-178.00)
41.20 (22.00-46.60)
0.42 (0.14-1.92) 0.54 (0.30-1.76) 0.26 (0.11-0.95)
<0.0001 0.4023 0.1582 0.8509 0.1004 0.0924 0.3786 0.8038 0.8040 0.9629 0.0909 0.5443 0.1274 0.0194
0.0463 0.7272 0.0010 Values are presented as median (minimum-maximum).
AST: aspartate aminotransferase, ALT: alanine aminotransferase, INR: international normalized ratio, HDL: high density lipoprotein, LDL: low density lipoprotein, MRI 2D PDFF: magnetic resonance imaging 2-dimensional proton density-fat fraction, APRI: AST to platelet ratio index, AAR: AST/ALT ratio, FIB-4: fibrosis-4.
hepatitis C, hepatitis A, Wilson’s disease, hemochro- matosis, etc.) were excluded. No patients in the pop- ulation reported active substance abuse or significant systemic illnesses or were taking drugs known to cause hepatic steatosis. All patients had a diagnosis of NAFLD based on cryptogenic etiology and MRI-PDFF imaging with steatosis >5% [7]. Laboratory tests (e.g., iron profiles, liver function tests, and lipid pro- files), MRI PDFF values were obtained from patients’
medical records and analyzed. NAFLD severity mark- ers―such as the aspartate aminotransferase (AST) to platelet (PLT) ratio index (APRI), AST/ALT ratio (AAR), and fibrosis-4 (FIB-4)―that are known as predictors of liver fibrosis were also calculated and analyzed [11,13].
1. Differences between obese and overweight group We aimed to evaluate whether the body mass in- dex (BMI) influences the variables associated liver and serum ferritin. Therefore, we examined the dif- ferences in the laboratory values, MRI PDFF values and NAFLD severity makers between overweight and obese groups, which were divided by BMI percentile.
Obesity was defined as a BMI in the 95th percentile or higher, while overweight was defined as a BMI in the 85th-95th percentile considering age and sex.
2. Correlation of laboratory values and NAFLD se- verity markers with serum ferritin level
To evaluate the significance of serum ferritin level, correlation between several liver specific laboratory values, MRI 2-dimensional (2D) PDFF and NAFLD severity markers with serum ferritin were analyzed.
Statistical analysis
Baseline characteristics were presented as the me- dian and range in parentheses. The obese group and overweight group were compared using Mann- Whitney U test. Correlations between laboratory and serum ferritin were assessed by Spearman analysis.
For better understanding, the scatter plot of NAFLD severity markers was displayed with Spearman cor- relation coefficient. All tests were two-sided and a p-value of 0.05 was considered to be statistically significant. Also, statistical analyses were conducted with IBM SPSS Statistics version 20.0 (IBM Co.,
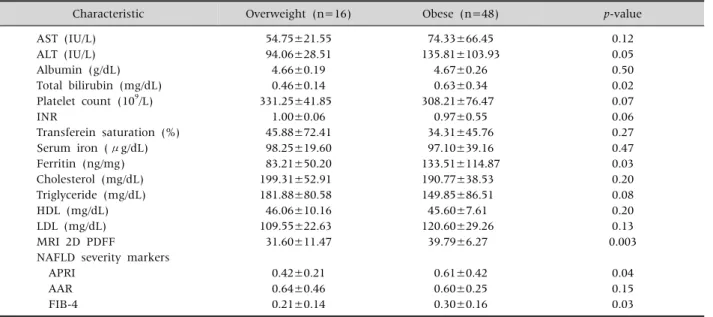
Table 2.Laboratory Value Differences between Obese and Overweight Group
Characteristic Overweight (n=16) Obese (n=48) p-value
AST (IU/L) ALT (IU/L) Albumin (g/dL) Total bilirubin (mg/dL) Platelet count (109/L) INR
Transferein saturation (%) Serum iron (μg/dL) Ferritin (ng/mg) Cholesterol (mg/dL) Triglyceride (mg/dL) HDL (mg/dL) LDL (mg/dL) MRI 2D PDFF
NAFLD severity markers APRI
AAR FIB-4
54.75±21.55 94.06±28.51 4.66±0.19 0.46±0.14 331.25±41.85
1.00±0.06 45.88±72.41 98.25±19.60 83.21±50.20 199.31±52.91 181.88±80.58 46.06±10.16 109.55±22.63 31.60±11.47
0.42±0.21 0.64±0.46 0.21±0.14
74.33±66.45 135.81±103.93
4.67±0.26 0.63±0.34 308.21±76.47
0.97±0.55 34.31±45.76 97.10±39.16 133.51±114.87 190.77±38.53 149.85±86.51 45.60±7.61 120.60±29.26
39.79±6.27
0.61±0.42 0.60±0.25 0.30±0.16
0.12 0.05 0.50 0.02 0.07 0.06 0.27 0.47 0.03 0.20 0.08 0.20 0.13 0.003
0.04 0.15 0.03 Values are presented as mean±standard deviation.
AST: aspartate aminotransferase, ALT: alanine aminotransferase, INR: international normalized ratio, HDL: high density lipoprotein, LDL: low density lipoprotein, MRI 2D PDFF: magnetic resonance imaging 2-dimensional proton density-fat fraction, NAFLD:
non-alcoholic fatty liver disease, APRI: AST to platelet ratio index, AAR: AST/ALT ratio, FIB-4: fibrosis-4.
Armonk, NY, USA). The study was approved by the institutional review board of our institution, and it was conducted in compliance with the Declaration of Helsinki.
RESULTS
Characteristics of pediatric NAFLD patients According to the patients’ BMIs, all included pa- tients were labeled as more than overweight. The laboratory test results and patient characteristics of the 64 NAFLD patients are presented in Table 1. In the table, the patients were divided into two groups, obese and overweight, according to their BMI. All the variables were described with the median and range in parentheses. Other variables shows no sig- nificant differences except the median value of MRI 2D PDFF between the two groups (p=0.0194). APRI and FIB showed significantly high values in the obese group (p=0.0463 and p=0.001, respectively).
1. Differences between obese and overweight group There were 48 patients in the obese group and 16
in the overweight group. As shown in Table 2, the values of ALT, total bilirubin, ferritin, and MRI 2D PDFF were significantly higher in the obese group than the overweight group (p<0.05). The values of the NAFLD severity markers, APRI and FIB-4, were 0.61±0.42 and 0.30±0.16, respectively, in the obese group, which are both significantly higher than the corresponding values for the overweight group.
2. Correlation between laboratory values and serum ferritin
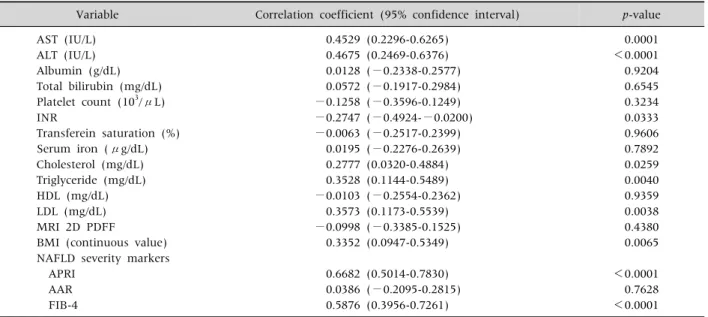
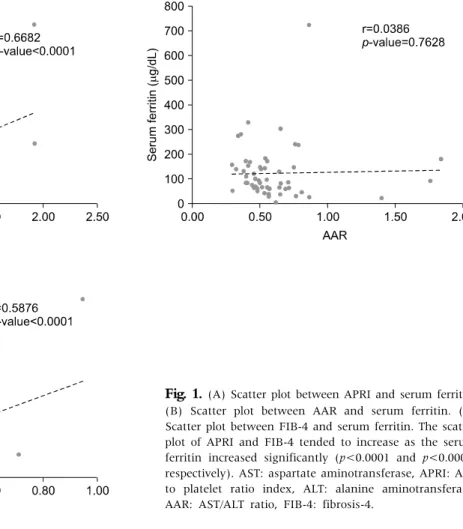
As shown in Table 3, AST, ALT, international nor- malized ratio, cholesterol, triglyceride and low den- sity lipoprotein showed significant correlations with serum ferritin. The correlation coefficients of the NAFLD severity markers, APRI and FIB-4, were 0.6682 (0.5014-0.7830) and 0.5876 (0.3956-0.7261) respectively, which were statistically significant. AAR did not show any significant correlation with serum ferritin. Likewise, the scatter plot of APRI and FIB-4 tended to increase as the serum ferritin increased sig- nificantly (p<0.0001 and p<0.0001, respectively) (Fig. 1). In addition, there was a significant correla-
Table 3.Correlation between Laboratory Values and Serum Ferritin
Variable Correlation coefficient (95% confidence interval) p-value
AST (IU/L) ALT (IU/L) Albumin (g/dL) Total bilirubin (mg/dL) Platelet count (103/μL) INR
Transferein saturation (%) Serum iron (μg/dL) Cholesterol (mg/dL) Triglyceride (mg/dL) HDL (mg/dL) LDL (mg/dL) MRI 2D PDFF
BMI (continuous value) NAFLD severity markers APRI
AAR FIB-4
0.4529 (0.2296-0.6265) 0.4675 (0.2469-0.6376) 0.0128 (−0.2338-0.2577)
0.0572 (−0.1917-0.2984)
−0.1258 (−0.3596-0.1249)
−0.2747 (−0.4924-−0.0200)
−0.0063 (−0.2517-0.2399) 0.0195 (−0.2276-0.2639) 0.2777 (0.0320-0.4884) 0.3528 (0.1144-0.5489)
−0.0103 (−0.2554-0.2362) 0.3573 (0.1173-0.5539)
−0.0998 (−0.3385-0.1525) 0.3352 (0.0947-0.5349)
0.6682 (0.5014-0.7830) 0.0386 (−0.2095-0.2815) 0.5876 (0.3956-0.7261)
0.0001
<0.0001 0.9204 0.6545 0.3234 0.0333 0.9606 0.7892 0.0259 0.0040 0.9359 0.0038 0.4380 0.0065
<0.0001 0.7628
<0.0001 AST: aspartate aminotransferase, ALT: alanine aminotransferase, INR: international normalized ratio, HDL: high density lipoprotein, LDL: low density lipoprotein, MRI 2D PDFF: magnetic resonance imaging 2-dimensional proton density-fat fraction, NAFLD:
non-alcoholic fatty liver disease, BMI: body mass index, NAFLD: non-alcoholic fatty liver disease, APRI: AST to platelet ratio index, AAR: AST/ALT ratio, FIB-4: fibrosis-4.
tion between BMI and serum ferritin (Table 3).
DISCUSSION
Recently, NAFLD has become a very important disease in the pediatric population. As liver biopsies are invasive, reliable and noninvasive biomarkers are essential for examining pediatric NAFLD. In this study, we examined whether serum ferritin could be an effective and less-invasive biological marker that could be applied to pediatric patients to predict their disease severity.
The three-hit hypothesis is the widely known NAFLD pathogenesis that a progression to NASH and fibrosis depends on additional factors such as free fatty acids, inflammatory cytokines and adipo- kines, oxidative stress, and mitochondrial dysfunc- tion in the base of obesity and insulin resistance [1].
Serum ferritin is the primary tissue for iron-storage protein in the liver, where most extra body iron is stored. Ferritin levels can be elevated secondary to obesity, chronic alcohol consumption, chronic in- flammation including viral hepatitis, histiocytic neo-
plasm, and steatohepatitis [10]. Hyperferritinemia has been previously observed in obesity-related chronic inflammatory conditions such as DM, meta- bolic syndrome, liver cirrhosis, and NAFLD [10]. As the ferritin concentration increases, the risk of sig- nificant liver disease also increases. In NAFLD, in- creased ferritin levels are considered an expression of metabolic syndrome and of hepatic damage, be- cause of inflammatory cytokine activation [12]. In addition, considering the pathophysiology from a different standpoint, the histological evidence of hepatic iron accumulation has been reported to be strongly associated with a hepatic fibrosis in NAFLD patients in large multicenter studies [14]. Hepatic iron accumulation produces inflammatory cyto- kines, and they induce hepatic fibrosis [8]. Acco- rding to another adult study by Kowdley et al. [10], the histological features of NAFLD, which include steatosis, hepatocellular ballooning, and fibrosis, were more severe in patients with increased serum ferritin. They concluded that serum ferritin is asso- ciated with hepatic iron deposition and worsened histological activity in patients with NAFLD. However,
Fig. 1. (A) Scatter plot between APRI and serum ferritin.
(B) Scatter plot between AAR and serum ferritin. (C) Scatter plot between FIB-4 and serum ferritin. The scatter plot of APRI and FIB-4 tended to increase as the serum ferritin increased significantly (p<0.0001 and p<0.0001, respectively). AST: aspartate aminotransferase, APRI: AST to platelet ratio index, ALT: alanine aminotransferase, AAR: AST/ALT ratio, FIB-4: fibrosis-4.
they also said that hyperferritinemia was associated with the histologic findings of NAFLD patients whose histological findings did not include detect- able iron deposition.
In this study, the MRI 2D PDFF values and liv- er-related laboratory marker values, including se- rum ferritin, were higher in the obese group than the overweight group, which is concordant with the pre- vious results of adult studies that indicated that NAFLD and NASH are positively correlated with obe- sity [2,8,15,16]. NAFLD can be divided into five grades according to the results of liver biopsy, from grade-0 to grade-4. Grade-4 indicates liver cirrhosis.
According to Permutt et al. [7], the mean MRI 2D PDFF value increased significantly with histol- ogy-determined steatosis grade: <5.0% at grade-0, 5.0-8.9% at grade-1, 8.9-16.3% at grade-2, and
16.3-25.0% at grade-3; with p≤0.0001. However, no significant correlation in the MRI 2D PDFF values at grade-4 was found. They thought that this is because the results of the MRI 2D PDFF were well correlated with low-grade hepatic steatosis, but steatosis was not linearly correlated with NAFLD progression.
Hepatic steatosis may be replaced by collagen in se- vere NAFLD or cirrhosis. As a result, in severe NAFLD or cirrhosis, low hepatic steatosis could be found, and there might be no differences between MRI 2D PDFF in cirrhosis and MRI 2D PDFF in grade-1 steatosis. Therefore, in patients with NAFLD, a low amount of hepatic steatosis on imaging may not indicate mild NAFLD, so other parameters should be considered to distinguish low-grade stea- tosis from liver cirrhosis [7]. In this study, we tried to separate the whole population into five grades
(grade 0-4). However, our population was divided into two of grade-0, two of grade-1, 11 of grade-2, and 51 of grade-3, so there were some limitations to our ability to show the relationship between MRI 2D PDFF and serum ferritin, because of the largely de- viated populations of the groups. The reason that the correlation between serum ferritin and MRI 2D PDFF was not good could be explained as the severity of our patients was higher (the median of the MRI 2D PDFF is 36, the average is 33.68).
Although liver biopsy remains the gold standard for the diagnosis and staging of NASH, we could not perform liver biopsies on all patients. Therefore, we applied NAFLD severity markers. Using APRI scores, McPherson et al. [17] demonstrated an area under the receiver operating characteristic curve (AUROC) of 0.67 for advanced fibrosis in a study of 145 adult NAFLD subjects. The AUROC values for AAR and FIB-4 were found to be 0.742 and 0.802, respectively, for advanced fibrosis in another study of 541 NAFLD patients [18]. In our study, the correlation co- efficients of APRI and FIB-4 showed 0.6682 (0.5014- 0.7830) and 0.5876 (0.3956-0.7261), respectively.
They both showed good statistical correlation with serum ferritin (p<0.0001). These facts suggest the clinical usefulness of serum ferritin in pediatric NAFLD patients. We think that these NAFLD mark- ers can make up for some of the limitations of our study. By using BMI as a continuous value, we found a good correlation with serum ferritin. These results show that serum ferritin is correlated with obesity and hepatocyte inflammation.
The pathophysiology of NAFLD is closely corre- lated with metabolic syndrome. Obese patients with Type 2 DM and NAFLD have been reported to have an 80% morbidity rate [19]. Ultrasound examina- tions are widely implemented as an initial non-in- vasive diagnostic imaging tool, and some reports in- dicate that ultrasonography results correlate with liver biopsy and liver-related blood test results [20].
However, it is an inadequate screening tool, because of the large deviation of results according to exam- iners and the risk of failure in diagnosing early fatty liver [11,16,19]. An MRI can provide a significantly
higher sensitivity and specificity of diagnosis of NAFLD: 98% and 99%, respectively. However, pa- tient compliance is low due to its high cost [5]. This is why serum ferritin arouses interest in many adult studies as an independent predictor of liver fibrosis.
According to a study by Manousou et al. [12], serum ferritin has relatively high accuracy: 78-85% sensi- tivity and 60-67% specificity. Although serum ferri- tin alone is insufficient for diagnosing NAFLD, it could be used to rule out NAFLD in those with under- lying obesity or DM and high serum AST and ALT levels. In addition, serum ferritin could be used as a marker for NAFLD patients to determine the appro- priate time to undergo a liver biopsy for the screening of NASH or cirrhosis [12,21].
In recent studies, Plasma caspase-generated cyto- keratin-18 fragments (CK-18) as a biological in- dicator other than serum ferritin were introduced, which is indicative of the index of the apoptosis of hepatocytes in NASH. It seems to show a high specif- icity for the diagnosis of NASH in several studies [22]. CK-18 is a major intermediate filament protein in the liver. Because of obesity-related liver damage, injured hepatocytes precede to apoptosis. Then, CK-18 fragments are released from hepatocytes and can be detected in serum [23,24]. However, accord- ing to a recent study of the multicenter, Cusi et al.
[19], Plasma CK-18 was raised significantly with any increase in steatosis, inflammation, and fibrosis, but because of low sensitivity, there was significant vagueness in the prediction of disease severity.
Therefore, more research is warranted for larger pop- ulations, to develop simple and non-invasive bio- logical markers that can provide an alternative for the histologic results of liver biopsy.
In this study, we applied serum ferritin to pediatric NAFLD patients based on previous adult studies. The results of the comparison of various liver-related tests, MRI findings, and NAFLD severity markers showed that serum ferritin was related with the se- verity of NAFLD. However, due to the limitations of the pediatric population, we could not compare the liver biopsy tissue of each patient with their serum ferritin level. If we could obtain the liver biopsy re-
sults of the patients divide the patients into several grades according to their results, we could describe the diagnostic value of the serum ferritin in NAFLD patients more precisely; that is the limitation of this study. In summary, serum ferritin, as a biological in- dicator, could have a close correlation with the se- verity of NAFLD in children. However, when using serum ferritin as a noninvasive marker, other factors that can affect serum ferritin levels should be co- ntrolled.
REFERENCES
1. Dowman JK, Tomlinson JW, Newsome PN. Pathogenesis of non-alcoholic fatty liver disease. QJM 2010;103:71-83.
2. Siegel AB, Zhu AX. Metabolic syndrome and hep- atocellular carcinoma: two growing epidemics with a potential link. Cancer 2009;115:5651-61.
3. Fon Tacer K, Rozman D. Nonalcoholic fatty liver dis- ease: focus on lipoprotein and lipid deregulation. J Lipids 2011;2011:783976.
4. Utzschneider KM, Largajolli A, Bertoldo A, Marcovina S, Nelson JE, Yeh MM, et al. Serum ferritin is asso- ciated with non-alcoholic fatty liver disease and de- creased Β-cell function in non-diabetic men and women. J Diabetes Complications 2014;28:177-84.
5. Dowman JK, Tomlinson JW, Newsome PN. Systematic review: the diagnosis and staging of non-alcoholic fatty liver disease and non-alcoholic steatohepatitis. Ali- ment Pharmacol Ther 2011;33:525-40.
6. Lam B, Younossi ZM. Treatment options for non- alcoholic fatty liver disease. Therap Adv Gastroenterol 2010;3:121-37.
7. Permutt Z, Le TA, Peterson MR, Seki E, Brenner DA, Sirlin C, et al. Correlation between liver histology and novel magnetic resonance imaging in adult patients with non-alcoholic fatty liver disease - MRI accurately quantifies hepatic steatosis in NAFLD. Aliment Pharmacol Ther 2012;36:22-9.
8. Valenti L, Dongiovanni P, Fargion S. Diagnostic and therapeutic implications of the association between fer- ritin level and severity of nonalcoholic fatty liver disease. World J Gastroenterol 2012;18:3782-6.
9. Angulo P, Hui JM, Marchesini G, Bugianesi E, George J, Farrell GC, et al. The NAFLD fibrosis score: a non- invasive system that identifies liver fibrosis in patients with NAFLD. Hepatology 2007;45:846-54.
10. Kowdley KV, Belt P, Wilson LA, Yeh MM, Neuschwander-Tetri BA, Chalasani N, et al; NASH
Clinical Research Network. Serum ferritin is an in- dependent predictor of histologic severity and ad- vanced fibrosis in patients with nonalcoholic fatty liver disease. Hepatology 2012;55:77-85.
11. Castera L, Vilgrain V, Angulo P. Noninvasive evalua- tion of NAFLD. Nat Rev Gastroenterol Hepatol 2013;10:666-75.
12. Manousou P, Kalambokis G, Grillo F, Watkins J, Xirouchakis E, Pleguezuelo M, et al. Serum ferritin is a discriminant marker for both fibrosis and in- flammation in histologically proven non-alcoholic fatty liver disease patients. Liver Int 2011;31:730-9.
13. Vallet-Pichard A, Mallet V, Nalpas B, Verkarre V, Nalpas A, Dhalluin-Venier V, et al. FIB-4: an inex- pensive and accurate marker of fibrosis in HCV infection. comparison with liver biopsy and fibrotest.
Hepatology 2007;46:32-6.
14. Nelson JE, Wilson L, Brunt EM, Yeh MM, Kleiner DE, Unalp-Arida A, et al; Nonalcoholic Steatohepatitis Clinical Research Network. Relationship between the pattern of hepatic iron deposition and histological se- verity in nonalcoholic fatty liver disease. Hepatology 2011;53:448-57.
15. Giorgio V, Prono F, Graziano F, Nobili V. Pediatric non alcoholic fatty liver disease: old and new concepts on de- velopment, progression, metabolic insight and poten- tial treatment targets. BMC Pediatr 2013;13:40.
16. Hashimoto E, Taniai M, Tokushige K. Characteristics and diagnosis of NAFLD/NASH. J Gastroenterol Hepatol 2013;28(Suppl 4):64-70.
17. McPherson S, Stewart SF, Henderson E, Burt AD, Day CP. Simple non-invasive fibrosis scoring systems can reliably exclude advanced fibrosis in patients with non-alcoholic fatty liver disease. Gut 2010;59:1265-9.
18. Shah AG, Lydecker A, Murray K, Tetri BN, Contos MJ, Sanyal AJ; Nash Clinical Research Network. Compar- ison of noninvasive markers of fibrosis in patients with nonalcoholic fatty liver disease. Clin Gastroenterol Hepatol 2009;7:1104-12.
19. Cusi K, Chang Z, Harrison S, Lomonaco R, Bril F, Orsak B, et al. Limited value of plasma cytokeratin-18 as a bio- marker for NASH and fibrosis in patients with non-al- coholic fatty liver disease. J Hepatol 2014;60:167-74.
20. Ballestri S, Lonardo A, Romagnoli D, Carulli L, Losi L, Day CP, et al. Ultrasonographic fatty liver indicator, a novel score which rules out NASH and is correlated with metabolic parameters in NAFLD. Liver Int 2012;32:
1242-52.
21. Kim YS, Jung ES, Hur W, Bae SH, Choi JY, Song MJ, et al. Noninvasive predictors of nonalcoholic steatohe- patitis in Korean patients with histologically proven
nonalcoholic fatty liver disease. Clin Mol Hepatol 2013;19:120-30.
22. Feldstein AE, Wieckowska A, Lopez AR, Liu YC, Zein NN, McCullough AJ. Cytokeratin-18 fragment levels as noninvasive biomarkers for nonalcoholic steatohepati- tis: a multicenter validation study. Hepatology 2009;
50:1072-8.
23. Fitzpatrick E, Mitry RR, Quaglia A, Hussain MJ,
DeBruyne R, Dhawan A. Serum levels of CK18 M30 and leptin are useful predictors of steatohepatitis and fib- rosis in paediatric NAFLD. J Pediatr Gastroenterol Nutr 2010;51:500-6.
24. Feldstein AE, Alkhouri N, De Vito R, Alisi A, Lopez R, Nobili V. Serum cytokeratin-18 fragment levels are useful biomarkers for nonalcoholic steatohepatitis in children. Am J Gastroenterol 2013;108:1526-31.