ABSTRACT
Purpose: Due to the increasing prevalence of obesity worldwide, non-alcoholic fatty liver disease (NAFLD) has reached epidemic dimensions over time. NAFLD is the most common cause of childhood chronic liver disease. There is a relationship between NAFLD and oxidative stress. This study aims to investigate the changes in thiol/disulfide homeostasis parameters to determine the oxidant/antioxidant balance in obese rats with diet-induced NAFLD and healthy rats.
Methods: Twelve Wistar albino rats were used in this study. Experimentally produced NAFLD obese rats (n=6) and healthy rats were compared. Experimental NAFLD model was created with a special fatty liver diet (Altromin® C1063, Fatty Liver Diet, Exclusivet, Lage, Germany).
The biochemical and histopathological features of the groups, as well as serum thiol/disulfide homeostasis parameters, were analyzed and compared.
Results: In the experimentally induced NAFLD rat model, they gained more weight than the control group. Steatosis (at least grade 2) occurred in all rats fed with special fatty liver diet for 12 weeks. Histopathologically, no high-grade inflammation was observed in rats with experimental NAFLD after feeding a diet for 12 weeks. Results revealed that aspartate transaminase and alanine transaminase levels were high, albumin levels were low, oxidant stress parameters increased, and antioxidant thiol groups decreased.
Conclusion: Experimental NAFLD is characterized by increased oxidant stress accompanying fatty tissue in the liver. Analysis of thiol/disulfide homeostasis parameters in NAFLD can be used in further studies to develop effective treatment options.
Keywords: Fatty liver; Obesity; Oxidative stress; Sulfhydryl compounds; Disulfides; Rats
INTRODUCTION
With the increasing prevalence of childhood obesity, non-alcoholic fatty liver disease (NAFLD) has become the most common liver disease in children and adolescents in industrialized countries [1-4]. The term ‘NAFLD’ describes the spectrum of liver pathology ranging from
Original Article
Received: Dec 1, 2020 Revised: Apr 16, 2021 Accepted: Jun 3, 2021 Correspondence to Serkan Tursun
Department of Pediatrics, Faculty of Medicine, Kırıkkale University, Kirikkale 71450, Turkey.
E-mail: [email protected]
Copyright © 2021 by The Korean Society of Pediatric Gastroenterology, Hepatology and Nutrition
This is an open-access article distributed under the terms of the Creative Commons Attribution Non-Commercial License (https://
creativecommons.org/licenses/by-nc/4.0/) which permits unrestricted non-commercial use, distribution, and reproduction in any medium, provided the original work is properly cited.
ORCID iDs Serkan Tursun
https://orcid.org/0000-0003-3354-6360 Hacer Fulya Gülerman
https://orcid.org/0000-0002-2887-8611 Serkal Gazyağcı
https://orcid.org/0000-0002-0043-6942 Yaşar Şahin
https://orcid.org/0000-0001-5936-4210 Özcan Erel
https://orcid.org/0000-0002-2996-3236 Salim Neşelioğlu
https://orcid.org/0000-0002-0974-5717
Serkan Tursun ,1 Hacer Fulya Gülerman ,2 Serkal Gazyağcı ,3 Yaşar Şahin ,4 Özcan Erel ,5 and Salim Neşelioğlu 5
1Department of Pediatrics, Faculty of Medicine, Kırıkkale University, Kırıkkale, Turkey
2Department of Pediatric Gastroenterology, Faculty of Medicine, Kırıkkale University, Kırıkkale, Turkey
3Department of Internal Medicine, Faculty of Veterinary Medicine, Kırıkkale University, Kırıkkale, Turkey
4 Department of Pharmacology and Toxicology, Faculty of Veterinary Medicine, Kırıkkale University, Kırıkkale, Turkey
5Department of Biochemistry, Faculty of Medicine, Yıldırım Beyazıt University, Ankara, Turkey
Investigation of Thiol/Disulfide Balance in Obese Rats with
Non-Alcoholic Fatty Liver Disease
Funding
This study was carried out with the support of Kırıkkale University scientific research projects coordination unit (Project number: 2018/072).
Conflict of Interest
The authors have no financial conflicts of interest.
mild steatosis to non-alcoholic steatohepatitis (NASH) and even cirrhosis. The main factor in pathophysiology is the inflammatory response that may occur following insulin resistance and oxidative stress, which causes fat accumulation in hepatocytes. However, there is not enough research to clearly define the role of oxidative stress [3-6], which has remained under-researched.
The prevalence of NAFLD ranges from 7.6% in the general population to 34.2% in obese children. There is increasing evidence that associates the presence of NAFLD in children with cardiovascular and metabolic consequences, such as prediabetes, type 2 diabetes, dyslipidemia, and hypertension [4]. There are studies on the significant role of increased oxidative stress in the pathogenesis of NAFLD and its close relationship with obesity and accompanying morbidity [7-11].
Oxidative stress can be defined as the excessive increase in oxidized protein end-products that may occur as a result of various reactions in the body. Thiols are known to be the most important and necessary antioxidant buffers that interact with almost all physiological oxidants [12-14]. The glutathione-containing thiol maintains the redox state of the sulfhydryl groups of proteins required for DNA repair and expression [12,13,15].
Thiol groups of proteins, thiol groups of low molecular weight compounds, cysteine residues, and other thiol groups are oxidized by the oxidant molecules in the environment and
transformed into reversible disulfide bond structures (–S–S). The disulfide bond structures can be reduced to thiol groups. Thus, the vital thiol/disulfide homeostasis is maintained. In this equilibrium, thiol groups may show antioxidant responses, while disulfide bond structures may show oxidative stress [12,13]. Until recently, only one side (thiol) of the thiol/disulfide balance could be measured, while today both sides of the equilibrium can be determined using the latest test methods and the thiol/disulfide balance can be completely evaluated [13].
Due to the role of oxidative stress in NAFLD-NASH, if the pathophysiological mechanisms can be understood completely; this may contribute to the development of non-invasive diagnosis and treatment options. Novel studies on this subject are increasing [16-18]. The present study aimed to measure the changes in thiol/disulfide balance in obese rats with diet- induced NAFLD to evaluate their relationship with histopathological and basic biochemical changes and examine the role of oxidative stress in the pathogenesis of NAFLD.
MATERIALS AND METHODS
This study was performed by Scientific and Technological Research Application, Research Center Hüseyin Aytemiz Experimental Research-Application Laboratory at Kırıkkale University, with the approval of Kırıkkale University Animal Experiments Ethics Committee (on 22.03.2018; meeting number: 18/04 decision no: 25).
Subjects
In this study, 12 male Wistar albino rats, which are 2–3 months old and weighing 250–300 g, were used. The rats were acclimatized in the animal experiments laboratory of Kırıkkale University Scientific and Technological Research and Application Center. They were kept separately in standard wire cages at 25±3°C room temperature, 55±10% humidity, and 12 hours constant light and dark cycles. Their examinations and body weight follow-ups were performed periodically.
Experimental protocol
All rats were fed with food during the 4-week acclimatization and preparation period. After the acclimatization, the rats were randomized into two groups with six rats in each group:
The study group (NAFLD) (n=6) and the control group (n=6) (Fig. 1).
A high ketoacidogenic and high-fat diet (Altromin® C1063, Fatty Liver Diet [FLD], Exclusivet®, Lage, Germany) was initiated in the study group to induce experimental hepatosteatosis.
The energy content of the fatty liver diet was 4,202 kcal/kg, and the distribution of nutrients included 29% fat, 14% protein, and 57% carbohydrate. A control diet (Altromin® C1000, Control Diet, Exclusivet®) was given to the control group. The control diet's energy content was 3,506 kcal/kg, and the nutrient distribution was 13% fat, 20% protein, and carbohydrate 60.7%.
Body weights of all rats were recorded weekly using the same device. The presence of hepatosteatosis was confirmed by liver ultrasonography in all rats in the study group at 12 weeks. At the end of the 12th week, all subjects were properly sacrificed. The fasting period was set at 12 hours before the operation. The rats were placed on their back and fixed to the operating table using their four extremities. Approximately 5 mL of blood was collected through intracardiac route. Then, the rats were sacrificed.
Blood samples were taken from all rats for the analysis of thiol/disulfide homeostasis parameters, serum albumin, alanine transaminase (ALT), and aspartate transaminase (AST) levels were centrifuged at 3,500 rpm for five minutes. Separated serum samples were then transferred to Eppendorf tubes and stored at −80°C until analysis. The livers were removed and taken in 10% formaldehyde solution.
Liver ultrasonography
The abdominal areas of the rats were shaved, and liver examination was performed using a portable ultrasound system (Honda Electronics HS-2000 VET Portable; Honda Electronics, Aichi, Japan).
Wister Albino rats (n=12) 8 12 week old
&
250 300 g
Randomlyassigned
Control diet, 12 weeks
Fatty liver diet, 12 weeks
Week 12
Sacrification
Control group n=6 Body weight (mean+SD):
388.6+21.9 g
Study group n=6 Body weight (mean+SD):
394.6+19 g
Normal liver with USG in 6/6 rats Body weight (mean+SD):
579.0+16.8 g
Fatty liver with USG in 6/6 rats Body weight (mean+SD):
714.3+24.8 g Adaptation
period (4 weeks)
USG
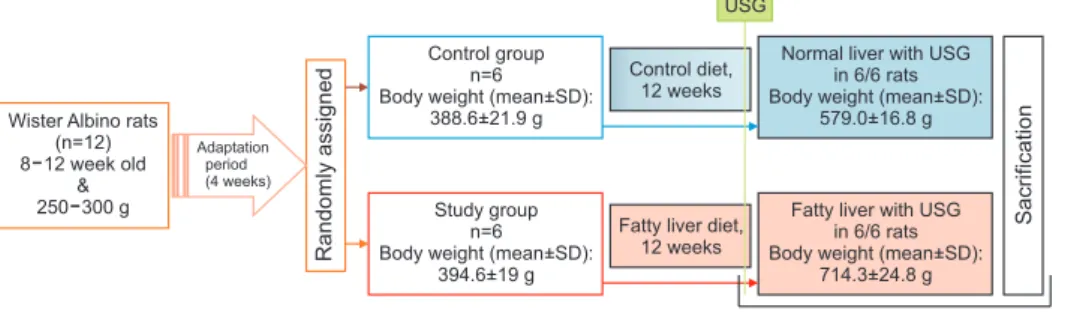
Fig. 1. The flow chart of modeling control and non-alcoholic fatty liver disease (NAFLD) rats (study design).
Twelve Wistar albino rats, which are 2-3 months old and weighing 250-300 g, were used. All rats were fed with food during the 4-week acclimatization and preparation period. After the acclimatization, the rats were randomized into two groups with six rats in each group: The study group (NAFLD) (n=6) and the control group (n=6). The energy content of the fatty liver diet was 4,202 kcal/kg, and the distribution of nutrients included 29%
fat, 14% protein, and 57% carbohydrate. The control diet's energy content was 3,506 kcal/kg, and the nutrient distribution was 13% fat, 20% protein, and carbohydrate 60.7%. The presence of hepatosteatosis was confirmed using liver ultrasonography in all rats in the study group at 12 weeks. At the end of the 12th week, all subjects were properly sacrificed. Blood samples were taken from all rats for the analysis. The livers were removed and submerged in 10% formaldehyde solution.
SD: standard deviation, USG: ultrasonography.
Biochemical analysis
ALT and AST were evaluated at the end of the 12th week in both groups. Separated serum samples were then transferred to Eppendorf tubes and stored at –80°C until analysis. The measurements were carried out at the Kırıkkale University Faculty of Medicine Biochemistry Laboratory.
Liver histopathological examination
After sacrificing the animals, their liver tissues were removed, sectioned, and fixed in 10%
formaldehyde solution for 72 hours. Tissues were sampled and transferred to tissue tracking cassettes. They were dehydrated using a graded alcohol series, fixated using xylene, and finally embedded in paraffin with a tissue tracking device. After tissue processing, they were blocked (Leica TP 1020; Leica Biosystems, Seoul, Korea). These paraffin blocks were cut into 4–6 µm sections using a rotary microtome (Leica RM 2155). Then, the sections were stained using hematoxylin and eosin. Zeiss ICC 5 camera was utilized with the ZEN imaging software under the light microscope (Zeiss Axiolab.A1; Zeiss, Jena, Germany), and the images were taken microscopically using a digital camera.
Microscopic examinations were performed by an experienced pathologist who was blinded to the study information. During the microscopic examination, 10 random areas of a 200× light microscope were evaluated in each section. An average of 10 fields was taken for the degree of inflammation and steatosis. A histological scoring system developed by NASH Clinical Research Network was used to grade inflammation and steatosis [19].
Thiol/disulfide homeostasis parameters measurement
Separated serum assays were then transferred to Eppendorf tubes and stored at –80°C until analysis. Serum thiol/disulfide homeostasis tests were measured using the automated spectrophotometric method developed by Erel and Neselioğlu [13]. Serum levels of native thiol and total thiol were measured using spectrophotometry utilizing Cobas c501 (Roche Diagnostics, Indianapolis, IN, USA). In this method, the level of native thiol was measured first when the serum had interacted with 5,5-dithiobis-(2-nitrobenzoic acid) (DTNB) without any procedure. To measure the total thiol levels, dynamic disulfide bonds in the serum samples were reduced using sodium borohydride (NaBH4) resulting to the formation of free functional thiol groups.
Formaldehyde was then used to completely remove the unused NaBH4. The total thiol groups (reduced+native) were measured after reacting with DTNB. Since the reduction of a disulfide bond forms two thiol groups, the number of dynamic disulfide bonds was calculated as half the difference between the total thiol and native thiol. After determining native thiol levels, total thiol and disulfide levels, the ratios of disulfide/native thiol, disulfide/total thiol, and native thiol/total thiol were calculated.
Statistical analysis
Statistical analysis was performed using SPSS version 21.0 package program (IBM Co., Armonk, NY, USA). Descriptive statistics number, percentage, mean, and standard deviation were summarized as median (minimum-maximum) for non-normally distributed data. The conformity of the variables to the normal distribution was examined using visual (histogram and probability charts) and analytical methods (Shapiro–Wilk test). Numerical variables determined according to the state of normal distribution were compared between the two groups using the t-test in independent groups. Numerical variables that did not show normal
distribution were compared between the two groups using the Mann–Whitney U-test. In the statistical analysis in this study, p<0.05 was considered statistically significant.
RESULTS
Body weights
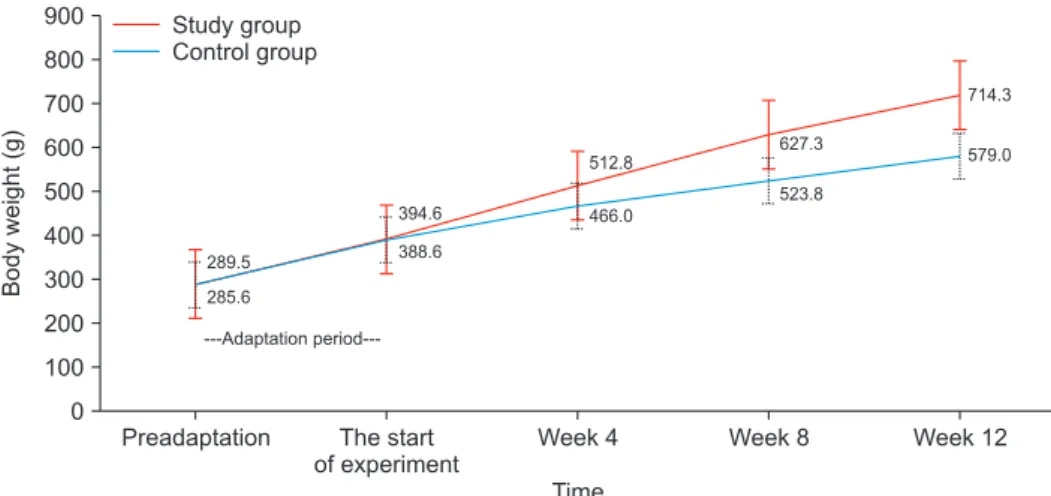
After the adaptation period, the initial median body weight was 391 g (min: 361 g, max: 422 g) in the control group and 390 g (min: 367 g, max: 419 g) in the study group. The body weight changes of both control and study groups during the experimental period are graphically shown in Fig. 2.
While the mean body weights of the rats in both groups were similar at the beginning (p=0.873), the body weights of the rats fed with FLD were significantly higher than the control group at the end of the 4th week (p=0.01), 8th week (p=0.004), and 12th week (p=0.004) (Table 1).
ALT, AST, and albumin levels
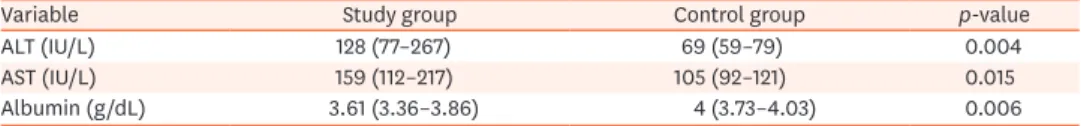
When the experiment was terminated, AST and ALT levels were higher in the study group (subjects with NAFLD) than the control group. Also, albumin levels were lower in the study group (Table 2).
Liver ultrasonography
In the study group, the presence of hepatosteatosis was observed in all rats (6/6) in the ultrasonographic liver evaluation performed after 12 weeks of FLD. Ultrasonographic grades
Preadaptation The start of experiment
Week 4 Week 8 Week 12
900 800 700 600 500 400 300 200 100
---Adaptation period---
Bodyweight(g)
Time 0
Study group Control group
289.5 285.6
394.6 388.6
512.8
466.0
627.3
523.8
714.3
579.0
Fig. 2. The body weight course of the control group and the study (non-alcoholic fatty liver disease) group during the experimental period. Weekly body weight measurements of rats are marked as mean and error bars.
Table 1. Comparison of the control and study group body weights at the beginning and at the end of the experiment
Duration of feeding Study group Control group p-value
Initial body weight (g) 390 (367–419) 391 (361–422) 0.871
4th week body weights (g) 506 (488–565) 471 (430–495) 0.010
8th week body weights (g) 614 (602–687) 529 (478–546) 0.004
12th week body weights (g) 702.5 (695–760) 578.5 (553–597) 0.004
Values are presented as median (min–max).
of steatosis in the study group were evaluated as grade 2 (in 4 rats) and grade 3 (in 2 rats). At the end of the experiment, no steatosis was observed in any rat in the control group.
Histopathological examination of the liver
At the end of the experiment, steatosis (grade 2–3) was observed in all rats (100%) in the study group. Grade 2 steatosis was found in 4/6 rats, while grade 3 was found in 2/6 rats.
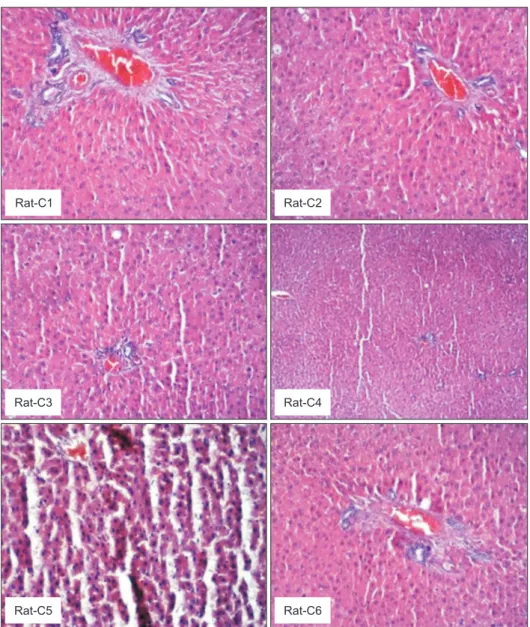
Steatosis and inflammation were not observed in any of the rats in the control group at the end of the experiment. While one of the rats in the study group had grade 2 lobular inflammations (1 inflammation area/200× area) with grade 2 steatosis (steatohepatitis), there was no lobular inflammation accompanying steatosis in the other five rats. The histopathological characteristics of the rats' livers in the study and control groups are shown in Table 3. Images of histopathological examinations are given in Fig. 3 (study-NAFLD group) and Fig. 4 (control group).
Thiol/disulfide homeostasis parameters
When parameters reflecting oxidative stress of thiol homeostasis were compared using disulfide (DS), DS/Native Thiol (Index 1), and DS/Total Thiol (Index 2), they were found significantly higher in patients with NAFLD than those in the control group. Index 3 of antioxidant parameters: Native Thiol/Total Thiol was at a significantly lower level in the patient group (Table 4).
DISCUSSION
The present study showed that rats fed with a high-fat diet gained more weight than rats fed with a control diet. All rats fed with FLD developed obesity and fatty liver. In other studies, some examples showed that a significant weight gain (obesity) occurs in rats fed with a high- Table 2. Comparison of transaminases and albumin levels of the groups at the end of the experiment
Variable Study group Control group p-value
ALT (IU/L) 128 (77–267) 69 (59–79) 0.004
AST (IU/L) 159 (112–217) 105 (92–121) 0.015
Albumin (g/dL) 3.61 (3.36–3.86) 4 (3.73–4.03) 0.006
Values are presented as median (min–max).
ALT: alanine transaminase, AST: aspartate transaminase.
Table 3. Liver histopathological features of control and study groups
Subjects Percentage of steatosis Steatosis grade Lobular inflammation score Study (NAFLD) group
Rat-S1 45 2 0
Rat-S2 75 3 0
Rat-S3 70 3 0
Rat-S4 45 2 1
Rat-S5 35 2 0
Rat-S6 55 2 0
Control group
Rat-C1 0 0 0
Rat-C2 0 0 0
Rat-C3 0 0 0
Rat-C4 0 0 0
Rat-C5 0 0 0
Rat-C6 0 0 0
NAFLD: non-alcoholic fatty liver disease, S: study group, C: control group.
fat diet after four to eight weeks [20,21]. Similarly, the body weights of the rats fed with a high-fat diet were significantly higher on the 4th week than the control group.
Rat-S1 Rat-S2
Rat-S3
Rat-S3 Rat-S4
Rat-S5 Rat-S6
Fig. 3. Liver histopathological examination images of the rats in the study group. Grade 2 steatosis was seen in Rat-S1 (×20, H&E), Rat-S4 (×20, H&E), Rat-S5 (×20, H&E), and Rat-S6 (×20, H&E), while grade 3 steatosis was seen in Rat-S2 (×4, H&E) and Rat-S3 (×20, H&E) (red arrows). In addition, minimal lobular inflammation was observed in Rat-S4 (black arrow).
H&E: hematoxylin and eosin.
Table 4. Comparison of thiol disulfide homeostasis parameters of groups
Parameter Study group (NAFLD) Control group p-value
Antioxidant
Native thiol 243.2 (194.9–288) 266.6 (251.1–297) 0.310
Total thiol 292.25 (227.3–342) 305.75 (287.4–319.6) 0.631
Index 3: Native thiol/Total thiol 84.37 (79.81–86.28) 88.54 (84.09–92.93) 0.025 Oxidane stress
Disulfide 26.53 (16.20–28.25) 17.08 (11.30–24.95) 0.025
Index 1: Disulfide/Native thiol 9.26 (7.95–12.65) 6.48 (3.81–9.46) 0.025 Index 2: Disulfide/Total thiol 7.82 (6.86–10.10) 5.73 (3.54–7.95) 0.025 Values are presented as median (min–max).
NAFLD: non-alcoholic fatty liver disease.
In our study, a more pronounced increase in body weight was observed after the 8th week following the diet initiation. On the other hand, the increase in body weight was observed in the high-fat diet group than the control group after the 16th week in Xu et al.'s [21] study.
It is assumed that this difference may be due to the use of younger subjects with initial weights of 140–160 g in the study mentioned. Moreover, it is possible that younger rats in the rapid growth phase show a similar weight gain trend. High-fat diet periods varying between 4–16 weeks for the development of diet-induced obesity encountered in the literature suggested that the subjects selected in different studies may exhibit different weight gain rates in different growth-development periods due to their different initial ages and weights.
Additionally, these facts may be related to the genetics of the rats [20-22].
Rat-C1 Rat-C2
Rat-C3 Rat-C4
Rat-C5 Rat-C6
Fig. 4. Liver histopathological examination images of the rats in the control group. Regular liver tissue was observed in the histopathological appearance of the control group. Steatosis and inflammation were not observed (Rat-C1 [×20, H&E], Rat-C2 [×20, H&E], Rat-C3 [×20, H&E], Rat-C4 [×4, H&E], Rat-C5 [×20, H&E], Rat-C6 [×20, H&E]).
H&E: hematoxylin and eosin.
Based on the laboratory reports presenting the reference range of biochemical parameters in rats, it was reported that the normal ranges may vary depending on many factors, such as the type, sex, and age of the rats. However, in male rats 8-16 weeks of age, these levels were reported as AST 105 (74–143) U/L, ALT 28 (18–45) U/L, and albumin 4 (3.4–4.8) g/dL [23]. It is a disadvantage for all studies that normal ranges cannot be determined precisely.
However, to overcome this disadvantage, we have compared these values with a control group of healthy rats of the same breed and age, which were followed in the same environment. In our study, albumin levels were lower at the end of 12 weeks, while AST and ALT levels were higher in subjects with NAFLD than the control group. Similarly, Xu et al. [21] compared the biochemical and histopathological characteristics of rats given with a high-fat diet and standard control diet, and it was found that serum ALT levels increased in rats given with a high-fat diet over the 12th week. They showed that it peaked at the 16th week. Karaçor et al.
[22] investigated the effects of high-fat and high-carbohydrate diets on rat liver and its role in weight gain for 16 and 20 weeks. When they compared four different rat groups, they found that ALT levels were significantly higher in the 20-week high-carbohydrate group. In the same study, it was observed that there was no significant difference between the albumin levels of the groups fed with high carbohydrate and high fat diets. In our study, higher AST and ALT levels were found in subjects with NAFLD at the end of 12 weeks than the control group.
Dimitrova-Shumkovska et al. [24] found that serum albumin levels as well as total protein, urea, and creatinine levels were significantly decreased at the end of 18 weeks in rats fed with a diet with high-fat and high-cholesterol content. In our study, it was evaluated in accordance with that serum albumin levels were lower in rats fed with high-fat diet than the control group. This result was interpreted to be related to impaired protein synthesis in the liver as a result of a high-fat diet [25].
Karaçor et al. [22] reported that although there were signs of fibrosis, inflammation, and steatosis in the portal area on histological examination in all groups, no statistically significant difference was detected. In our study, less frequent and milder inflammation was attributed to the shorter diet duration. Supporting this interpretation, Xu et al. [21] reported that in rats given with high-fat diet at different periods, steatosis started at the 4th week, the steatosis degree progressed after the 8th week, and mild inflammation was observed in the 12th week. In the same study, there was no hepatic perisinusoidal fibrosis up to 24 weeks in subjects fed with a high-fat diet. They showed that the inflammation score was significantly higher at the 12th week than at the 4th, 8th, and 16th weeks. Similarly, in our study, all rats which received a high-fat diet for 12 weeks had a minimum grade 2 steatosis, while only one of six rats had grade-1 inflammatory steatosis. In Xu et al.'s [21] research, the reason for the earlier onset of lobular inflammation may be the energy content of the diet they used (4,800 kcal/kg), which was higher than the energy content of our diet (4,202 kcal/kg). In addition, Sprague-Dawley rats were used in the study mentioned [21], while Wistar rats were used in our study. Physiological differences between Sprague-Dawley rats and Wistar rats might affect the time it takes for the development of fat and inflammation in the liver [26].
It is shown with all these studies that mild steatosis can develop after being fed with a high- fat diet for 6–8 weeks, and a steatohepatitis model accompanied by inflammatory changes can develop after being fed with a high-fat diet for more than 8–12 weeks.
In our study, the findings showed that thiol/disulfide homeostasis parameters (DS, DS/
Native-Thiol, DS/Total-Thiol) reflecting oxidative stress were significantly higher in obese rats developing NAFLD after feeding with a high-fat diet for 12 weeks. Native Thiol/Total
Thiol ratio, which was one of the antioxidant parameters, was significantly lower in the study group than the control group. These results showed that oxidative stress increased in obese rats with grade 2 and 3 hepatosteatosis, and no inflammation was observed except in one rat with mild lobular inflammation. Increased oxidative stress parameters without significant inflammation in these obese rats with fatty liver may be due to increased fat accumulation, which is as a substrate for lipid peroxidation and formation of free oxygen species in the liver and adipose tissues [15,27,28].
Marushchak et al. [8] analyzed glutathione reductase activity, glutathione peroxidase activity, reduced glutathione (GSH), and oxidized glutathione (GSSG) levels in erythrocytes, adipose, and liver tissues using different methods and showed an imbalance in favor of GSSG associated with increased GSH consumption in obese rats. The authors attributed this result to the increase in GSH consumption during the neutralization of free radicals caused by the activation of lipid peroxidation. This study demonstrates the inability of obese rats to maintain thiol-disulfide balance, and this seems compatible with our results about increased oxidative stress. Glutathione is known to maintain the redox state of the sulfhydryl groups of proteins required for DNA repair and expression and inhibition of the replication of mature hepatocytes in the presence of oxidative stress [12,13,15,29]. Our findings showed that even in mild hepatosteatosis without significant inflammation and no fibrosis, thiol-disulfide balance is disrupted in favor of increased oxidative stress in rats with NAFLD. Metabolic and biochemical changes or changes in oxidative stress parameters at different stages of steatosis and steatohepatitis obtained in groups with different high-fat diet content and/or duration can be compared.
Karaman et al. [30] investigated the effects of high fat diet on the thiol-disulfide metabolism of the rats. They found that the compensatory response failed in the glutathione and the impairment of redox imbalance in thiol/disulfide metabolism after 180 days alimentary. The difference with our study was that the histopathology of both liver and fatty liver were not evaluated. Also, the ratio of thiol/disulfide indexes was not calculated and discussed.
An additional result of our study is that the role of oxidative stress in the pathogenesis of NAFLD, which is a current scientific curiosity, can be investigated by choosing this new method, which is simple, cheap, fast, and non-invasive. We could not find any other study using this new method to examine thiol/disulfide homeostasis parameters in rats with diet-induced NAFLD. In our opinion, given that oxidant and antioxidant parameters can be evaluated quickly and cheaply, using this new method adds value and originality to our study.
The present study has several limitations. The sample size was small, and the rate of inflammation was low. However, there are strong sides, such as enough duration of feeding and histopathological evaluation of tissue samples.
In conclusion, this study showed that NAFLD could be induced by a high-fat diet, and thiol- disulfide homeostasis is impaired in favor of oxidative stress in obese rats with diet-induced NAFLD. This result encourages to plan and design different experimental studies in which oxidative stress parameters, such as DS, DS/Native-Thiol, and DS/Total-Thiol, can be used as markers to show the efficiency of different diagnostic or therapeutic interventions in patients with NAFLD. Analysis of thiol/disulfide homeostasis parameters in NAFLD can be used in further studies to develop effective treatment options.
ACKNOWLEDGEMENTS
All authors would like to thank İrfan Karahan for his contribution to the redaction of this article.
REFERENCES
1. Cohen JC, Horton JD, Hobbs HH. Human fatty liver disease: old questions and new insights. Science 2011;332:1519-23.
PUBMED | CROSSREF
2. Ludwig J, Viggiano TR, McGill DB, Oh BJ. Nonalcoholic steatohepatitis: Mayo Clinic experiences with a hitherto unnamed disease. Mayo Clin Proc 1980;55:434-8.
PUBMED
3. Arab JP, Arrese M, Trauner M. Recent insights into the pathogenesis of nonalcoholic fatty liver disease.
Annu Rev Pathol 2018;13:321-50.
PUBMED | CROSSREF
4. Di Sessa A, Cirillo G, Guarino S, Marzuillo P, Miraglia Del Giudice E. Pediatric non-alcoholic fatty liver disease: current perspectives on diagnosis and management. Pediatric Health Med Ther 2019;10:89-97.
PUBMED | CROSSREF
5. Chakravarthy MV, Neuschwander-Tetri BA. The metabolic basis of nonalcoholic steatohepatitis.
Endocrinol Diabetes Metab 2020;3:e00112.
PUBMED | CROSSREF
6. Asil M, Dertli R, Biyik M, Yolacan R, Erel O, Neselioglu S, et al. Dynamic thiol-disulfide homeostasis is disturbed in patients with non-alcoholic fatty liver disease. J Lab Med 2018;42:31-8.
CROSSREF
7. Tetri LH, Basaranoglu M, Brunt EM, Yerian LM, Neuschwander-Tetri BA. Severe NAFLD with hepatic necroinflammatory changes in mice fed trans fats and a high-fructose corn syrup equivalent. Am J Physiol Gastrointest Liver Physiol 2008;295:G987-95.
PUBMED | CROSSREF
8. Marushchak M, Krynytska I, Mazur L, Yastremska S, Begosh N. The thiol-disulfide homeostasis and its role in the pathogenesis of the experimental alimentary obesity. Bangladesh Med J Sci 2016;15:419-23.
CROSSREF
9. Nadal-Casellas A, Proenza AM, Gianotti M, Llad I. Brown adipose tissue redox status in response to dietary-induced obesity-associated oxidative stress in male and female rats. Stress 2011;14:174-84.
PUBMED | CROSSREF
10. Palladini G, Di Pasqua LG, Berardo C, Siciliano V, Richelmi P, Perlini S, et al. Animal models of steatosis (NAFLD) and steatohepatitis (NASH) exhibit hepatic lobe-specific gelatinases activity and oxidative stress. Can J Gastroenterol Hepatol 2019;2019:5413461.
PUBMED | CROSSREF
11. Gil-Cardoso K, Ginés I, Pinent M, Ardévol A, Terra X, Blay M. A cafeteria diet triggers intestinal inflammation and oxidative stress in obese rats. Br J Nutr 2017;117:218-29.
PUBMED | CROSSREF
12. Kaur R, Kaur J, Mahajan J, Kumar R, Arora S. Oxidative stress--implications, source and its prevention.
Environ Sci Pollut Res Int 2014;21:1599-613.
PUBMED | CROSSREF
13. Erel O, Neselioglu S. A novel and automated assay for thiol/disulphide homeostasis. Clin Biochem 2014;47:326-32.
PUBMED | CROSSREF
14. Pisoschi AM, Pop A. The role of antioxidants in the chemistry of oxidative stress: a review. Eur J Med Chem 2015;97:55-74.
PUBMED | CROSSREF
15. Ucar F, Sezer S, Erdogan S, Akyol S, Armutcu F, Akyol O. The relationship between oxidative stress and nonalcoholic fatty liver disease: its effects on the development of nonalcoholic steatohepatitis. Redox Rep 2013;18:127-33.
PUBMED | CROSSREF
16. Hajighasem A, Farzanegi P, Mazaheri Z. Effects of combined therapy with resveratrol, continuous and interval exercises on apoptosis, oxidative stress, and inflammatory biomarkers in the liver of old rats with non-alcoholic fatty liver disease. Arch Physiol Biochem 2019;125:142-9.
PUBMED | CROSSREF
17. Madsen AN, Hansen G, Paulsen SJ, Lykkegaard K, Tang-Christensen M, Hansen HS, et al. Long- term characterization of the diet-induced obese and diet-resistant rat model: a polygenetic rat model mimicking the human obesity syndrome. J Endocrinol 2010;206:287-96.
PUBMED | CROSSREF
18. Celikbilek M, Doğan S. Antioxidant treatment in nonalcoholic fatty liver disease. Turk J Gastroenterol 2014;25:468.
PUBMED | CROSSREF
19. Kleiner DE, Brunt EM, Van Natta M, Behling C, Contos MJ, Cummings OW, et al. Design and validation of a histological scoring system for nonalcoholic fatty liver disease. Hepatology 2005;41:1313-21.
PUBMED | CROSSREF
20. Saravanan G, Ponmurugan P, Deepa MA, Senthilkumar B. Anti-obesity action of gingerol: effect on lipid profile, insulin, leptin, amylase and lipase in male obese rats induced by a high-fat diet. J Sci Food Agric 2014;94:2972-7.
PUBMED | CROSSREF
21. Xu ZJ, Fan JG, Ding XD, Qiao L, Wang GL. Characterization of high-fat, diet-induced, non-alcoholic steatohepatitis with fibrosis in rats. Dig Dis Sci 2010;55:931-40.
PUBMED | CROSSREF
22. Karaçor K, Çam M, Orhan N, Coşgun E, Demirin H. High fatty diet effects on rat liver. Eur J Gen Med 2014;11:99-108.
CROSSREF
23. Giknis MLA, Clifford CB. Clinical laboratory parameters for Crl:Wi(Han). Wilmington: Charles River Laboratories, 2008.
24. Dimitrova-Shumkovska J, Veenman L, Ristoski T, Leschiner S, Gavish M. Chronic high fat, high cholesterol supplementation decreases 18 kDa Translocator Protein binding capacity in association with increased oxidative stress in rat liver and aorta. Food Chem Toxicol 2010;48:910-21.
PUBMED | CROSSREF
25. Harrison P, Degen SJ, Williams R, Farzaneh F. Hepatic expression of hepatocyte-growth-factor-like/
macrophage-stimulating protein mRNA in fulminant hepatic failure. Lancet 1994;344:27-9.
PUBMED | CROSSREF
26. Cavigelli SA, Michael KC, Ragan CM. Behavioral, physiological, and health biases in laboratory rodents:
a basis for understanding mechanistic links between human personality and health. In: Carere C, Maestripieri D, eds. Animal personalities: behavior, physiology, and evolution. Chicago: University of Chicago Press, 2013:441-98.
27. Kučera O, Garnol T, Lotková H, Staňková P, Mazurová Y, Hroch M, et al. The effect of rat strain, diet composition and feeding period on the development of a nutritional model of non-alcoholic fatty liver disease in rats. Physiol Res 2011;60:317-28.
PUBMED | CROSSREF
28. Videla LA, Rodrigo R, Araya J, Poniachik J. Insulin resistance and oxidative stress interdependency in non- alcoholic fatty liver disease. Trends Mol Med 2006;12:555-8.
PUBMED | CROSSREF
29. Roskams T, Yang SQ, Koteish A, Durnez A, DeVos R, Huang X, et al. Oxidative stress and oval cell accumulation in mice and humans with alcoholic and nonalcoholic fatty liver disease. Am J Pathol 2003;163:1301-11.
PUBMED | CROSSREF
30. Karaman YK, Novgorodtseva TP, Yan'kova VI. Effects on alimentary high-fat diet on thiol disulfide homeostasis in rats. Bull Exp Biol Med 2013;155:752-6.
PUBMED | CROSSREF