Pediatric Gastroenterology, Hepatology & Nutrition 2012 March 15(1):44-51
PGHN
Original Article
Role of Tumor Necrosis Factor- α Promoter Polymorphism and Insulin Resistance in the Development of Non-alcoholic Fatty Liver Disease in Obese Children
Hye Ran Yang, M.D., Ph.D.
*,†, Jae Sung Ko, M.D., Ph.D.
†and Jeong Kee Seo, M.D., Ph.D.
†Department of Pediatrics, *Seoul National University Bundang Hospital, †Seoul National University College of Medicine, Seoul, Korea
Purpose: Tumor necrosis factor-α (TNF-α) polymorphism has been suggested to play an important role in the pathogenesis of non-alcoholic fatty liver disease (NAFLD) in obese adults, and known to be a mediator of insulin resistance. In this study, we evaluated the role of TNF-α promoter polymorphisms and insulin resistance in the development of NAFLD in obese children.
Methods: A total of 111 obese children (M:F=74:37; mean age, 11.1±2.0 yrs) were included. The children were divided into 3 groups: controls (group I, n=61), children with simple steatosis (group II, n=17), and children with non-alcoholic steatohepatitis (group III, n=33). Serum TNF-α levels, homeostasis model assessment of insulin resistance (HOMA-IR), and TNF-α -308 and -238 polymorphisms were evaluated.
Results: There were no differences in TNF-α polymorphism at the -308 or the -238 loci between group I and group II + III (p=0.134 and p=0.133). The medians of HOMA-IR were significantly different between group I and group II + III (p=0.001), with significant difference between group II and group III (p=0.007). No difference was observed in the HOMA-IR among the genotypes at the -308 locus (p=0.061) or the -238 locus (p=0.207) in obese children.
Conclusion: TNF-α promoter polymorphisms at the -308 and -238 loci were not significantly associated with the development of NAFLD in children; nevertheless, insulin resistance remains a likely essential factor in the pathogenesis of NAFLD in obese children, especially in the progression to NASH. (Pediatr Gastroenterol Hepatol Nutr 2012; 15: 44-51)
Key Words: TNF-α polymorphism, Insulin resistance, Fatty liver, Obesity, Child
Received:January 27, 2012, Revised:February 29, 2012 Accepted:March 3, 2012
Corresponding author: Jeong Kee Seo, M.D., Ph.D., Section of Pediatric Gastroenterology Hepatology and Nutrition, Seoul National University Children's Hospital, 28, Yongon-dong, Chongno-gu, Seoul 110-744, Korea. Tel: +82-2-2072-3627, Fax: +82-2-2072-3455, E-mail: [email protected]
Copyright ⓒ 2012 by The Korean Society of Pediatric Gastroenterology, Hepatology and Nutrition
This is an openaccess article distributed under the terms of the Creative Commons Attribution NonCommercial License (http://creativecommons.org/licenses/by-nc/3.0/) which permits unrestricted noncommercial use, distribution, and reproduction in any medium, provided the original work is properly cited.
INTRODUCTION
The incidence of childhood obesity has been in- creasing, and with this comes the concern that obe- sity-related complications, including non-alcoholic fatty liver disease (NAFLD), will also increase.
NAFLD is defined as a chronic liver disease charac- terized by macrovesicular steatosis with histopatho- logic findings similar to alcoholic fatty liver disease in those who do not drink alcohol [1]. It has a dis- ease spectrum ranging from simple steatosis to non-alcoholic steatohepatitis (NASH), fibrosis, and cirrhosis; NASH progressing towards cirrhosis is re- garded as a significant cause of liver-related mor- bidity, even in children [2,3].
The most common risk factor in children for the development of NAFLD is obesity [4], and the pathogenesis of NAFLD in obese patients has been explained by the 2-hit theory; the first hit is the ac- cumulation of fat in the liver (simple steatosis), and the second hit is the induction of inflammation and fibrosis in NASH. These second stimuli include oxi- dative stress and adipokines or proinflammatory cy- tokines including tumor necrosis factor-α (TNF-α) [5]. Insulin resistance and hyperinsulinemia have al- so been suggested to be strongly associated with the pathogenesis and severity of NAFLD [6,7]. NAFLD is now regarded as a hepatic manifestation of the metabolic syndrome, with insulin resistance repre- senting a common mechanism for developing both simple steatosis and NASH in cases of obesity [8].
TNF-α is overexpressed in the adipose tissue of obese patients [9], and is known to be an important mediator of insulin resistance through multiple mechanisms including modulation of the tyrosine kinase activity of the insulin receptor [10]. TNF-α is also overexpressed in the adipose tissue and liver of obese patients diagnosed with NASH [11].
Furthermore, several reports have been published in adults on the relationship between TNF-α and NAFLD in association with insulin resistance [12-14].
The TNF-α gene is located in chromosome 6p21.3 and is polymorphic at several positions including -G308A, -G238A, -T1031C, -C863A, -C851T, -G419C,
and -G376A [15]. Among these single nucleotide poly- morphisms (SNPs), -G308A and -G238A lie within the promoter, and previous studies have shown that the -308, and possibly the -238, alleles are associated with the increased production of TNF-α in various in- flammatory diseases [15,16]. Since TNF-α poly- morphism was first suggested to be associated with the pathogenesis of alcoholic liver disease [17], several studies have been published supporting the hypothesis that TNF-α polymorphism might also be associated with the pathogenesis and progression of NAFLD [16,18-21]. However, as yet, there have been no related studies in pediatric populations.
Therefore, the aim of this study was to evaluate the role of TNF-α polymorphism and insulin resistance in the development of NAFLD in obese children, and possibly, the relationship between TNF-α polymor- phism and insulin resistance in children with NAFLD.
MATERIALS AND METHODS
A total of 111 children who visited pediatric gas- troenterology outpatient clinics were included. The subjects were divided into 3 groups according to their NAFLD status: group I, controls without NAFLD; group II, obese children with simple stea- tosis; and group III, obese children with NASH.
NAFLD was diagnosed in each patient based on elevated serum aminotransferase levels, abdominal ultrasonographic or computed tomographic find- ings, and histopathologic findings on liver biopsy [22]. Simple steatosis was defined as parenchymal involvement by steatosis of more than 5% of the liver without fibrosis or inflammation, and NASH as hepatic steatosis with lobular inflammation, bal- looning of hepatocytes, and hepatic fibrosis [22].
Children with other causes of chronic liver dis- ease including viral hepatitis, metabolic disease, autoimmune hepatitis, and children with a drug history were excluded from the study. There were no children with a history of alcohol intake.
Parents or legal guardians of the subjects gave their informed consent prior to the study. This study was approved by the institutional review board.
Anthropometric data collection
Clinical data on body weight and height were re- viewed in each patient; body weight was measured to the nearest 0.1 kg and height to the nearest 0.1 cm. Body mass index (BMI) was calculated as the body weight (kg) divided by the square of the height (m2). BMI percentile was determined according to the Korean national growth charts [23]. Obesity was defined as a BMI greater than the 95th percentile for the child’s age and sex, and overweight as BMI be- tween the 85th and 95th percentiles.
Biochemical tests and laboratory investi- gation
Serum aspartate aminotransferase (AST) and alanine aminotransferase (ALT) levels were meas- ured, and levels exceeding 40 IU/L were regarded as abnormal for both tests. Serum concentrations of fasting glucose, total cholesterol, triglycerides (TGs), high-density lipoprotein (HDL) cholesterol, low-density lipoprotein (LDL) cholesterol, C-re- active protein (CRP), γ-glutamyl transpeptidase (GGT), and insulin levels were measured after 12 h of fasting at the time of the liver biopsy. Insulin resistance was determined by the homeostatic model assessment of insulin resistance [HOMA- IR, insulin (mmol/L)×glucose (μU/mL)/22.5] [24].
For the differential diagnosis based on other causes of chronic hepatitis, creatine phosphokinase, lactate dehydrogenase, ammonia, lactate, pyruvate, anti-HAV IgM antibody, HBs antigen, and anti-HBs antibody, anti-HCV antibody, EBV VCA IgM anti- body, CMV IgM antibody, serum ceruloplasmin, and anti-nuclear antibody levels were measured in all patients with elevated AST and ALT levels.
Serum TNF-α levels were measured by ELISA (human TNF-α ELISA kit; R&D Systems, Min- neapolis, USA) using an anti-human TNF-α antibody.
Radiologic evaluation of NAFLD
The presence and the severity of fatty liver were evaluated in all subjects by abdominal sonography
or abdominal computed tomography (CT). The de- gree of fatty liver on abdominal sonography was defined as mild, moderate, or severe [25]. Using non-contrast abdominal CT, the diagnosis of fatty liver was made when CTL (the CT number of the liver) was lower than CTS (the CT number of the spleen) by more than 10.
Histopathologic evaluation in NAFLD
Percutaneous needle liver biopsy was performed on all patients with elevated AST, ALT levels. The diagnosis of NAFLD was evaluated on the basis of the histopathologic grades of steatosis, inflamma- tion, ballooning, and stages of fibrosis, according to the classification by Brunt [26] and Kleiner [22].
Genotyping of TNF-α polymorphisms
At least 3 cc of blood were obtained from the patients and the controls, and DNA was extracted using the QIAamp DNA Mini Kit (Applied Biosystems, Foster City, CA, USA). Extracted DNA was frozen at −20oC before testing.
For amplification of the TNF-α G308A locus, the sense and antisense primers used were 5'-CTGAAGC CCCTCCCAGTTCT-3' and 5'-CGGTTTCTTCTCCATCG CG-3', respectively [27]. For the TNF-α G238A lo- cus, the sense and antisense primers were 5'-GGAG GCAATAGGTTTTGAGGG-3' and 5'-GGTTTCTTCTCC ATCGCGG-3', respectively [27].
For DNA template preparation, amplification of genomic DNA was performed on a PCR (polymer- ase chain reaction) thermal cycler in a final vol- ume of 50 μL. The reaction mixture contained 1.25 pmol of each primer, 250 μM dNTP, 2.5 mM MgCl2, 10× buffer, 0.15 unit Taq polymerase, and the genomic DNA. The PCR cycling conditions were denaturation at 94oC for 30 s, annealing at 65°C for 30 s, and extension at 72oC for 30 s. PCR products were purified using a PCR purification kit (Roche Molecular Biochemicals, Indianapolis, IN, USA), to give purified DNA templates.
For genotyping of TNF-α promoter polymor- phisms, a reaction mixture was prepared containing the PCR products, SNaPshot Multiplex Ready Reac-
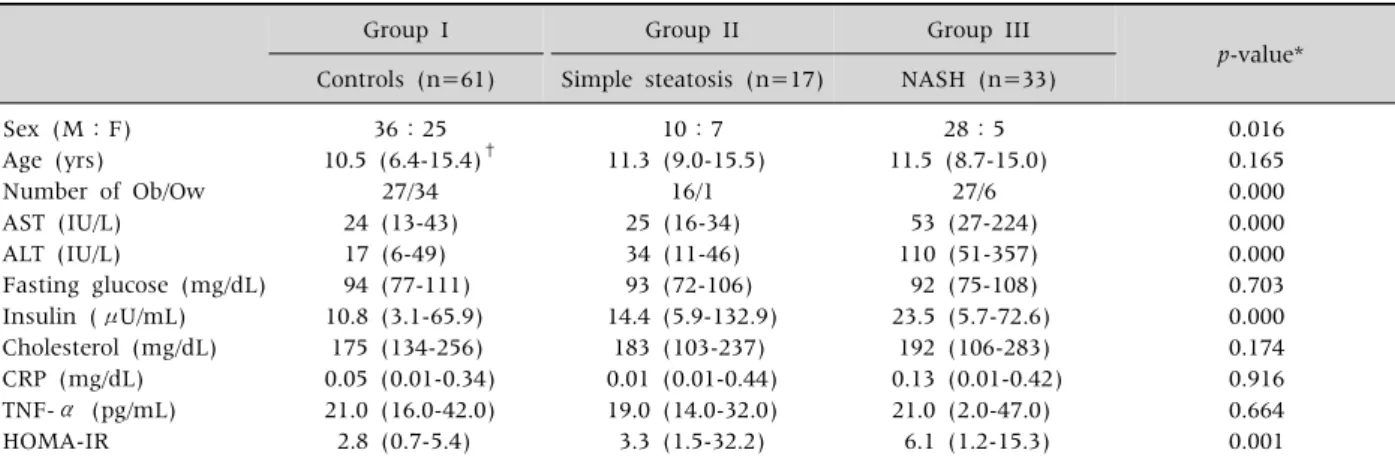
Table 1. Clinical Manifestations and Laboratory Findings Among the 3 Groups Based on the Spectrum of NAFLD
Group I Group II Group III
p-value*
Controls (n=61) Simple steatosis (n=17) NASH (n=33) Sex (M:F)
Age (yrs) Number of Ob/Ow AST (IU/L) ALT (IU/L)
Fasting glucose (mg/dL) Insulin (μU/mL) Cholesterol (mg/dL) CRP (mg/dL) TNF-α (pg/mL) HOMA-IR
36:25 10.5 (6.4-15.4)†
27/34 24 (13-43) 17 (6-49) 94 (77-111) 10.8 (3.1-65.9)
175 (134-256) 0.05 (0.01-0.34) 21.0 (16.0-42.0) 2.8 (0.7-5.4)
10:7 11.3 (9.0-15.5)
16/1 25 (16-34) 34 (11-46) 93 (72-106) 14.4 (5.9-132.9)
183 (103-237) 0.01 (0.01-0.44) 19.0 (14.0-32.0) 3.3 (1.5-32.2)
28:5 11.5 (8.7-15.0)
27/6 53 (27-224) 110 (51-357) 92 (75-108) 23.5 (5.7-72.6)
192 (106-283) 0.13 (0.01-0.42) 21.0 (2.0-47.0)
6.1 (1.2-15.3)
0.016 0.165 0.000 0.000 0.000 0.703 0.000 0.174 0.916 0.664 0.001
*p-value less than 0.05 was regarded as statistically significant. †The values are expressed as medians (ranges). Ob: obese children with BMI ≥ 95 percentile, Ow: overweight with BMI between 85 and 95 percentile, AST: aspartate aminotransferase, ALT: alanine aminotransferase, BMI: body mass index, CRP: C-reactive protein, HOMA-IR: insulin resistance determined by homeostasis model assessment, NAFLD: non-alcoholic fatty liver disease, NASH: non-alcoholic steatohepatitis, TNF-α: tumor necrosis factor-α.
tion Mix (ABI PRISM SNaPshotTM Multiplex kit, Applied Biosystems, Foster, CA, USA), and SNaPshot primers (5'-ATATAATCATGATTATAATCAATGATGAT CAATAGGTTTTGAGGGGCATG-3' for the -G308A lo- cus, and 5'-TAATCAATGATGATAAGACCCCCCTCGG AATC-3' for the -G238A locus). Thermal cycling con- ditions for amplification were 96oC for 10 s, 50oC for 5 s, and 60oC for 30 s. After 25 cycles, the PCR mix- ture was treated with 1 unit of shrimp alkaline phosphatase at 37oC for 1 h to remove unin- corporated ddNTPs and primers. The mixture was then incubated 75oC for 15 min to inactivate the enzyme.
For electrophoresis, 0.5 μL of the SNaPshot prod- uct, 0.5 μL Genescan-120 LIZ Size Standard (Applied Biosystems), and 9 μL Hi-Di formamide were mixed and vortexed. After denaturing at 95°C for 5 min, the samples were placed on ice. Electrophoresis was per- formed on an ABI PRISM 310 Genetic Analyzer (Applied Biosystems). The data were analyzed with the ABI PRISM GeneScan Analysis Software and Genotyper Software (Applied Biosystems).
Statistical analysis
The results are expressed as medians and ranges.
The data were analyzed using the SPSS 18.0 soft-
ware program (SPSS Inc., Chicago, IL, USA).
Frequency data were compared using Fisher’s exact test. Wilcoxon-Mann-Whitney rank sum test was used for the comparison of means in 2 groups, and Kruskal-Wallis test was used for 3 or more groups.
Pearson’s correlation was applied to evaluate the correlation between 2 variables. p-values less than 0.05 were considered statistically significant.
RESULTS
Patient characteristics
A total of 111 obese children (74 boys, 37 girls;
age, 6.4 to 15.5 yrs; mean±SD=11.1±2.0 yrs) were divided into 3 groups according to their NAFLD sta- tus: group I, normal control subjects (n=61); group II, children with simple steatosis (n=17); and group III, children with NASH (n=33).
Clinical features and laboratory findings of the patients are listed in Table 1. Other than the AST and ALT levels, only the serum insulin levels and HOMA-IR showed statistically significant differ- ences among three groups (p=0.000 & p=0.001) (Table 1).
Table 2.Frequencies of TNF-α Promoter Polymorphisms at -308 and -238 Loci in Children with NAFLD and Controls
TNF-α polymorphism
Group I controls (n=61)
Groups II+III NAFLD (n=50)
p-value*
-308 locus GG genotype GA genotype AA genotype G allele frequency A allele frequency -238 locus
GG genotype GA genotype AA genotype G allele frequency A allele frequency
59 (96.7%) 2 (3.3%) 0 (0%)
98.4%
1.6%
57 (93.4%) 4 (6.6%) 0 (0%)
96.7%
3.3%
44 (88.0%) 3 (6.0%) 3 (6.0%)
91%
9%
42 (84.0%) 8 (16.0%) 0 (0%)
92%
8%
0.134
0.133
*p-value less than 0.05 was statistically significant when Fisher’s exact test was applied. NAFLD: non-alcoholic fatty liver disease, TNF-α: tumor necrosis factor-α.
Fig. 1. The medians of HOMA-IR were significantly different among the 3 groups based on the status of NAFLD in obese children (p=0.001) (HOMA-IR: insulin resistance determined by homeostasis model assessment, NAFLD: non-alcoholic fatty liver disease, NASH: non-alcoholic steatohepatitis).
Comparison of TNF-α polymorphism bet- ween control subjects and NAFLD patients No significant differences were observed in the TNF-α polymorphism at the -308 locus between the controls (group I) and children with NAFLD (groups II+III combined) (GG 96.7%, GA 3.3%, and AA 0% in group I; GG 88.0%, GA 6.0%, and AA 6.0% in groups II+III; p=0.134) (Table 2). No corresponding difference was found between the 2 groups at the -238 locus (GG 93.4%, GA 6.6%, AA 0% in group I; GG 84.0%, GA 16.0%, AA 0%
in groups II+III; p=0.133) (Table 2). The fre- quency of the TNF -308 A allele was 1.6% in group I and 9% in groups II+III, and the frequency of the TNF -238 A allele was 3.3% in group I and 8%
in groups II+III (Table 2).
Serum TNF-α levels, NAFLD, and TNF-α polymorphism
Serum TNF-α levels were not significantly dif- ferent among the 3 groups, based on their NAFLD status (p=0.664) (Table 1). Moreover, no sig- nificant difference was found in the serum TNF-α levels among the genotypes at the -308 locus [median 20.5 pg/mL (range: 2.0-47.0 pg/mL) in
the GG genotype, 21.0 pg/mL (16.0-21.0 pg/mL) in the GA genotype, and 21.0 pg/mL (19.0-22.0 pg/mL) in the AA genotype; p=0.267], or at the -238 locus [median 21.0 pg/mL (range: 2.0-42.0 pg/mL) in the GG genotype and 22.0 pg/mL (16.0-47.0 pg/mL) in the GA genotype; p=0.703].
Relationship between insulin resistance and NAFLD or TNF-α polymorphism
The medians of HOMA-IR values were sig- nificantly different between the controls and chil- dren with NAFLD [median 2.8 (range: 0.7-15.4) in group I and median 4.6 (range: 1.2-32.2) in group II+III combined; p=0.001] (Fig. 1). No difference in medians of HOMA-IR was observed between group I and group II (p=0.052), and significant difference in medians of HOMA-IR was observed between group II and group III [median 3.3 (range: 1.5-32.2) in group II and median 6.1 (range: 1.2-15.3) in group III; p=0.007] (Fig. 1).
The HOMA-IR values correlated significantly with the serum aminotransferase levels (AST, r=0.229, p=0.019; ALT, r=0.284, p=0.003).
No difference was observed in the medians of HOMA-IR values among the genotypes at the -308 locus [median 3.6 (range: 0.7-32.2) in the GG geno-
type, 2.8 (1.4-3.3) in the GA genotype, and 2.6 (2.5-3.6) in the AA genotype; p=0.061], or at the -238 locus [median 3.3 (range: 0.7-32.2) in the GG genotype and 5.3 (1.1-15.4) in the GA genotype;
p=0.207] in children with NAFLD.
DISCUSSION
This study investigated the role of TNF-α pro- moter polymorphism and insulin resistance in the development of NAFLD in obese children. TNF-α is a well-known proinflammatory cytokine pro- duced in the adipose tissue, and acts as a mediator of insulin resistance [10]. Recently, TNF-α has been suggested to play an important role in the pathogenesis of NAFLD, and may be involved in hepatocyte injury, apoptosis, inflammation, and hepatic stellate cell activation causing fibrosis in the liver, as well as in modulating insulin resist- ance in NAFLD patients [28].
Until now, only one previous study has been re- ported on TNF-α and NAFLD in the pediatric pop- ulation [29], which showed that serum TNF-α lev- els correlated significantly with the histologic grad- ing of NASH in children with NAFLD, and seemed to be predictive of NASH. However, we found no difference in serum TNF-α levels between the chil- dren with NAFLD and the control subjects, and se- rum TNF-α levels did not reflect the status of NAFLD. Furthermore, serum TNF-α levels did not reflect the severity of NASH in our study when his- topathologic grading and staging of fibrosis were considered (steatosis, p=0.165; lobular inflam- mation, p=0.770; hepatocyte ballooning, p=0.064;
fibrosis, p=0.232). In earlier studies, increased TNF- α mRNA expression was observed in hepatic tissue and peripheral adipose tissue of NASH patients, and increased expression of TNF-α was correlated with more advanced NASH [11]. Collectively, these find- ings suggest that future studies on children with NAFLD should look beyond serum TNF-α level, and possibly focus on the expression of TNF-α in hepatic and adipose tissue itself to understand the pathogenesis of NAFLD related to childhood obesity.
Recently, several studies have analyzed TNF-α polymorphism in adults with NAFLD [16,18-21]. As first reported by Valenti et al. [16], the prevalence of the -238 TNF-α polymorphism was higher in adults with NAFLD, and these patients also showed higher insulin resistance. Moreover, Aller et al. [21]
reported that patients with the GA genotype at -308 locus had more severe portal inflammation and hep- atic fibrosis than patients with the wild-type geno- type, with significant elevations in serum TNF-α levels and HOMA-IR. In contrast, other studies have reported no significant differences in the prevalence of several TNF-α promoter polymorphisms, includ- ing those at the -308 and -238 loci, between pa- tients with NAFLD and controls [18,19]. Therefore, even in adults, it remains unclear whether TNF-α polymorphism affects the development of NAFLD, and to date, no such studies have been performed in children with NAFLD.
When we analyzed TNF-α promoter poly- morphism at -308 and -238 loci, we found no sig- nificant differences in polymorphisms at the -308 and the -238 loci between the controls and children with NAFLD. This result suggests that at least the TNF-α promoter polymorphisms at the -308 locus or the -238 locus are not associated with the devel- opment of NAFLD in pediatric populations.
Beyond TNF-α promoter polymorphisms, previous studies have suggested that insulin resistance might be a cause of NAFLD in obese patients [30], and to address this, we evaluated HOMA-IR as an indicator of insulin resistance. In our study, HOMA-IR was sig- nificantly different between the NAFLD group and the control subjects, and additionally, was significantly correlated with liver enzymes levels. Furthermore, we found a significant difference in HOMA-IR values be- tween children with simple steatosis and children with NASH. Nevertheless, insulin resistance was not directly related to TNF-α promoter polymorphisms at the -308 or the -238 loci. These results suggest that insulin resistance might be an important factor in the pathogenesis of NAFLD in obese children, especially in the progression of steatosis to NASH, regardless of TNF-α promoter polymorphisms.
In conclusion, TNF-α promoter polymorphisms at the -308 and -238 loci were not significantly asso- ciated with the development of NAFLD in obese children. Nevertheless, insulin resistance remains a likely essential factor in the pathogenesis of NAFLD in obese children, especially in the progression to NASH. Therefore, insulin resistance should be con- sidered as a possible link between NAFLD and child- hood obesity beyond TNF-α promoter polymor- phism.
ACKNOWLEDGEMENTS
This research was supported by the Seoul National University College of Medicine Research Grant for the Department of Pediatrics.
REFERENCES
1. Ludwig J, Viggiano TR, McGill DB, Oh BJ. Nonalcoholic steatohepatitis: Mayo Clinic experiences with a hitherto unnamed disease. Mayo Clin Proc 1980;55:434-8.
2. Powell EE, Cooksley WGE, Hanson R, Searle J, Halliday JW, Powell LW. The natural history of non- alcoholic steatohepatitis: a follow-up study of for- ty-two patients for up to 21 years. Hepatology 1990;
11:74-80.
3. Molleston JP, White F, Teckman J, Fitzgerald JF.
Obese children with steatohepatitis can develop cir- rhosis in childhood. Am J Gastroenterol 2002;97:
2460-2.
4. Lavine JE, Schwimmer JB. Nonalcoholic fatty liver disease in the pediatric population. Clin Liver Dis 2004;8:549-58.
5. Day CP, James OF. Steatohepatitis: a tale of two
“hits”? Gastroenterology 1998;114:842-5.
6. Matteoni CA, Younossi ZM, Gramlich T, Boparai N, Liu YC, McCullough AJ. Nonalcoholic fatty liver dis- ease: a spectrum of clinical and pathological severity.
Gastroenterology 1999;116:1413-9.
7. Polyzos SA, Kountouras J, Zavos C. Nonalcoholic fatty liver disease: the pathogenetic roles of insulin resist- ance and adipocytokines. Curr Mol Med 2009;9:
299-314.
8. Bugianesi E, Zannoni C, Vanni E, Marzocchi R, Marchesini G. Non-alcoholic fatty liver and insulin resistance: a cause-effect relationship? Dig Liver Dis 2004;36:165-73.
9. Hotamisligil GS, Arner P, Caro JF, Atkinson RL, Spiegelman BM. Increased adipose tissue expression of tumor necrosis factor-alpha in human obesity and insulin resistance. J Clin Invest 1995;95:2409-15.
10. Uysal KT, Wiesbrock SM, Marino MW, Hotamisligil GS. Protection from obesity-induced insulin resist- ance in mice lacking TNF-α function. Nature 1997;389:610-4.
11. Crespo J, Cayón A, Fernández-Gil P, Hernández- Guerra M, Mayorga M, Domínguez-Díez A, et al. Gene expression of tumor necrosis factor alpha and TNF-re- ceptors, p55 and p75, in nonalcoholic steatohepatitis patients. Hepatology 2001;34:1158-63.
12. Hui JM, Hodge A, Farrell GC, Kench JG, Kriketos A, George J. Beyond insulin resistance in NASH:
TNF-alpha or adiponectin? Hepatology 2004;40:46-54.
13. Chu CJ, Lu RH, Wang SS, Chang FY, Wu SL, Lu CL, et al. Risk factors associated with non-alcoholic fatty liver disease in Chinese patients and the role of tumor necrosis factor-alpha. Hepatogastroenterol- ogy 2007;54:2099-102.
14. Aller R, de Luis DA, Fernandez L, Calle F, Velayos B, Olcoz JL, et al. Influence of insulin resistance and adipokines in the grade of steatosis of nonalcoholic fatty liver disease. Dig Dis Sci 2008;53:1088-92.
15. Hajeer AH, Hutchinson IV. Influence of TNFα gene polymorphisms on TNFα production and disease.
Hum Immunol 2001;62:1191-9.
16. Valenti L, Fracanzani AL, Dongiovanni P, Santorelli G, Branchi A, Taioli E, et al. Tumor necrosis factor alpha promoter polymorphisms and insulin resistance in nonalcoholic fatty liver disease. Gastroenterology 2002;122:274-80.
17. Grove J, Daly AK, Bassendine MF, Day CP.
Association of a tumor necrosis factor promoter poly- morphism with susceptibility to alcoholic steatohe- patitis. Hepatology 1997;26:143-6.
18. Tokushige K, Takakura M, Tsuchiya-Matsushita N, Taniai M, Hashimoto E, Shiratori K. Influence of TNF gene polymorphisms in Japanese patients with NASH and simple steatosis. J Hepatol 2007;46: 1104-10.
19. Wong VW, Wong GL, Tsang SW, Hui AY, Chan AW, Choi PC, et al. Genetic polymorphisms of adiponectin and tumor necrosis factor-alpha and nonalcoholic fatty liver disease in Chinese people. J Gastroenterol Hepatol 2008;23:914-21.
20. Hu ZW, Luo HB, Xu YM, Guo JW, Deng XL, Tong YW, et al. Tumor necrosis factor-alpha gene promoter polymorphisms in Chinese patients with nonalcoholic fatty liver diseases. Acta Gastroenterol Belg 2009;72:
215-21.
21. Aller R, de Luis DA, Izaola O, González Sagrado M, Conde R, Alvarez Gago T, et al. G308A polymorphism of TNF-alpha gene is associated with insulin resist- ance and histological changes in non alcoholic fatty liver disease patients. Ann Hepatol 2010;9:439-44.
22. Kleiner DE, Brunt EM, Van Natta M, Behling C, Contos MJ, Cummings OW, et al. Design and vali- dation of a histological scoring system for nonalcoholic fatty liver disease. Hepatology 2005;41:1313-21.
23. Moon JS, Nam CM, Choi JM, Choe BK, Seo JW, Oh KW, et al. 2007 Korean national growth charts: review of developmental process and an outlook. Korean J Pediatr 2008;51:1-25.
24. Matthews DR, Hosker JP, Rudenski AS, Naylor BA, Treacher DF, Turner RC. Homeostasis model assess- ment: insulin resistance and beta-cell function from fasting plasma glucose and insulin concentrations in man. Diabetologia 1985;28:412-9.
25. Strauss S, Gavish E, Gottlieb P, Katsnelson L.
Interobserver and intraobserver variability in the so- nographic assessment of fatty liver. Am J Roentgenol
2007;189:W320-3.
26. Brunt EM, Janney CG, Di Bisceglie AM, Neuschwan- der-Tetri BA, Bacon BR. Nonalcoholic steatohepatitis:
a proposal for grading and staging the histological lesions. Am J Gastroenterol 1999;94:2467-74.
27. Kim TH, Kim BG, Shin HD, Kim JW, Kim CG, Kim JS, et al. Tumor necrosis factor-α and interleukin-10 gene polymorphisms in Korean patients with in- flammatory bowel disease. Korean J Gastroenterol 2003;42:377-86.
28. Tilg H, Hotamisligil GS. Nonalcoholic fatty liver dis- ease: Cytokine-adipokine interplay and regulation of insulin resistance. Gastroenterology 2006;131:934-45.
29. Manco M, Marcellini M, Giannone G, Nobili V.
Correlation of serum TNF-α levels and injury scores in pediatric nonalcoholic fatty. Am J Clin Pathol 2007;127:954-60.
30. Marchesini G, Brizi M, Morselli-Labate AM, Bianchi G, Bugianesi E, McCullough AJ, et al. Association of nonalcoholic fatty liver disease with insulin resistance. Am J Med 1999;107:450-5.