J Korean Ophthalmol Soc 2018;59(6):537-542 ISSN 0378-6471 (Print)⋅ISSN 2092-9374 (Online)
https://doi.org/10.3341/jkos.2018.59.6.537
Original Article
한국인에서의 빛간섭단층촬영기를 이용한 망막신경섬유층 두께 분석
Retinal Nerve Fiber Layer Thickness Measured by Spectral Domain Optical Coherence Tomography in Healthy Koreans
최윤아⋅조병주
Youna Choi, MD, Byung Joo Cho, MD, PhD
건국대학교 의학전문대학원 안과학교실
Department of Ophthalmology, Konkuk University School of Medicine, Seoul, Korea
Purpose: To determine normal retinal nerve fiber layer (RNFL) thickness by age and to investigate the relationships of the RNFL with clinical variables using spectral domain optical coherence tomography (SD-OCT) in healthy Koreans.
Methods: The peripapillary RNFL thicknesses were measured around the optic disc using consecutive circular B-scans with 3.5 mm diameter and automatically calculated using a SD-OCT.
Results: Three hundreds fifty-two eyes of 205 healthy subjects were included in the study and RNFL thickness were measured by SD-OCT. Overall average RNFL thickness was 100.2 ± 10.9 μm, and significantly and negatively correlated with age (r = -0.164, p = 0.002). The overall average RNFL thickness decrease per decade was 0.8 μm (95% confidence interval, -0.3 to -1.3, p = 0.019). Mean RNFL thickness of each quadrant was significantly correlated with axial length except in the superior quadrant.
Conclusions: This study describes the normal RNFL thickness values of Koreans as determined by SD-OCT. Furthermore, age was found to be correlated with normal RNFL thickness, however age-related changes were not uniform across every region.
J Korean Ophthalmol Soc 2018;59(6):537-542
Keywords: Axial length, Cup-to-disc ratio, Korean, Retinal nerve fiber layer, Spectral domain optical coherence tomography
■Received: 2017. 7. 20. ■ Revised: 2018. 3. 31.
■Accepted: 2018. 5. 28.
■Address reprint requests to Byung Joo Cho, MD, PhD Department of Ophthalmology, Konkuk University Medical Center,
#120-1 Neungdong-ro, Gwangjin-gu, Seoul 05030, Korea Tel: 82-2-2030-8180, Fax: 82-2-2030-5273
E-mail: bjcho@kuh.ac.kr
* Conflicts of Interest: The authors have no conflicts to disclose.
ⓒ2018 The Korean Ophthalmological Society
This is an Open Access article distributed under the terms of the Creative Commons Attribution Non-Commercial License (http://creativecommons.org/licenses/by-nc/3.0/) which permits unrestricted non-commercial use, distribution, and reproduction in any medium, provided the original work is properly cited.
녹내장은 비가역적인 실명의 주된 원인으로,1 망막신경 섬유층 두께의 감소를 일으키는 진행성 시신경병증이다.2,3 따라서 정확한 망막신경섬유층 두께를 비가역적인 시야 결 손이 일어나기 전에 측정하는 것이 녹내장 조기 진단과 경 과 관찰에도 중요하다.4
빛간섭단층촬영기(optical coherence tomography, OCT) 는 비침습적으로 망막신경섬유층 두께는 물론 단층까지 볼
수 있는 유용한 검사이다. 최근 스펙트럼영역 빛간섭단층촬 영(spectral domain optical coherence tomography, SD-OCT) 의 도입으로 기존의 시간 영역 빛간섭단층촬영(time do- main optical coherence tomography, TD-OCT)에 비해 높은 해상도를 보여 더 정밀한 검사 결과를 얻을 수 있게 되었 다.5-7 그리고 녹내장 의심 환자의 시야검사에서 장애가 나 타나기 전에 녹내장성 변화를 감지함에 있어서 빛간섭단층 촬영의 높은 해상도를 바탕으로 망막신경섬유층에 대한 객 관적인 정량적 평가가 가능해졌다.8
비록 SD-OCT가 망막신경섬유층 두께를 정확하고 편리 하게 측정할 수 있는 방법이지만, 아시아계와 소아일 경우 에는 결과 해석에 있어 제한점이 있었다. 그동안의 SD-OCT 의 정상 범위 데이터가 18세와 78세 사이 백인(111명의 남 성, 90명의 여성)을 대상으로 수집되어, 인종 및 나이에 따
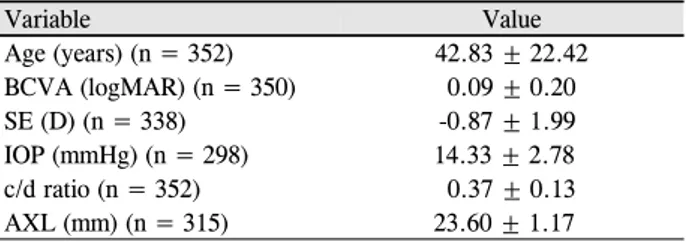
Table 1. Characteristics of subjects
Variable Value
Age (years) (n = 352) 42.83 ± 22.42
BCVA (logMAR) (n = 350) 0.09 ± 0.20
SE (D) (n = 338) -0.87 ± 1.99
IOP (mmHg) (n = 298) 14.33 ± 2.78
c/d ratio (n = 352) 0.37 ± 0.13
AXL (mm) (n = 315) 23.60 ± 1.17
All data was presented as mean ± SD.
BCVA = best corrected visual acuity; SE = spherical equivalent;
IOP = intraocular pressure; c/d ratio = cup-to-disc ratio; AXL = axial length; SD = standard deviation.
른 영향을 받을 수 있기 때문이다.9,10
아직까지 SD-OCT를 통한 한국인에서의 평균 망막신경 섬유층 두께를 측정한 연구는 많지 않았다. 따라서 SD-OCT 를 통해 정상인에서 나이에 따른 망막신경섬유층 두께를 측정하여 평균 두께를 결정하고, 이와 관련된 안구내인자 들에 대해 알아보고자 하였다.
대상과 방법
본 연구는 2012년 3월부터 2014년 4월 사이에 건국대학 교병원 안과를 방문했던 환자 중에서 굴절 검사와 세극등 현미경검사, 골드만압평안압계를 이용한 안압 측정, 자동시 야검사(Humphrey field analyzer model 740, Humphrey-Dublin, Carl Zeiss Meditec, Dublin, CA, USA)를 시행하였고, 안저 카메라(Topcon, TRC-NW8, Tokyo, Japan)를 이용하여 안저 사진을 촬영하여 정상안으로 판정된 205명, 352안을 대상으 로 하였다. 본 연구는 후향적으로 의무기록을 조사하였다.
또한 이전에 녹내장 또는 녹내장의증으로 진단받은 적이 있거나, 백내장이나 이외의 안과적 병력이 있는 경우, 전안 부 질환이 있는 경우도 배제하였다. 게다가 -6.00D 이상의 근시나 +6.00D 이상의 원시가 있는 경우도 배제하였다. 근 시나 원시가 있는 녹내장 환자는 그로 인한 시신경 모양의 변화로 인해 녹내장의 진단 및 정확한 비교가 어렵기 때문 이다.11
모든 대상자에 대해 초기에 기본적인 문진을 시행하였으 며, 빛간섭촬영검사는 단일 검사자에 의해 SPECTRALIS® Optical Coherence Tomography (Heidelberg Engineering, Heidelberg, Germany)를 이용하여 시행하였다. 망막시신경 섬유층 두께 수치는 숙련된 1명의 검사자가 동심원스캔방식 을 이용하여 시신경유두주위 망막신경섬유층 두께를 측정하 였다. 전체 망막신경섬유층 평균 두께는 360° 측정하였다. 6 개의 영역으로 구분하여 두께를 측정하였고, 6개의 영역은 이측, 상이측, 상비측, 비측, 하비측, 하이측(temporal [T], temporosuperior [TS], nasosuperior [NS], nasal [N], na- soinferior [NI], temporoinferior [TI]) 분면이다. 상측 사분면 과 하측 사분면도 측정하였으며, 각각의 두께는 비측과 이 측의 두께를 이용하여 계산하였다: Superior=(TS+NS)/2, Inferior=(TI+NI)/2.
각각의 연령대에서 평균 망막신경섬유층 두께를 결정하고 임상학적 변수에 대한 영향을 결정하기 위해 통계적 분석이 수행되었다. 다른 연령 그룹의 평균 망막신경섬유층 두께를 비교하기 위해 one-way analysis of variance (ANOVA) 변량 분석이 사용되었다. 각 분절의 평균 망막신경섬유층 두께 에 대한 인구 통계학적 변수의 영향을 연구하기 위해 다변
량 회귀분석을 사용하였다. 여기에는 연령, 최대교정시력, 굴절력, 안압, 안축장 길이와 시신경유두비가 포함되어 있 다. 본 연구는 헬싱키 선언을 준수하여 시행되었고, 본 기 관의 인증된 연구윤리 심의위원회에서 승인을 면제받았다.
모든 분석은 SPSS v.17.0 for windows (IBM Corp., Armonk, NY, USA)을 사용하여 수행되었다. 통계적 유의 성은 확률값 5% 미만으로 정의되었으며, 결과는 95% 신뢰 구간(confidence interval, CI)으로 제시되었다.
결 과
결과 분석에는 환자 205명, 352안이 포함되었고, 우안 176안, 좌안 176안이었으며, 대상군의 평균 나이는 42.83 ± 22.42세였다. 평균 최대 교정 시력은 0.09 ± 0.20 (logMAR), 평균 안압은 14.33 ± 2.78 mmHg, 평균 굴절 대응치는 -0.87 ± 1.99였다(Table 1).
SD-OCT를 이용한 망막신경섬유층 평균 두께는 100.2 ± 10.9 μm로 측정되었다. 이를 좀 더 세분화하여 각 사분면 별로 망막신경섬유층 두께를 확인한 결과, 하이측 부위의 망막신경섬유층 두께가 가장 두꺼운 것으로 나타났다 (Table 1).
352안은 나이에 따라 9군으로 분류하였다(Table 2). 평균 망막신경섬유층 두께와 이측 및 상측, 상이측, 상비측 분면 은 나이에 따른 유의한 음의 상관 관계를 보였다. 반면, 비 측, 하측, 하이측, 하비측 분면은 통계학적으로 유의한 차이 를 보이지 않았다(Table 3). 후향적으로 의무기록을 조사함 으로써 SD-OCT 시행 시에 시력, 안압 및 안축장 길이가 누락된 경우는 Table 3에서 제외하였다.
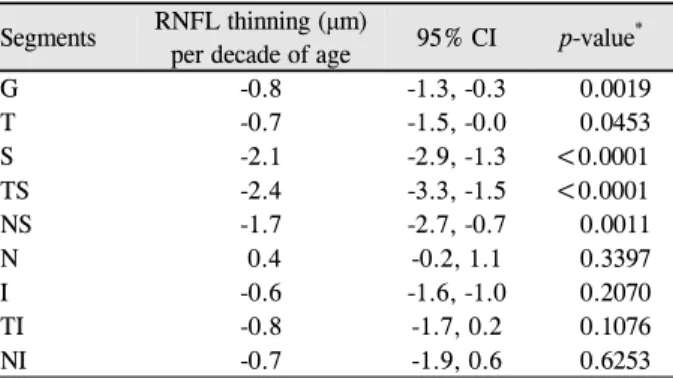
Fig. 1의 scatter-plot은 평균 망막신경섬유층 두께와 연령 사이의 관계를 보여준다. Fig. 1에서 2명의 값은 측정값의 오류로 보여 결과값에서는 제외하였다. 평균 망막신경섬유 층 두께는 나이대가 10년씩 증가함에 따라 0.8 μm씩 감소 함을 보였다(Table 4). 나머지 분면과 평균 두께 사이의 관
Table 2. Mean retinal nerve fiber layer thicknesses of each segment by age
1–9 10–19 20–29 30–39 40–49 50–59 60–69 70–79 80–89 Total p-value‡
N (%) 30 (8.5) 43 (12.2) 55 (15.6) 36 (10.2) 35 (9.9) 60 (17.0) 49 (13.9) 37 (10.5) 7 (2.0) 352 (100.0)
G 104.1 ±
7.2
100.9 ± 10.4
100.6 ± 9.0
101.4 ± 7.8
104.6 ± 9.3
98.9 ± 16.9
96.6 ± 8.7
96.3 ± 9.0
102.7 ± 6.8
100.2 ± 10.9
0.0054*
T 79.7 ±
13.7
78.3 ± 11.5†
88.9 ± 20.8†
79.0 ± 13.1
79.9 ± 12.6
77.2 ± 12.7‡
75.9 ± 15.0†
72.7 ± 9.7†
80.6 ± 8.3
79.3 ± 14.9
<0.0001*
S 131.5 ±
13.6
123.9 ± 14.9
122.3 ± 19.1
125.0 ± 13.1
130.1 ± 17.8
122.0 ± 17.7
115.5 ± 14.6
114.6 ± 17.0
106.6 ± 23.6
122.2 ± 17.3
<0.0001*
TS 144.7 ±
14.2†
138.3 ± 17.2†
138.9 ± 18.5†
140.4 ± 15.9†
145.1 ± 23.3†
135.0 ± 21.4
129.2 ± 16.4†
124.7 ± 19.1†
116.3 ± 48.4
136.1 ± 20.5
<0.0001*
NS 118.3 ±
20.1†
109.6 ± 19.9
105.7 ± 27.3
109.5 ± 17.7
115.0 ± 22.2
108.9 ± 23.1
101.7 ± 19.9†
104.6 ± 21.2
97.0 ± 10.9†
108.3 ± 22.1
0.0223*
N 67.9 ±
13.7
69.9 ± 15.6
64.9 ± 22.1
69.1 ± 14.0
73.4 ± 12.6
72.1 ± 12.6
69.9 ± 12.6
68.2 ± 14.7
79.3 ± 10.9
69.6 ± 15.3
0.1308
I 136.6 ±
16.5
131.3 ± 20.1
128.1 ± 15.6
131.7 ± 15.6
134.6 ± 12.8
131.2 ± 31.2
125.1 ± 12.9
129.5 ± 16.2
133.6 ± 14.4
130.6 ± 19.4
0.2879
TS 144.7 ±
14.2†
138.3 ± 17.2†
138.9 ± 18.5†
140.4 ± 15.9†
145.1 ± 23.3†
135.0 ± 21.4
129.2 ± 16.4†
124.7 ± 19.1†
116.3 ± 48.4
136.1 ± 20.5
<0.0001*
TI 155.3 ±
22.9
153.0 ± 19.7
152.7 ± 18.3
152.5 ± 17.8†
158.3 ± 17.5
152.3 ± 26.8†
144.7 ± 15.9
147.2 ± 18.5
159.6 ± 11.7
151.9 ± 20.3
0.0832
NI 117.9 ±
18.6
109.6 ± 26.8
103.5 ± 24.6
110.9 ± 21.7
110.9 ± 16.7
110.0 ± 39.3
105.6 ± 16.9
111.7 ± 19.0
107.6 ± 19.0
109.3 ± 25.3
0.4230
Values are presented as mean ± SD or n (%) unless otherwise indicated.
G = general; T = temporal; S = superior; TS = temporosuperior; NS = nasosuperior; N = nasal; I = inferior; TI = temporoinferior; NI
= nasoinferior.
*Statically significant (p-value < 0.05); †There are statistically significant differences (Dunneet T3 test are used for post hoc test, p < 0.05);
‡One-way analysis of variance (ANOVA).
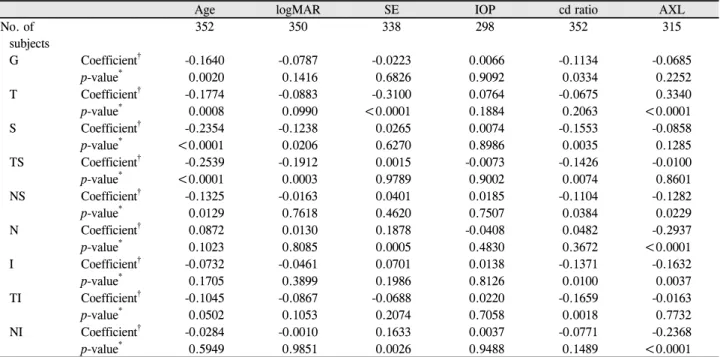
Table 3. Correlation between RNFL thickness in each region and clinical variables
Age logMAR SE IOP cd ratio AXL
No. of subjects
352 350 338 298 352 315
G Coefficient† -0.1640 -0.0787 -0.0223 0.0066 -0.1134 -0.0685
p-value* 0.0020 0.1416 0.6826 0.9092 0.0334 0.2252
T Coefficient† -0.1774 -0.0883 -0.3100 0.0764 -0.0675 0.3340
p-value* 0.0008 0.0990 <0.0001 0.1884 0.2063 <0.0001
S Coefficient† -0.2354 -0.1238 0.0265 0.0074 -0.1553 -0.0858
p-value* <0.0001 0.0206 0.6270 0.8986 0.0035 0.1285
TS Coefficient† -0.2539 -0.1912 0.0015 -0.0073 -0.1426 -0.0100
p-value* <0.0001 0.0003 0.9789 0.9002 0.0074 0.8601
NS Coefficient† -0.1325 -0.0163 0.0401 0.0185 -0.1104 -0.1282
p-value* 0.0129 0.7618 0.4620 0.7507 0.0384 0.0229
N Coefficient† 0.0872 0.0130 0.1878 -0.0408 0.0482 -0.2937
p-value* 0.1023 0.8085 0.0005 0.4830 0.3672 <0.0001
I Coefficient† -0.0732 -0.0461 0.0701 0.0138 -0.1371 -0.1632
p-value* 0.1705 0.3899 0.1986 0.8126 0.0100 0.0037
TI Coefficient† -0.1045 -0.0867 -0.0688 0.0220 -0.1659 -0.0163
p-value* 0.0502 0.1053 0.2074 0.7058 0.0018 0.7732
NI Coefficient† -0.0284 -0.0010 0.1633 0.0037 -0.0771 -0.2368
p-value* 0.5949 0.9851 0.0026 0.9488 0.1489 <0.0001
RNFL = retinal nerve fiber layer; SE = spherical equivalent; IOP = intraocular pressure; cd ratio = cup-to-disc ratio; AXL = axial length;
G = general; T = temporal; S = superior; TS = temporosuperior; NS = nasosuperior; N = nasal; I = inferior; TI = temporoinferior; NI
= nasoinferior.
*One-way analysis of variance (ANOVA); †Pearson correlation coefficient.
Figure 1. Associations between overall retinal nerve fiber layer
(RNFL) thickness and age. Age significantly affected overall average RNFL thickness, and the rate of average RNFL thin- ning was approximately 0.8 μm per decade. dots mean in- dividual RNFL thickness for age, line mean RNFL thickness average.Table 4. Multiple linear regression analysis for the relation-
ship of age with RNFL thickness in each regionSegments RNFL thinning (μm)
per decade of age 95% CI p-value*
G -0.8 -1.3, -0.3 0.0019
T -0.7 -1.5, -0.0 0.0453
S -2.1 -2.9, -1.3 <0.0001
TS -2.4 -3.3, -1.5 <0.0001
NS -1.7 -2.7, -0.7 0.0011
N 0.4 -0.2, 1.1 0.3397
I -0.6 -1.6, -1.0 0.2070
TI -0.8 -1.7, 0.2 0.1076
NI -0.7 -1.9, 0.6 0.6253
RNFL = retinal nerve fiber layer; CI = confidence intervals; G = general; T = temporal; S = superior; TS = temporosuperior; NS
= nasosuperior; N = nasal; I = inferior; TI = temporoinferior;
NI = nasoinferior.
*Multivariate analysis regression.
Figure 2. The associations between retinal nerve fiber layer
(RNFL) thickness and axial length (AXL). AXL significantly affected average RNFL thickness in four quadrants. RNFL thicknesses in superior, nasal, and inferior quadrants decreased and RNFL thickness in temporal quadrant increased as AXL increased. dots mean RNFL thickness for AXL, lines are pre- sented as mean RNFL thickness. T = temporal; S = superior;N = nasal; I = inferior.
Table 5. Multiple linear regression analysis for the relation-
ship of axial length with RNFL thickness in each regionSegments RNFL thinning (μm)
per axial length 95% CI p-value*
G -0.9 -2.9, 1.0 0.3445
T 3.1 1.2, 4.9 0.0014
S -2.0 -3.7, -0.4 0.0018
TS -1.2 -3.4, 0.8 0.2459
NS -3.0 -5.0, -0.9 0.0045
N -3.5 -4.8, -2.1 <0.0001
I -2.7 -4.7, -0.8 0.0060
TI -0.4 -2.3, 1.6 0.7267
NI -5.6 -8.0, -3.1 <0.0001
RNFL = retinal nerve fiber layer; CI = confidence intervals; G = general; T = temporal; S = superior; TS = temporosuperior; NS
= nasosuperior; N = nasal; I = inferior; TI = temporoinferior; NI
= nasoinferior.
*Multivariate analysis regression.
계 또한 Table 4에 나타내었다.
굴절력(spherical equivarant, SE)은 모두 +4.25 D에서 -5.25 D 사이에 분포하였으며, 평균 굴절력은 -0.87 ± 1.97 D였다. 굴절력은 이측 사분면의 망막신경섬유층 두께 (pearson 상관 계수)와 음의 상관 관계를 보였다(Table 3).
안축장 길이는 18.80 mm에서 26.52 mm까지 평균 23.60
± 1.17 mm의 범위를 가졌다. 안축장 길이는 대부분의 사분 면 망막신경섬유층 두께에 영향을 미치는 것으로 보였다 (Table 5). 망막신경섬유층 두께는 안축장 길이가 증가함에 따라 상측, 하측, 비측 사분면 순으로 현저한 감소를 보였
다. 안축장 길이와 평균 망막신경섬유층 두께, 상이측과 하 이측 분면 두께 사이의 상관관계는 통계적으로 유의하지 않았다. Fig. 2의 scatter-plot은 평균 망막신경섬유층 두께 와 안축장 길이 사이의 관계를 보여준다. Fig. 2에서 1명의 값은 측정값의 오류로 결과값에서는 제외하였다. 또한 시 력과 안압은 어떠한 사분면에서도 평균 망막신경섬유층 두 께와 유의한 연관성을 보이지 않았다(Table 3).
고 찰
정상 망막신경섬유층 두께는 상당히 다양하며, 그동안 인종, 연령, 굴절력, 안축장 길이 등의 망막신경섬유층 두께 에 대한 영향은 TD-OCT를 사용하여 연구되었다.9,12-14 일 부 연구는 TD-OCT와 SD-OCT에 의해 이루어진 망막신경
섬유층 두께가 다르다고 보고하고 있다.15 지금까지 알려진 것 중에 이번 연구가 한국인에서 SD-OCT를 사용하여 망 막신경섬유층 두께와 다른 임상적 변수 간의 관계를 다룬 첫 번째 연구이다. 이번 연구 결과에 따르면, 정상적인 한 국인에서의 전체 평균 망막신경섬유층 두께는 100.2 ± 10.9 μm이며, 이는 같은 아시아계인 일본의 연구 결과와 비교할 때 유사한 결과를 보였다.16
전체 평균 망막신경섬유층 두께, 상측 및 이측 망막신경 섬유층 두께도 나이가 들수록 유의미하게 감소함을 보였다.
특히 상이측 분면에서 망막신경섬유층 두께에 대한 연령의 영향이 현저하게 나타났지만, 비측과 하측 두께는 유의한 상관성을 보이지 않았다.
Lee et al17은 또한 비측 분면의 3, 4시 방향에서만 나이 에 따른 망막신경섬유층 두께 감소를 보이지 않았다고 하 였다. 이것은 나이에 따라 큰 변화를 보이지 않는 부위를 정함에 있어 중요한 정보이며, 한국인을 대상으로 한 본 연 구에서는 비측과 하측 분면이 나이에 따라 큰 변화가 없음 을 보여준다.
따라서 비측과 하측 분면 영역에서 망막신경섬유층 두께 의 변화가 발생한다면, 병리학적 변화를 나타내는 것일 수 있다. 그러므로 녹내장이 의심스러운 환자에서 녹내장을 진단하거나 진행을 감지할 때 이러한 사분면을 좀 더 주의 깊게 관찰할 필요가 있다.
본 연구에서는 매 10년마다 평균 망막신경섬유층 두께가 0.8 μm씩 감소하였는데(p-value=0.0054), 이는 아시아인에 서 이전에 보고된 것보다 낮은 수준의 망막신경섬유층 두 께의 감소율이다.16,17 이러한 결과는 본 연구에서 가장 높은 연령대가 평균적으로 높은 망막신경섬유층 두께를 보인 것 으로 인해 발생한 것으로 추정되며, 가장 높은 연령층의 데 이터는 상대적으로 작은 표본 크기 때문에 유사한 연령 그 룹을 대표할 수는 없다.
이전에 일본의 연구에서는 나이에 따라 1년마다 0.19 μm 씩 감소되는 것으로 알려져 있지만, 이 연구는 전신 질환이 있는 환자가 제외되지 않았고, 20세 이상의 성인만을 포함 하여 진행하였다.15 한국인을 대상으로 한 다른 연구에서는, 평균 망막신경섬유층 두께는 10년당 평균 2.1 μm의 감소율 을 보여주었지만, 단지 남성만 포함된 결과로 한국 인구 전 체를 대표할 수 없었다.18
이번 연구를 통해 망막신경섬유층 두께가 안축장의 길이 와 연관성을 보임을 알 수 있었으나, 굴절력과는 뚜렷한 연 관성을 보이지는 않았다. 그러나 이러한 결과는 망막신경 섬유층 두께에 대한 굴절력의 영향이 정확히 반영되지 못 한 결과일 수 있다. 왜냐하면 굴절력을 측정할 때에 조절마 비굴절제(cycloplegic agent)가 사용되지 않았으며, 일부 피
험자에서는 백내장의 정도에 따라 굴절 오차에 영향을 줄 수 있기 때문이다.
대부분의 분면에서 안축장의 길이와 망막신경섬유층 두 께 사이에 상당한 연관성을 보였다(Table 5). 즉 안축장의 길이가 길수록 망막신경섬유층 두께는 더 얇아지는 것을 보였다. 이것은 이전의 연구들과 일치하는 결과이다.9,13,18 하지만 상이측 및 하이측 분면은 안축장의 길이가 길어져 도 망막신경섬유층 두께 변화가 거의 변화 없이 안정적임 을 알 수 있었다.13,16,18
이번 연구에는 몇 가지 제한점이 있다. 특히 단면적 설계 로 진행되었다는 점에서 추가적이고 장기적인 종단 연구 (longitudinal study)가 필요하며, 이를 통해 망막신경섬유 두께의 연령에 따른 변화에 대해 보다 더 정확한 정보를 얻 을 수 있다. 또한 표본이 각 연령대별로 고르게 분포되어 있지 않았다. 그리고 표본 집단의 크기가 충분히 크지 못한 상태에서, 동일 환자의 양안을 포함시키고, 상관성이 높아 보이는 변수들을 사용함으로써 결과값이 과장되어 나타났 을 가능성이 있다. 상측과 하측의 망막신경섬유층 두께값 을 도출함에 있어 보다 검증된 공식을 사용하지 못한 것 또 한 이 논문의 한계점이다.
결론적으로, Spectiralis SD-OCT에 의해 결정된 건강한 한국인들의 평균 망막신경섬유층 두께는 나이와 연관이 있 을 것으로 보인다. 연령대별로 상측 망막신경섬유층 두께 의 감소가 현저하였으며, 하측과 비측 사분면은 연령에 따 른 영향이 비교적 작았다. 또한 비록 이측 사분면은 안구의 신장에도 안정적인 두께를 보였으나, 모든 사분면의 망막 신경섬유층 두께에 안축장의 길이가 상당한 영향을 미칠 수 있었다. 따라서 이러한 결과는 노인 또는 근시 환자의 녹내장의 진단 또는 경과관찰 시 고려해야 할 사항이다.
REFERENCES
1) Klaver CC, Wolfs RC, Vingerling JR, et al. Age-specific prevalence and causes of blindness and visual impairment in an older pop- ulation: the Rotterdam Study. Arch Ophthalmol 1998;116:653-58.
2) Sommer A, Miller NR, Pollack I, et al. The nerve fiber layer in the diagnosis of glaucoma. Arch Ophthalmol 1977;95:2149-56.
3) Quigley HA, Katz J, Derick RJ, et al. An evaluation of optic disc and nerve fiber layer examinations in monitoring progression of early glaucoma damage. Ophthalmology 1992;99:19-28.
4) Sommer A, Katz J, Quigley HA, et al. Clinically detectable nerve fiber atrophy precedes the onset of glaucomatous field loss. Arch Ophthalmol 1991;109:77-83.
5) Leung CK, Cheung CY, Weinreb RN, et al. Retinal nerve fiber lay- er imaging with spectral-domain optical coherence tomography: a variability and diagnostic performance study. Ophthalmology 2009;116:1257-63, 1263.e1-2.
6) Kim JS, Ishikawa H, Sung KR, et al. Retinal nerve fibre layer thick-
= 국문초록 =
한국인에서의 빛간섭단층촬영기를 이용한 망막신경섬유층 두께 분석
목적: 정상안에서 빛간섭단층촬영기를 통해 평균 망막신경섬유층 두께를 측정하고, 여러 요인과의 연관성에 대해 알아보고자 하였다.
대상과 방법: 정상인 205명의 352안을 대상으로 빛간섭단층촬영기를 이용하여 망막신경섬유층 평균 두께를 측정하였다.
결과: 전체 평균 retinal nerve fiber layer 두께는 100.2 ± 10.9 μm였으며, 연령대가 높아짐에 따라 망막신경섬유층 두께가 10년당 0.8 μm씩 감소함을 보였다. 상이측, 하이측을 제외한 나머지 사분면에서 안축장 길이와 망막신경섬유층 두께 사이에 유의한 상관관계 를 보였다.
결론: 이 연구는 빛간섭단층촬영기를 통하여 한국인에서의 평균 망막신경섬유층 두께를 측정하였다. 연령이 정상 망막신경섬유층 두 께와 연관성이 있었으나, 연령에 따라 각기 다른 분면에서 모두 일정한 변화를 보이는 것은 아니었다.
<대한안과학회지 2018;59(6):537-542>
ness measurement reproducibility improved with spectral domain optical coherence tomography. Br J Ophthalmol 2009;93:1057-63.
7) Mwanza JC, Chang RT, Budenz DL, et al. Reproducibility of peri- papillary retinal nerve fiber layer thickness and optic nerve head parameters measured with cirrus HD-OCT in glaucomatous eyes.
Invest Ophthalmol Vis Sci 2010;51:5724-30.
8) Lisboa R, Leite MT, Zangwill LM, et al. Diagnosing preperimetric glaucoma with spectral domain optical coherence tomography.
Ophthalmology 2012;119:2261-9.
9) Budenz DL, Andersoon DR, Varma R, et al. Determinants of nor- mal retinal nerve fiber layer thickness measured by Stratus OCT.
Ophthalmology 2007;114:1046-52.
10) Alasil T, Wang K, Keane PA, et al. Analysis of normal retinal nerve fiber layer thickness by age, sex, and race using spectral domain optical coherence tomography. J Glaucoma 2013;22:532-41.
11) Hyung SM, Kim DM, Hong C, Youn DH. Optic disc of the myopic eye: relationship between refractive errors and morphometric characteristics. Korean J Ophthalmol 1992;6:32-5.
12) Savini G, Zanini M, Carelli V, et al. Correlation between retinal nerve fibre layer thickness and optic nerve head size: an optical co- herence tomography study. Br J Ophthalmol 2005;89:489-92.
13) Hougaard JL, Ostenfeld C, Heijl A, Bengtsson B. Modelling the normal retinal nerve fibre layer thickness as measured by Stratus optical coherence tomography. Graefes Arch Clin Exp Ophthalmol 2006;244:1607-14.
14) Leung MM, Huang RY, Lam AK. Retinal nerve fiber layer thick- ness in normal Hong Kong chinese children measured with optical coherence tomography. J Glaucoma 2010;19:95-9.
15) Knight OJ, Chang RT, Feuer WJ, Budenz DL. Comparison of retinal nerve fiber layer measurements using time domain and spectral do- main optical coherent tomography. Ophthalmology 2009;116:1271-7.
16) Hirasawa H, Tomidokoro A, Araie M, et al. Peripapillary retinal nerve fiber layer thickness determined by spectral-domain optical coherence tomography in ophthalmologically normal eyes. Arch Ophthalmol 2010;128:1420-6.
17) Lee JY, Hwang YH, Lee SM, Kim YY. Age and retinal nerve fiber layer thickness measured by spectral domain optical coherence tomography. Korean J Ophthalmol 2012;26:163-8.
18) Leung CK, Mohamed S, Leung KS, et al. Retinal nerve fiber layer measurements in myopia: An optical coherence tomography study.
Invest Ophthalmol Vis Sci 2006;47:5171-6.