Research Paper
Comparing climate projections for Asia, East Asia and South Korea
Hyeyeong Choe*·James H. Thorne*·Dongkun Lee**
University of California, Davis*, Seoul National University**
아시아 대륙, 동아시아, 대한민국을 대상으로 다른 공간적 규모의 기후변화시나리오 예측 비교
최혜영*·James H. Thorne*·이동근**
University of California, Davis*, 서울대학교**
요 약 : 우리나라의 많은 기후변화 관련 영향 평가 연구들이 기상청에서 제공하는 기후변화 시나리오를 이 용하고 있지만, 하나의 기후 시나리오로 기후변화의 잠정적인 영향을 정확히 예측하기에는 한계가 있다.
본 연구는 세 가지의 지역적 스케일 - 아시아 대륙, 동아시아 6개국, 대한민국- 을 대상으로 두 가지 대 표농도경로 시나리오에서 17개의 지역기후모델을 이용하여 현재와 2070년의 연간 최저 온도와 연간 강수 량의 차이를 확인하였다. 대한민국의 경우 최저온도 증가량의 범위는 아시아 규모보다 작았으며 강수량 차이에 대한 편차는 아시아 규모보다 컸다. 최저온도 증가범위는 1.3 °C에서 5.2 °C이며, 연간 강수량 차 이는 -42.4 mm (-3.2%) 에서 +389.8 mm (+ 29.6%) 로 기상청의 기후변화 시나리오는 긍정적 기후 시나리오의 예측값에 가까운 것으로 나타났다. 따라서 기후변화 및 관련 영향 평가 연구들은 다양한 기후 변화 시나리오를 이용하여 그 예측 범위에 대비할 필요가 있으며, 본 연구 결과에 따라 GFDL-CM3와 INMCM4의 두 가지 기후모델을 이용하여 우리나라의 지구 온난화에 대한 잠정적인 영향을 평가하기를 권한다.
주요어 : 기후 시나리오, 최저온도, 강수량, CMIP5, RCP
Abstract : Many studies on climate change and its impacts use a single climate scenario. However, one climate scenario may not accurately predict the potential impacts of climate change. We estimated temperature and precipitation changes by 2070 using 17 of the CMIP5 Global Climate Models (GCMs) and two emission scenarios for three spatial domains: the Asian continent, six East Asia countries, and South Korea. For South Korea, the range of increased minimum temperature was lower than for the
First and Corresponding Author: Hyeyeong Choe, Dept. of Environmental Science and Policy, University of California, Davis, Davis, CA 95616, USA, Tel: +1-530-217-9578, E-mail: [email protected]
Co-Authors: James H. Thorne, Dept. of Environmental Science and Policy, University of California, Davis, Davis, CA 95616, USA, E- mail: [email protected]
Dongkun Lee, Dept. of Landscape Architecture and Rural System Engineering, Seoul National University, Seoul 08826, Korea, E- mail: [email protected]
Received : 1 January, 2017. Revised : 14 April, 2017. Accepted : 16 April, 2017.
https://doi.org/10.14249/eia.2017.26.2.114
Ⅰ. Introduction
Impacts of climate change extend over a wide range of the environment, economy, and society (Arnell et al. 2016), so studies on evaluating the potential impacts of climate change are actively being carried out (e.g. Choe 2015; Elsen &
Tingley 2015; Prieto-Torres et al. 2016). For exam- ple, climate change vulnerability assessments can provide useful information for the establishment of adaptation strategies (Choe et al. 2017).
Even though the Intergovernmental Panel on Climate Change (IPCC) provides various General Circulation Models (GCMs), many Korean studies on climate change and its impacts have often relied on one GCM (e.g. impacts on ecosystem, industry, and climate vulnerability assessments;
Park et al. 2014; Park et al. 2015; Kim et al. 2015;
Kim et al. 2016), or an ensemble approach using partial GCMs (Lee et al. 2016). The Korea Meteorological Administration has recently devel- oped a 12.5-km scale climate change scenario from a HadGEM2-AO model (KMA 2012). Many modeling studies conducted in South Korea use this climate scenario to suggest national climate change adaptation strategies (Shin & Jung 2015).
However, this GCM may not accurately predict
the potential impacts of climate change.
Since climate projections by alternative models can be variable, a single GCM will likely not fully express the uncertainty in climate change scenar- ios (Araújo & New 2007). Each GCM has uncer- tainty originating from the variations in initial conditions that each GCM is run on and the structural differences among the models (Murphy et al. 2004; Kim & Cho 2016). Therefore, the eval- uation of the differences in predicted future con- ditions among various GCMs would be helpful for their use in development of climate change studies and for guiding mitigation and adaptation strategies and policy decisions in preparation for uncertain climate change conditions.
An alternative way to address these inter- model variations is the ensemble approach which combines several GCMs to produce a mean model (Sanderson et al. 2015; Giorgi et al. 2016).
However, there are recognized challenges for the ensemble approach such as lack of verification, model dependence, and mean bias (Tebaldi &
Knutti 2007).
Shin & Jung (2015) analyzed CMIP5 (Coupled Model Intercomparison Project Phase 5; Taylor et al. 2012) climate change projections from 34 GCMs to estimate the range of projected future ranges of the larger regions, but the range of projected future precipitation was higher. The range of increased minimum temperatures was between 1.3 ˚C and 5.2 ˚C, and the change in precipitation ranged from - 42.4 mm (- 3.2%) and + 389.8 mm (+ 29.6%) for South Korea. The range of increased minimum temperatures was between 2.3 ˚C and 8.5 ˚C for East Asia countries and was between 2.1
˚C and 7.4 ˚C for the Asian continent, and the change in precipitation ranged from 28.8 mm (+ 6.3%) and 156.8 mm (+ 34.3%) for East Asia countries and from 32.4 mm (+ 5.5%) and 126.2 mm (+ 21.3%) for the Asian continent. We suggest climate change studies in South Korea should not use a single GCM or only an ensemble climate model’s output and we recommend to use GFDL-CM3 and INMCM4 GCMs to bracket projected change for use in other national climate change studies to represent the range of projected future climate conditions.
Keywords : Climate Scenario, CMIP5, Minimum Temperature, Precipitation, RCP
climate conditions from GCMs by RCP (Representative Concentration Pathways) scenar- ios for four spatial extents: Global, South Korea, North Korea, and Japan. However, they only con- sidered regional average values from each GCM and the spatial resolutions of the GCMs they con- sidered were various, generally at coarse resolu- tion, with grid resolutions ranging from approxi- mately 21 km to 619 km at the equator (ENES 2016).
In this study, we assess conditions of future projected climate by 2070 for 17 CMIP5 (Taylor et al. 2012) GCMs under two emission scenarios.
We examine these trends for three nested region- al scales; the Asian continent, six East Asia coun- tries, and South Korea, and select two GCMs and two emission scenarios that bracket future condi- tions. We compare the predicted future condi- tions for Asia with those for six East Asia coun- tries and for South Korea.
Our main objectives in this study were: (1) to estimate temperature and precipitation changes for the Asian continent by 2070; (2) to evaluate the difference of climate projections among vari- ous GCMs; and (3) to identify regional climate projection patterns from two GCMs that bracket the range of projected climate futures. The ulti- mate goal of this study is to provide detail on the uncertainties of climate projections and sugges- tions on using appropriate GCMs for regional cli- mate change studies to prepare for the impacts of climate change.
II. Materials and Methods
This study analyzed climate change for three nested regions: South Korea, six East Asia coun- tries (China, Japan, Mongolia, Russian Federation,
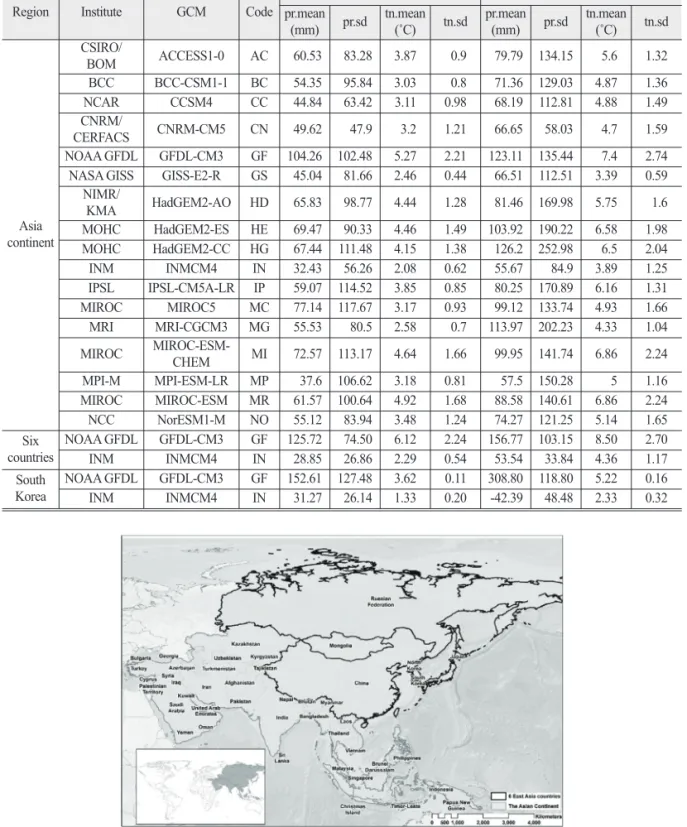
and South and North Korea), and the Asian con- tinent. The Asian continent was defined using the boundary of “World Countries” provided by Esri Data & Maps, which identifies 53 countries and 42 million km2of land area as part of the conti- nent (Figure 1). Asia is the world’s largest and most populous continent containing around 60%
of the world’s population, and has diverse cli- mates according to location and physical geogra- phy (Wheeler 2015).
1. Global Climate Models from CMIP5
We obtained minimum temperature and pre- cipitation for historical and 17 future CMIP5 GCM projections that have results for two RCP (RCP 4.5 and RCP 8.5) emission scenarios from the WorldClim website (WorldClim 1.4; http://
www.worldclim.org) at 10-minute (of a longi- tude/latitude degree) spatial resolution (≒ 18.5 km at the equator) (Table 1). The WorldClim website provides monthly minimum and maxi- mum temperature, and precipitation climate vari- ables, and these climate datasets have been used or cited in over 5,917 instances (Web of Science, accessed Nov. 28 2016).
For historical climate representations, we used 30-year means of precipitation and mean temper- ature (representative of 1960-1990), which were generated through interpolation of climate data from weather stations, at a 30 arc-second resolu- tion (≒ 1 km2) (Hijmans et al. 2005). For future time periods, we used 2070 data representing the 20-year means for 2061-2080 as target year because they are publicly available future data from the WorldClim. These future projections have been downscaled using the current-time WorldClim climate surfaces. This was computed as the difference between the GCM run for the
baseline years and for the target years. These change were interpolated to high resolution grids and then calibrated with WorldClim historical dataset (Hijmans et al. 2005).
The RCPs are future emission scenarios given different assumptions about greenhouse gas con- centrations in the atmosphere. RCPs describe the radiative imbalance in W/m2of Earth’s surface by 2100 as increases from preindustrial emissions.
Most GCMs represent four RCPs: 2.6, 4.5, 6.6, and 8.5 (van Vuuren et al. 2011; SCENIC 2014), and we chose two RCPs (RCP 4.5 and RCP 8.5) for this study to compare the differences between RCP scenarios. RCP 4.5 is a scenario of stabilizing radiative forcing at 4.5 W/m2in 2100 without exceeding that value (Thomson et al. 2011). RCP 8.5 is a high greenhouse gas emissions pathway and “baseline” scenario that does not adopt any mitigation target (Riahi et al. 2011).
2. Differences of Future Climate Conditions We analyzed the differences in annual mean minimum temperature (annual Tmin) and total annual precipitation (annual PPT) between the historical data and the 2070 projections using the all 17 GCM projections for the three spatial domains under the two RCPs. We selected the annual Tmin for this study because it is expected to become warmer at a faster rate than annual mean maximum temperature in most locations (Hartmann et al. 2013). We averaged the 12 monthly minimum temperature values (˚C) repre- senting the historical mean and for 2070 from each GCM for each target region. For precipita- tion, we added the 12 monthly total precipitation (mm) provided by WorldClim to compute annual precipitation for the historical and future time periods for each GCM and each target region.
Then, we subtracted the historical climate data values from future climate values for each GCM to evaluate climate change ranges among the var- ious GCMs. Finally, we selected two GCMs that bracket most of the climate projections for the Asia continent to see the spatial climate change patterns for 2070.
III. Results
1. Climate Change for the Asian Continent Annual minimum temperature increased under all GCMs and both RCPs by 2070 for all regional scales (Figure 2 and Table 1). For the Asian conti- nent, the range of increased minimum tempera- tures was between 2.1 ˚C (INMCM4; IN) and 5.3
˚C (GFDL-CM3; GFDL) under RCP 4.5, and the range of increased minimum temperatures was between 3.4 ˚C (GISS-E2-R; GISS) and 7.4 ˚C (GFDL) under RCP 8.5 (from the historic mean of -1.6 ˚C). For the six East Asia countries, the range of increased minimum temperatures was between 2.3 ˚C (INMCM4; IN) and 6.1 ˚C (GFDL) under RCP 4.5, and the range of increased minimum temperatures was between 3.6 ˚C (GISS) and 8.5
˚C (GFDL) under RCP 8.5 (from the historic mean of -9.1 ˚C). For South Korea, the range of increased minimum temperatures was between 1.3 ˚C (INMCM4; IN) and 3.6 ˚C (GFDL) under RCP 4.5, and the range of increased minimum temperatures was between 2.3 ˚C (INMCM4; IN) and 5.2 ˚C (GFDL) under RCP 8.5 (from the his- toric mean of 5.9 ˚C).
On average, all the GCMs project increases in annual precipitation for the Asian continent and for the six East Asia countries by 2070 under the two RCPs, but regional differences could be expected from standard deviation values (Figure
2 and Table 1). For the Asian continent, the range of increased precipitation was between 32.4 mm (+ 5.5%, IN) and 104.3 mm (+ 17.6%, GFDL) under RCP 4.5, and the range of increased pre- cipitation was between 55.7 mm (+ 9.4%, GISS) and 126.2 mm (+ 21.3%, HadGEM2-CC; HG) under RCP 8.5 (from the historic mean of 593.4 mm). For the six East Asia countries, the range of increased precipitation was between 28.8 mm (+
6.3%, IN) and 125.7 mm (+ 27.5%, GFDL) under RCP 4.5, and the range of increased precipitation was between 52.6 mm (+ 11.5%, MPI-ESM-LR) and 156.8 mm (+ 34.3%, GFDL) under RCP 8.5 (from the historic mean of 456.6 mm). For South Korea, one GCM projected decreases in precipita- tion under both RCP scenarios. The range of pre- cipitation change was between -8.4 mm (- 0.6%, BCC-CSM1-1; BC) and 271.9 mm (+ 20.6%, MIROC-ESM-CHEM; MI) under RCP 4.5, and the range of changed precipitation was between - 42.4 mm (- 3.2%, IN) and 389.8 mm (+ 29.6%, ACCESS1-0; AC) under RCP 8.5 (from the his- toric mean of 1,317.5 mm).
Under RCP 4.5 scenario, for the larger regions, the climate change trends that 17 GCMs projected were similar. GFDL projects higher precipitation than the other GCMs. For South Korea, projecting trends for minimum temperature were similar, but there were different projecting trends for pre- cipitation. BC projected the lowest precipitation and MI projected the highest precipitation.
We present these climate change ranges from the 17 GCMs in Figure 2. In the figure, the origin of the axes represents mean conditions for the historical 1960-1990 timeframe, used as the base- line. The x axis refers to changes in annual Tmin (˚C), and the y axis to changes in annual PPT (mm). We selected the GFDL-CM3 (GFDL) and
the INMCM4 (IN) GCMs for subsequent spatial assessments of climate change because they bracket most of the variance of future climate conditions for Asia continent and they are suit- able to prepare for the uncertainty of climate change.
2. Spatial Assessments of Climate Change for Asia Continent in 2070
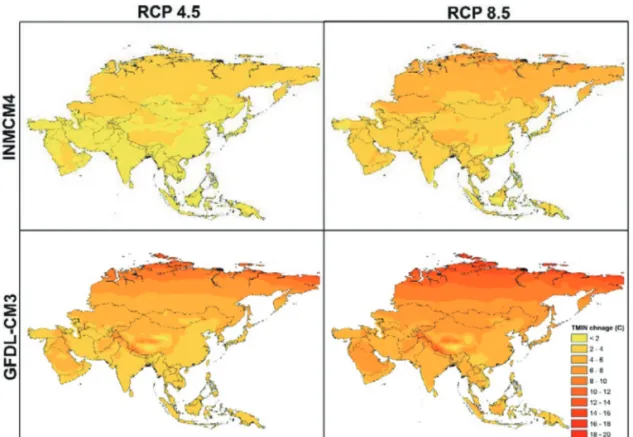
GFDL-CM3 (GFDL) and INMCM4 (IN) project- ed increases in annual minimum temperature in all regions in Asia continent by 2070 (Figure 3).
Temperature increases more in the higher lati- tudes in both GCMs, but the degree of increasing temperature was much higher from the GFDL GCM. However, there were regional differences in temperature projections between the two GCMs. For example, IN projected higher temper- ature increase in the Tibetan plateau than in sur- rounding regions, while GFDL identified poten- tial regional climate refugia (refugia have facilitat- ed the persistence of species under changing cli- mates; Keppel et al. 2012) in Tibet. Surrounding this region, local temperature change is high under the GFDL GCM.
On average, the two GCMs under both RCPs each project an increase in annual precipitation on the Asian continent. However, some countries especially in Western Asia including Turkey, Iran, Afghanistan and Central China were projected to have decreases in annual precipitation under the four climate projections (Figure 4). In case of pre- cipitation, regional differences among GCMs were larger than those of temperature. For example, the GFDL projects an increase in precipitation in all East Asia, but some regions in South Korea and Southern Japan were projected to have a decrease in annual precipitation under the IN GCM.
IV. Discussion
We found that various climate projections pro- duce different ranges of climate change for the Asian continent, and the ranges differ under the two RCP scenarios (Figure 2). On average, all of the GCMs we used in this study predicted increasing temperature in Asia continent, but the level of warming and the location was dependent on the GCM and RCP. Similarly, regionally aver- aged values of all 17 GCMs project an increase in annual precipitation for the Asian continent, but there are significant regional differences in the amount of and location of increases and decreas- es. These are in part due to the differing circula- tion patterns present in the various GCMs.
We selected the two GCMs under two RCPs to identify the regional differences from the four cli- mate projections (Figures 3 and 4). Some regions show opposite climate trends from each climate projection by 2070. We conclude that reliance on a single specific GCM is risky for estimating cli- mate change for a certain region in that it is not easy for climate models to predict the future with acceptable levels of accuracy and precision (Millar et al. 2007). In this study, we found that the regions at higher latitudes are at greater risk from increasing temperature, and that the increasing temperature in Western Asia would be higher compared to more easterly regions at the same latitude from the two GCMs bracket most of the future climate conditions of the Asia continent.
Model agreement is lower for precipitation, but the regions in the West Asia would experience a decrease in precipitation, under the four climate projections we used to bracket future conditions.
For South Korea, the range of increased mini- mum temperature from the four GCM/RCP com- binations was lower than the range of tempera-
tures predicted for East Asia or Asia (Figure 2).
The range of precipitation change for South Korea was greater than the range for the larger regions. Some GCMs projected an increase amount of precipitation in South Korea that was higher than the highest projected precipitation values for Asia as a whole. One GCM under each emission scenario projects a decrease in precipita- tion for South Korea, while all GCMs predict an increase in precipitation over Asia as a whole.
The GCM developed from Korean Meteorological Administration using HadGEM2- AO projected increasing temperature of +2.4 ˚C and +3.4 ˚C from the RCP 4.5 and RCP 8.5, and increasing precipitation of: +10.5% and +15.5%, respectively, for Korean Peninsula by 2070.
Compared to our results for South Korea, these amounts fall between the range of the 17 GCMs, but are closer to the optimistic values.
We suggest climate change studies in South Korea should assess the range of future climate conditions projected (e.g. Thorne et al. 2015), and not to stick to a single model’s outputs to prepare adaptation strategies. Climate change impacts under different GCMs represent a range of future possible conditions and we should therefore pre- pare for a range of possibilities under the uncer- tainty of climate change using a scenario-based approach to represent the range of possible cli- matic futures. For example, in our former study, Aconitum austrokoreense, which is an endangered species in South Korea, was projected to decrease and move northwards by 2050. The extent of suitable areas in 2050 was larger by 2.8 times under the NorESM1-M (warmer GCM) than under the HadGEM2-ES (hotter GCM). The suit- able areas spread in Gangwon and Jeolla provinces under the NorESM1-M, but mainly
spread in Gangwon province under the HadGEM2-ES.
Managing uncertainty will require various approaches including short-term and long-term strategies with flexibility, which include enhanc- ing ecosystem resistance and resilience as well as assisting ecosystems to adapt to future climate changes (Millar et al. 2007; Hallegatte 2009; Millar
& Stephenson 2015). To reduce the cost associated with various climate change adaptation studies, information on variability and on low-probability and/or high-consequence events is important for decision makers (Webster 2003). In this study, the GFDL and IN GCMs represent the range of mini- mum temperature of all three regions well, so we recommend Korean studies on climate change to use these two GCMs and to prepare for potential impacts from climate change. However, the range of precipitation change of the two GCMs we looked at in more detail for South Korea does not correspond with the variations for East Asia or Asia. To prepare for the uncertainties of precipita- tion for South Korea, using additional GCMs including ACCESS1-0, BCC-CSM1-1, and MIROC-ESM-CHEM is recommended to capture the range of precipitation change.
Our simple approach to identify the ranges of future climate change can be applied to identify proper bracketing of projected futures. However, there are some challenges that this study does not address. Increasing extreme weather phenom- ena is an important aspect of climate change and can be a critical determinant of patterns of ecosystem structure and function (Butt et al.
2016). Further research is required to better understand climate change patterns because our study is only focusing on average projections of climate change.
Moreover, since we found that various GCMs project different trends depending on the region analyzed, identifying the range of climate change should be done respectively depending for a study region and identifying common climate-sta- ble and climate-risky areas across scales could be one of the climate assessment analyses.
Acknowledgements
This work was supported by Development of Economic Assessment Technique for Climate Change Impact and Adaptation Considering Uncertainties (Korea Ministry of Environment, Project No.2014001310010).
References
Araújo MB, New M. 2007. Ensemble forecasting of species distributions. Trends in Ecology
& Evolution. 22(1): 42-47.
Arnell NW, Brown S, Gosling SN, Gottschalk P, Hinkel J, Huntingford C, Lloyd-Hughes B, Lowe JA, Nicholls RJ, Osborn TJ, Osborne TM, Rose GA, Smith P, Wheeler TR, Zelazowski P. 2016. The impacts of climate change across the globe: A multi- sectoral assessment. Climatic Change. 134:
457-474.
Butt N, Possingham HP, De Los Rios C, Maggini R, Fuller RA, Maxwell SL, Watson JEM.
2016. Challenges in assessing the vulnerability of species to climate change to inform conservation actions. Biological Conservation. 199: 10-15.
Choe H. 2015. Biodiversity conservation planning for South Korea: Predicting plant biodiversity dynamics under climate change
and the impacts from forest conversion scenarios (Order No. 10036024). Available from Dissertations & Theses @ University of California; ProQuest Dissertations &
Theses A&I. (1774020368). Retrieved from http://gradworks.umi.com/10/03/
10036024.html
Choe H, Thorne JH, Hijmans R, Kim J, Kwon H, Seo C. 2017. Meta-corridor solutions for climate-vulnerable plant species groups in South Korea. Journal of Applied Ecology. DOI: 10.1111/1365-2664.12865.
Elsen PR, Tingley MW. 2015. Global mountain topography and the fate of montane species under climate change. Nature Clim Change. 5: 772-776.
ENES. 2016. CMIP5 Models and Grid Resolution. Available: https://verc.enes.org/
data/enes-model-data/cmip5/resolution.
Last accessed, December 6, 2016.
Giorgi F, Torma C, Coppola E, Ban N, Schar C, Somot S. 2016. Enhanced summer convective rainfall at alpine high elevations in response to climate warming. Nature Geoscience. doi:10.1038/ngeo2761
Hallegatte S. 2009. Strategies to adapt to an uncertain climate change. Global Environmental Change. 19: 240-247.
Hartmann DL, Klein Tank AMG, Rusticucci M, Alexander LV, Brönnimann S, Charabi Y, Dentener FJ, Dlugokencky EJ, Easterling DR, Kaplan A, Soden BJ, Thorne PW, Wild M, Zhai PM. 2013. Observations:
Atmosphere and Surface. In: Climate Change 2013: The Physical Science Basis.
Contribution of Working Group I to the Fifth Assessment Report of the Intergovernmental Panel on Climate Change [Stocker TF, Qin D, Plattner GK,
Tignor M, Allen SK, Boschung J, Nauels A, Xia Y, Bex V, Midgley PM (eds.)].
Cambridge University Press, Cambridge, United Kingdom and New York, NY, USA.
Hijmans RJ, Cameron SE, Parra JL, Jones PG, Jarvis A. 2005. Very high resolution interpolated climate surfaces for global land areas. International Journal of Climatology. 25: 1965-1978.
Keppel G, Van Niel KP, Wardell-Johnson GW, Yates CJ, Byrne M, Mucina L, Schut AGT, Hopper SD, Franklin SE. 2012.
Refugia: Identifying and understanding safe havens for biodiversity under climate change. Global Ecology and Biogeography.
21: 393-404.
Kim HG, Lee DK, Jung H, Kil SH, Park JH, Park C, Tanaka R, Seo C, Kim H, Kong W, Oh K, Choi J, Oh YJ, Hwang G, Song CK. 2016. Finding key vulnerable areas by a climate change vulnerability assessment. Natural Hazards. 81: 1683- 1732.
Kim KH, Cho J. 2016. Predicting potential epidemics of rice diseases in Korea using multi-model ensembles for assessment of climate change impacts with uncertainty information. Climatic Change. 134: 327- 339.
Kim SY, Park C, Park JH, Lee DK. 2015.
Estimating Effects of Climate Change on Ski Industry - The Case of Ski Resorts in South Korea -. J. Environ. Impact Assess.
24(5): 432-443. [Korean Literature]
KMA. 2012. Climate Change Outlook Report on the Korean Peninsula (한반도 기후변화 전 망 보 고 서 ). Korea Meteorological Administration. No. 11-1360000-000861-
01. [Korean Literature]
Lee SA, Lee SH, Ji SY, Choi JY. 2016. Predicting change of suitable plantation of Schisandra chinensis with ensemble of climate change scenario. J. Environ. Impact Assess. 25(1):
77-87. [Korean Literature]
Millar CI, Stephenson NL. 2015. Temperate forest health in an era of emerging megadisturbance. Science. 349: 823-826.
Millar CI, Stephenson NL, Stephens SL. 2007.
Climate change and forests of the future:
Managing in the face of uncertainty.
Ecological Applications. 17(8): 2145-2151.
Murphy JM, Sexton DMH, Barnett DN, Jones GS, Webb MJ, Collins M, Stainforth DA.
2004. Quantification of modelling uncertainties in a large ensemble of climate change simulations. Nature. 430: 768-772.
Park HC, Lee JH, Lee GG. 2014. Predicting the suitable habitat of the Pinus pumila under climate change. J. Environ. Impact Assess.
23(5): 379-392. [Korean Literature]
Park HC, Lee JH, Lee GG, Um GJ. 2015.
Environmental features of the distribution areas and climate sensitivity assesment of korean fir and khinghan fir. J. Environ.
Impact Assess. 24(3): 260-277. [Korean Literature]
Prieto-Torres DA, Navarro-Sigüenza AG, Santiago- Alarcon D, Rojas-Soto OR. 2016.
Response of the endangered tropical dry forests to climate change and the role of mexican protected areas for their conservation. Global Change Biology. 22:
364-379.
Riahi K, Rao S, Krey V, Cho C, Chirkov V, Fischer G, Kindermann G, Nakicenovic N, Rafaj P. 2011. RCP 8.5-a scenario of comparatively high greenhouse gas
emissions. Climatic Change. 109: 33-57.
Sanderson BM, Oleson KW, Strand WG, Lehner F, O’Neill BC. 2015. A new ensemble of gcm simulations to assess avoided impacts in a climate mitigation scenario. Climatic Change. DOI 10.1007/s10584-015-1567-z.
SCENIC. 2014. Primer on climate data and global climate models. Southwest Climate and Environmental Information Collaborative.
Shin YH, Jung HC. 2015. Assessing uncertainty in future climate change in Northeast Asia using multiple CMIP5 GCMs with four RCP scenarios. J. Environ. Impact Assess.
24(3): 205-216. [Korean Literature]
Taylor KE, Stouffer RJ, Meehl GA. 2012. An overview of cmip5 and the experiment design. Bulletin of the American Meteorological Society. 93: 485-498.
Tebaldi C, Knutti R. 2007. The use of the multi- model ensemble in probabilistic climate projections. Philosophical Transactions of the Royal Society A: Mathematical, Physical and Engineering Sciences. 365:
2053-2075.
Thomson AM, Calvin KV, Smith SJ, Kyle GP, Volke A, Patel P, Delgado-Arias S, Bond- Lamberty B, Wise MA, Clarke LE, Edmonds JA. 2011. Rcp4.5: A pathway for stabilization of radiative forcing by 2100. Climatic Change. 109: 77-94.
Thorne JH, Boynton RM, Flint LE, Flint AL.
2015. The magnitude and spatial patterns of historical and future hydrologic change in california’s watersheds. Ecosphere.
6(2):24. http://dx.doi.org/10.1890/ES14- 00300.1.
van Vuuren D, Edmonds JA, Kainuma M, Riahi K, Thomson AM, Hibbard KA, Hurtt G, Kram T, Krey V, Lamarque J-F, Masui T,
Meinhausen M, Nakicenovic N, Smith SJ, Rose SK. 2011. The representative concentration pathways: An overview.
Climatic Change. 109: 5-31.
Webster M. 2003. Communicating climate change
uncertainty to policy-makers and the public. Climatic Change. 61: 1-8.
Wheeler HY. 2015. Asia. Available: http://www.
naturalhistoryonthenet.com/Continents/asia.
htm. Last accessed, November 27, 2016.
Figure 1. The location and the countries of the Asian continent and of six East Asia countries. Maps throughout this article were created using ArcGIS® software and “World Countries” dataset by Esri. For more information about the dataset, please visit www.arcgis.com.
Table 1. The GCMs used in this study and the differences in annual minimum temperature (˚C) and annual precipitation (mm) between historical data (representative of 1960-1990) and 2070 projections (average for 2061-2080) under RCP 4.5 and RCP 8.5 (pr means precipitation, tn means minimum temperature). For more information about the GCMs, please visit http://cmip-pcmdi.llnl.gov/.
Region Institute GCM Code RCP 4.5 RCP 8.5
pr.mean
(mm) pr.sd tn.mean(˚C) tn.sd pr.mean(mm) pr.sd tn.mean(˚C) tn.sd
continentAsia
CSIRO/
BOM ACCESS1-0 AC 60.53 83.28 3.87 0.9 79.79 134.15 5.6 1.32
BCC BCC-CSM1-1 BC 54.35 95.84 3.03 0.8 71.36 129.03 4.87 1.36
NCAR CCSM4 CC 44.84 63.42 3.11 0.98 68.19 112.81 4.88 1.49
CNRM/
CERFACS CNRM-CM5 CN 49.62 47.9 3.2 1.21 66.65 58.03 4.7 1.59
NOAA GFDL GFDL-CM3 GF 104.26 102.48 5.27 2.21 123.11 135.44 7.4 2.74 NASA GISS GISS-E2-R GS 45.04 81.66 2.46 0.44 66.51 112.51 3.39 0.59
NIMR/
KMA HadGEM2-AO HD 65.83 98.77 4.44 1.28 81.46 169.98 5.75 1.6
MOHC HadGEM2-ES HE 69.47 90.33 4.46 1.49 103.92 190.22 6.58 1.98
MOHC HadGEM2-CC HG 67.44 111.48 4.15 1.38 126.2 252.98 6.5 2.04
INM INMCM4 IN 32.43 56.26 2.08 0.62 55.67 84.9 3.89 1.25
IPSL IPSL-CM5A-LR IP 59.07 114.52 3.85 0.85 80.25 170.89 6.16 1.31
MIROC MIROC5 MC 77.14 117.67 3.17 0.93 99.12 133.74 4.93 1.66
MRI MRI-CGCM3 MG 55.53 80.5 2.58 0.7 113.97 202.23 4.33 1.04
MIROC MIROC-ESM-
CHEM MI 72.57 113.17 4.64 1.66 99.95 141.74 6.86 2.24
MPI-M MPI-ESM-LR MP 37.6 106.62 3.18 0.81 57.5 150.28 5 1.16
MIROC MIROC-ESM MR 61.57 100.64 4.92 1.68 88.58 140.61 6.86 2.24
NCC NorESM1-M NO 55.12 83.94 3.48 1.24 74.27 121.25 5.14 1.65
countriesSix NOAA GFDL GFDL-CM3 GF 125.72 74.50 6.12 2.24 156.77 103.15 8.50 2.70
INM INMCM4 IN 28.85 26.86 2.29 0.54 53.54 33.84 4.36 1.17
South
Korea NOAA GFDL GFDL-CM3 GF 152.61 127.48 3.62 0.11 308.80 118.80 5.22 0.16
INM INMCM4 IN 31.27 26.14 1.33 0.20 -42.39 48.48 2.33 0.32
Figure 2. The difference between historical and projected future climate conditions for three spatial domains under the RCP 4.5 (left) and the RCP 8.5 (right) emissions scenarios, and using 17 CMIP5 GCM projections. The origin of the axes represents mean conditions for the 1960-1990 timeframe, used as the baseline. The x axis refers to changes in annul minimum temperature (˚C), and the y axis to changes in annual precipitation (mm). The gray lines extending from the GCM dots represent spatial standard deviations.
Figure 4. The Change of annual precipitation (mm) by 2070 (average of 2061-2080) from historical data (representative of 1960- 1990).
Figure 3. The Change of annual minimum temperature (˚C) by 2070 (average of 2061-2080) from historical data (representative of 1960-1990).