pISSN 1976-1457 eISSN 2005-6168
A study on the trend analysis regarding the rice consumption of Korean adults using Korean National Health and Nutrition Examination Survey data from 1998, 2001 and 2005
Ho-Myoung Cha
1, Gyusang Han
2and Hea-Jung Chung
1§1Creative Culinary Institute of Korea, 303 Cheonjam-ro, Wansan-gu, Jeonju 560-759, Korea
2Department of Global Korean Culinary Arts, Woosong University, Daejeon 300-718, Korea
Abstract
The objective of this study was to provide information regarding trends of rice consumption of Korean adults based on different meal types.
Respondent reports 24-hour recall data from the Korean National Health and Nutrition Examination Survey were used to assess daily rice consumption and intake ratios of rice for different meal types and places of preparation. Rice intake had gradually decreased from 224.6 g in 1998 to 190 g in 2001 and to 179.4 g in 2005. The rice consumption of Korean adults decreased every year in all ages for all places of meal preparation in 2001 and 2005 compare to 1998. Analysis for each meal type showed that rice intake at breakfast had not considerably changed, but rice intake had decreased at lunch and dinner. While the rice consumption ratio at lunch and dinner decreased, it also decreased or did not change at snack times except for the 19-29 age groups. All the age groups revealed comparable change in the analysis for meal types. There was some diversity between all age divisions in daily rice intake depending on place of meal preparation. The rice consumption by place of meal preparation was generally highest at home, lowest at other places, but it decreased in all places. The rice consumption at home was highest in the over 50 age group, lowest in the 20-30 age group. These changes seem to be related to food intake patterns of rice and substitutional foods in the diets and development regarding socio-economic status. So the need for further study on differences in rice intake based on socioeconomic levels and age group are indicated.
Key Words: Rice, consumption, adults, Korea, KNHANES
Introduction
11)Rice is a major crop used by two thirds of the world’s population as their staple food. It is drawing attention recently as a food with considerable impact on people’s health, and is usually consumed as brown rice or polished rice depending on the degree of milling [1]. Brown rice is spotlighted as a health food containing a large variety of nutrients, dietary fiber, minerals and vitamins and its consumption is reported to be increasing every year [2]. According to previous studies on Americans’
consumption of grain, the intake of grain has increased steadily since the 1970s [3]. It was reported that those who kept taking a regular meal of whole grain maintained a normal weight and exhibited lower prevalence of adult diseases compared to those who did not [4,5]. On the other hand, those eating rice preferred foods such as grains, vegetables, poultry and fish, so they were supplied with more diverse nutrients from healthy menus than those who preferred meat [6]. In a study on American people’s grain consumption, the intake of rice was found to have an effect
on preventing adult diseases [7], and another study on the effect of rice intake on mental health and immunity among Japanese, comparing before and after rice intakes, found that rice intake improved mental health and immunity [8]. For these reasons, the intake of rice and vegetables is increasing in Americans’
menus [6]. People in developed Western countries get carbohy- drates mainly from grain foods such as bread, snacks and noodles.
And the consumption of wheat is greater than that of other grains, though the intake of cereal and processed rice foods has been increasing since the 1990s. It is reported moreover, that rice enriched with thiamin, riboflavin, iron, B vitamins, niacin, etc.
is being consumed in the U.S. to supplement the shortage of nutrients in polished rice or processed cereal [9]. In Asian countries where rice is consumed as a staple food however, gradually we see that rice intake is decreasing while meat intake is increasing due to changing menus as a result of Westernization.
Particularly in Korea the intakes of wheat and meat per person have increased by 2 and 1.5 times respectively during the period from the 1990s to the present but rice intake has decreased every
This paper was funded by National Institute of Crop Science Rural Development Administration (the number of agreement; PJ08309012).
§Corresponding Author: Hea-Jung Chung, Tel. 82-63-220-2098, Fax. 82-63-220-2475, Email. [email protected] Received: March 5, 2012, Revised: June 10, 2012, Accepted: June 10, 2012
ⓒ2012 The Korean Nutrition Society and the Korean Society of Community Nutrition
This is an Open Access article distributed under the terms of the Creative Commons Attribution Non-Commercial License (http://creativecommons.org/licenses/by-nc/3.0/) which permits unrestricted non-commercial use, distribution, and reproduction in any medium, provided the original work is properly cited.
year during the period from 1998 to 2005 [10]. What is more, the meal skipping rate in Korea, which was heightened by the economic crisis starting in 1997, is believed to have contributed to the decrease in rice intake in the early 1990s, but even after the recovery of the economic situation rice intake has continued to decrease [11-13].
Previous studies reported that rice is a crucial food for maintaining health and preventing adult diseases. Whether to eat rice or not, and the quantity of rice intake are recognized as important factors related to the incidence of various diseases.
For these reasons, many countries have conducted studies on the effects and intake of rice as well as on rice consumption. In Korea however, although rice is consumed as staple food, few studies have been conducted on rice consumption. Thus, this study purposed to analyze trends in Korean adults’ rice intake using data from KNHANES (1998-2005) and to provide basic data usable in food-related areas and the food service industry.
Subjects and Methods
Subjects
This study was conducted using the research methods of Lee and Kim [14], who studied Korean people’s vegetable intake, and the specific research methodology is as follows. This study analyzed 28,660 Koreans between the ages of 19 and 65 who participated in the dietary lifestyle survey and 24- hour dietary recall method during 1998, 2001 and 2005 KNHANES (Korean National Health and Nutrition Examination Survey) subjects. This study regarding rice consumption of Korean adults analyzed the trend of annual per capita consumption of rice intake according to meal type (breakfast, lunch, dinner and snack) and serving place(home, institution, restaurant and other place). Foods were coded and analyzed using a five- digit food coding scheme developed according to the Korean Ministry of Health and Welfare in 1998, 2001 and 2005 for KNHANES. Food items were categorized by food group and subgroup. Items falling under the category of rice were further characterized as polished rice, unpolished rice and sticky rice.
In addition, rice was consumed by a significant portion of the Korean adult population from 1998~2005. Comparison of the amount of rice consumption per day included a 24h recall scenario sampling of 28,660 from the KNHNES during 1998~
2005. Weighted percentages and mean values show rice and other food intake amounts. Total gender, age, household income and region are directly related to rice consumption in Korean adults. All statistical analyses were performed with PASW Statistics ver. 18.0 and SUDAAN ver. 10.01(SUDAAN, Research Triangle Institute, Research Triangle Park, NC, USA) by Chi- square test, Bonferroni’s multiple t-test.
Results
General characteristics of study subjects
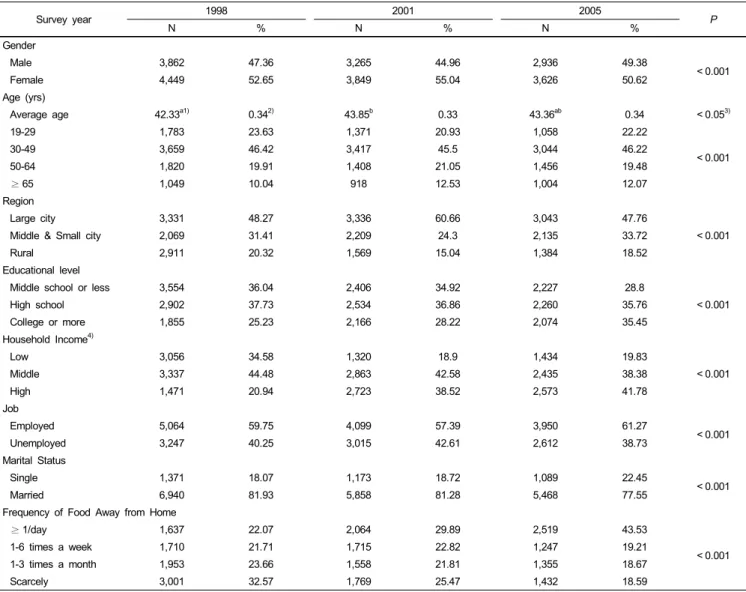
Under this study, the data of adults 19 years and older who responded to the food intake frequency survey (12 years old and older) and the food intake survey (survey of 24-hour recall method for each individual) of the national health and nutrition surveys (1998-2005) was facilitated to implement cross analysis for 3 years following gender, age, education level, occupation, income, residence, marital status and eating-out frequency.
Looking into the general information of adults, under the gender of (Table 1), men had 3,362 persons in 1998, 3,265 persons in 2001, and 2,946 persons in 2005 that 2005 had the most. In the case of women, there were 3,849 persons in 2001 which was more than 1998 and 2005, and the ratio showed a higher rate for women than men (P < 0.001). For the age group
‘30-49 years old’ in 1998 had 46.4%, 2001 for 45.5%, and 2005 for 46.2% to show the highest, and 65 years old or more had the lowest ratio (P < 0.001). For regions, the highest number of respondents was from ‘metropolitan’ areas and the least was from
‘rural’ areas. The residents in ‘metropolitan’ areas in 1998 was 48.3% which increased in 2001 by 12.3%, and eventually fell in 2005 by 0.5% (P < 0.001). The number of respondents in the
‘middle & small cities’, compared between 1998 and 2001, showed a decrease of 7.1% and increase of 2.3% between 2001 and 2005. Respondents in ‘rural’ regions, showed a decrease from 20.3% in 1998 to 5.3% and 1.8% in 2001 and 2005, respectively, to display noticeable result (P < 0.001).
Looking into education level, a ‘person with high school education’ was the most common respondent in 2001 and 2005, excluding 1998, and a person with college or higher education was the least common respondent on all 3 occasions. For household income, the ‘low income class’ in 1998 was 34.6%
and it decreased by 2001 to 15.7% and in 2005 it fell to 14.8%
(P < 0.001). The ‘middle class’, accounted for 44.5% in 1998 and declined by 1.9% in 2001 and 6.1% in 2005 to display a noticeable result (P < 0.001). In the ‘high income class’, data showed a difference from 1998 to decline in 2001 to 17.6% and 2005 for 20.8% (P < 0.001). For occupation, all 3 years had more
‘employed’ than ‘unemployed’, and both ‘employed’ and ‘unem- ployed’ had shown a noticeable result in 2001 and 2005 com- pared to 1998 (P < 0.001). The ‘employed’ group declined in 2001 by 2.4% compared to 1998, but it increased in 2005 by 1.5%
(P < 0.001), and in the event of the ‘unemployed’, it increased by 2.4% in 2001 from 40.3% of 1998, but then decreased by 1.5% in 2006 (P < 0.001). Looking into the marital status, all 3 years showed ‘married’ with an 80% higher rate than ‘unmarried’
and both ‘married’ and ‘unmarried’ displayed a noticeable result for 3 years (P < 0.001). The ‘unmarried’ group were 18.1% in 1998 which increased in 2001 by 0.7% and 20005 by 2.4% (P
< 0.001). But in the event of ‘married’, compared to 1998, it
declined in 2001 by 0.7% and in 2005 by 4.4% (P < 0.001).
Survey year 1998 2001 2005
N % N % N % P
Gender
Male 3,862 47.36 3,265 44.96 2,936 49.38
< 0.001
Female 4,449 52.65 3,849 55.04 3,626 50.62
Age (yrs)
Average age 42.33a1) 0.342) 43.85b 0.33 43.36ab 0.34 < 0.053)
19-29 1,783 23.63 1,371 20.93 1,058 22.22
< 0.001
30-49 3,659 46.42 3,417 45.5 3,044 46.22
50-64 1,820 19.91 1,408 21.05 1,456 19.48
≥ 65 1,049 10.04 918 12.53 1,004 12.07
Region
Large city 3,331 48.27 3,336 60.66 3,043 47.76
< 0.001
Middle & Small city 2,069 31.41 2,209 24.3 2,135 33.72
Rural 2,911 20.32 1,569 15.04 1,384 18.52
Educational level
Middle school or less 3,554 36.04 2,406 34.92 2,227 28.8
< 0.001
High school 2,902 37.73 2,534 36.86 2,260 35.76
College or more 1,855 25.23 2,166 28.22 2,074 35.45
Household Income4)
Low 3,056 34.58 1,320 18.9 1,434 19.83
< 0.001
Middle 3,337 44.48 2,863 42.58 2,435 38.38
High 1,471 20.94 2,723 38.52 2,573 41.78
Job
Employed 5,064 59.75 4,099 57.39 3,950 61.27
< 0.001
Unemployed 3,247 40.25 3,015 42.61 2,612 38.73
Marital Status
Single 1,371 18.07 1,173 18.72 1,089 22.45
< 0.001
Married 6,940 81.93 5,858 81.28 5,468 77.55
Frequency of Food Away from Home
≥ 1/day 1,637 22.07 2,064 29.89 2,519 43.53
< 0.001
1-6 times a week 1,710 21.71 1,715 22.82 1,247 19.21
1-3 times a month 1,953 23.66 1,558 21.81 1,355 18.67
Scarcely 3,001 32.57 1,769 25.47 1,432 18.59
1)Mean, 2)Standard Error, 3)P-value by bonferroni’s multiple t-test
4)Low income: monthly income < minimum cost of living × 1.2; Middle income: minimum cost of living × 1.2 ≤ monthly income < minimum cost of living × 2.5; High income:
monthly income ≥ minimum cost of living × 2.5
Different superscript letters mean significantly different between groups at α = 0.05 level by bonferroni’s t-test.
Table 1. General subject characteristics
Rice intake amount of Korean adults
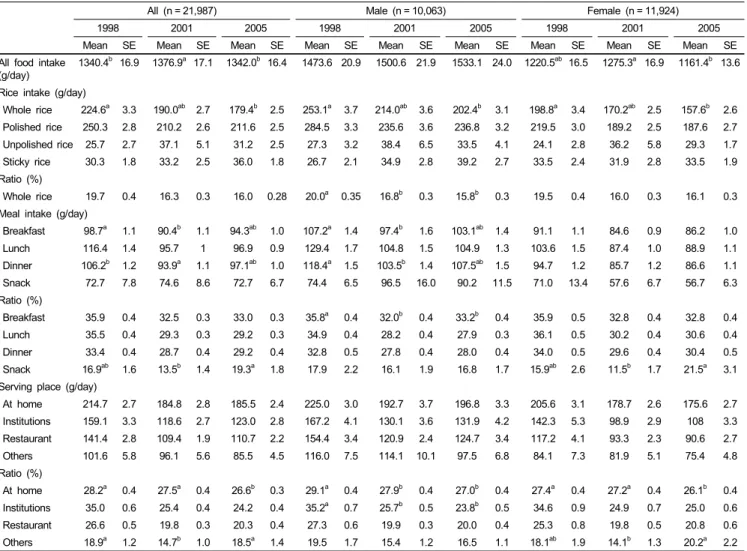
The rice intake amount of all Korean adults is shown as in (Table 2, Fig. 1). The Whole rice intake amount in 1998 was 224.6 g and it declined in 2001 and 2005 to 190 g and 179.4 g, respectively (P < 0.05). For the rice intake category of adult men and women, the whole rice intake amount showed a decrease from in 1998 to in 2001 and 2005 (P < 0.05. The intake amount of ‘polished rice’ was declined in 2001 for and 2005 from in 1998. In the event of ‘unpolished rice’ and ‘sticky rice’, the survey showed an increasing trend in 2001 and 2005 compared to 1998. And, regarding the rice intake amount of adult men and women the intake measurements of ‘polished rice’ was shown to decline in 1998 to in 2001 and 2005 (Fig. 2).
The rice intake amount for each meal showed a decrease in 2001 and 2005 compared to 1998 for ‘breakfast’, ‘lunch’ and
‘dinner’, and the place of meal preparation had a declining trend for ‘home’, ‘institution’, ‘restaurant’, and ‘other places’. In the case of rice consumption at each meal, breakfast, lunch, and dinner a decline was seen in 2001 and 2005 compared to 1998, but in the event of snacks, it increased beginning in 1998. And, in the case of the rice intake amount of each place, home,
‘institution’, ‘restaurant’, and ‘other places’ showed a decline in 2001 and 2005 compared to 1998.
For the rice intake amount of each meal, each meal showed
a steady decline in 2001 and 2005 compared to 1998, and for
the rice intake category for each place for the meal, it displayed
a declining trend in all places.
All (n = 21,987) Male (n = 10,063) Female (n = 11,924)
1998 2001 2005 1998 2001 2005 1998 2001 2005
Mean SE Mean SE Mean SE Mean SE Mean SE Mean SE Mean SE Mean SE Mean SE
All food intake (g/day)
1340.4b 16.9 1376.9a 17.1 1342.0b 16.4 1473.6 20.9 1500.6 21.9 1533.1 24.0 1220.5ab 16.5 1275.3a 16.9 1161.4b 13.6
Rice intake (g/day)
Whole rice 224.6a 3.3 190.0ab 2.7 179.4b 2.5 253.1a 3.7 214.0ab 3.6 202.4b 3.1 198.8a 3.4 170.2ab 2.5 157.6b 2.6 Polished rice 250.3 2.8 210.2 2.6 211.6 2.5 284.5 3.3 235.6 3.6 236.8 3.2 219.5 3.0 189.2 2.5 187.6 2.7
Unpolished rice 25.7 2.7 37.1 5.1 31.2 2.5 27.3 3.2 38.4 6.5 33.5 4.1 24.1 2.8 36.2 5.8 29.3 1.7
Sticky rice 30.3 1.8 33.2 2.5 36.0 1.8 26.7 2.1 34.9 2.8 39.2 2.7 33.5 2.4 31.9 2.8 33.5 1.9
Ratio (%)
Whole rice 19.7 0.4 16.3 0.3 16.0 0.28 20.0a 0.35 16.8b 0.3 15.8b 0.3 19.5 0.4 16.0 0.3 16.1 0.3
Meal intake (g/day)
Breakfast 98.7a 1.1 90.4b 1.1 94.3ab 1.0 107.2a 1.4 97.4b 1.6 103.1ab 1.4 91.1 1.1 84.6 0.9 86.2 1.0
Lunch 116.4 1.4 95.7 1 96.9 0.9 129.4 1.7 104.8 1.5 104.9 1.3 103.6 1.5 87.4 1.0 88.9 1.1
Dinner 106.2b 1.2 93.9a 1.1 97.1ab 1.0 118.4a 1.5 103.5b 1.4 107.5ab 1.5 94.7 1.2 85.7 1.2 86.6 1.1
Snack 72.7 7.8 74.6 8.6 72.7 6.7 74.4 6.5 96.5 16.0 90.2 11.5 71.0 13.4 57.6 6.7 56.7 6.3
Ratio (%)
Breakfast 35.9 0.4 32.5 0.3 33.0 0.3 35.8a 0.4 32.0b 0.4 33.2b 0.4 35.9 0.5 32.8 0.4 32.8 0.4
Lunch 35.5 0.4 29.3 0.3 29.2 0.3 34.9 0.4 28.2 0.4 27.9 0.3 36.1 0.5 30.2 0.4 30.6 0.4
Dinner 33.4 0.4 28.7 0.4 29.2 0.4 32.8 0.5 27.8 0.4 28.0 0.4 34.0 0.5 29.6 0.4 30.4 0.5
Snack 16.9ab 1.6 13.5b 1.4 19.3a 1.8 17.9 2.2 16.1 1.9 16.8 1.7 15.9ab 2.6 11.5b 1.7 21.5a 3.1 Serving place (g/day)
At home 214.7 2.7 184.8 2.8 185.5 2.4 225.0 3.0 192.7 3.7 196.8 3.3 205.6 3.1 178.7 2.6 175.6 2.7
Institutions 159.1 3.3 118.6 2.7 123.0 2.8 167.2 4.1 130.1 3.6 131.9 4.2 142.3 5.3 98.9 2.9 108 3.3
Restaurant 141.4 2.8 109.4 1.9 110.7 2.2 154.4 3.4 120.9 2.4 124.7 3.4 117.2 4.1 93.3 2.3 90.6 2.7
Others 101.6 5.8 96.1 5.6 85.5 4.5 116.0 7.5 114.1 10.1 97.5 6.8 84.1 7.3 81.9 5.1 75.4 4.8
Ratio (%)
At home 28.2a 0.4 27.5a 0.4 26.6b 0.3 29.1a 0.4 27.9b 0.4 27.0b 0.4 27.4a 0.4 27.2a 0.4 26.1b 0.4
Institutions 35.0 0.6 25.4 0.4 24.2 0.4 35.2a 0.7 25.7b 0.5 23.8b 0.5 34.6 0.9 24.9 0.7 25.0 0.6
Restaurant 26.6 0.5 19.8 0.3 20.3 0.4 27.3 0.6 19.9 0.3 20.0 0.4 25.3 0.8 19.8 0.5 20.8 0.6
Others 18.9a 1.2 14.7b 1.0 18.5a 1.4 19.5 1.7 15.4 1.2 16.5 1.1 18.1ab 1.9 14.1b 1.3 20.2a 2.2 Different superscript letters mean significantly different between groups at α = 0.05 level by bonferroni’s t-test
Table 2. Comparison of Rice intake amount in 1998, 2001 and 2005 according to meal format by gender
Fig. 1. Comparison of Rice intake amount in 1998, 2001 and 2005 according to meal format by age (Whole rice)
Fig. 2. Comparison of Rice intake amount in 1998, 2001 and 2005 according to meal format by age(Polished rice)
A analysis of rice intake amount for each adult age
The results of analyzing the rice intake amount trend for each age are shown on (Table 3, 4, Fig. 1, 2) and the extrapolated whole rice intake amount and intake amount of ‘polished rice’
are analyzed from the data to have a declining trend of declining
in all age divisions.
Whole rice intake amount in the rice consumption category
of the ‘19-29 years old’, was 210.8 g in 1998 and showed a
steady decline in 2001 and 2005 to 174.1 g and 163.8 g,
respectively, and the consumption amount of ‘polished rice’ was
declined in 2001 and 2005 from beginning in 1998. The
19-29 (n = 4,212) 30-49 (n = 10,120)
1998 2001 2005 1998 2001 2005
Mean SE Mean SE Mean SE Mean SE Mean SE Mean SE
All food intake (g/day) 1,367.5 24.9 1,392.7 29.8 1,441.0 38.7 1,437.6ab 20.5 1,472.8a 21.6 1,414.0b 20.5 Rice intake (g/day)
Whole rice 210.8 4.5 174.1 4 163.8 3.8 223.2a 4.3 187.7ab 3.5 173.9b 2.9
Polished rice 230.6 4.4 186.9 4 194.2 4.5 253.6 3.7 209.4 3.5 207.2 3.1
Unpolished rice 18.4 2.6 43.6 13.1 24.2 2.6 24.6 2.9 34.6 6.9 32.1 2.8
Sticky rice 26.6 3.8 38.7 8.1 30.8 3.1 30.9ab 2.9 29.1b 2.3 35.1a 2.3
Ratio (%)
Whole rice 17.55a 0.4 14.5b 0.4 13.5b 0.4 17.9 0.4 14.7 0.3 14.2 0.3
Meal intake (g/day)
Breakfast 95.8 2.0 91.8 2.8 95.4 3.0 98.9a 1.4 89.8b 1.4 93.3ab 1.2
Lunch 119.3 2.4 99.0 2.2 100.6 2.3 120.1 2.0 96.5 1.4 97.1 1.3
Dinner 109.3a 2.3 95.9b 2.2 102.4ab 2.7 108.1 1.3 95.0 1.7 96.7 1.5
Snack 70.1 7.8 92.6 18.3 88.4 15.6 81.3 14.0 73.5 13.4 72.0 9.4
Ratio (%)
Breakfast 35.4 0.7 32.8 0.7 33.5 0.8 34.7 0.4 31.3 0.4 31.6 0.4
Lunch 34.1 0.6 27.8 0.5 26.6 0.6 33.9 0.4 27.5 0.4 27.5 0.3
Dinner 31.4 0.6 27.3 0.6 28.1 0.7 31.2 0.6 26.5 0.4 26.7 0.4
Snack 15.9 2.9 14.2 3.3 14.1 1.8 16.2ab 2.4 13.3b 2.0 20.2a 2.7
Serving place (g/day)
At home 185.7 4.4 155.5 4.4 159.6 4.9 210.6 3.3 174.2 3.5 172.4 2.8
Institutions 161.6 7.9 125.9 5.7 130.9 6.3 158.2 4.0 116.9 3.6 119.6 3.1
Restaurant 134.4 4.8 110.3 3.8 112.4 5.6 146.9 3.5 111.5 2.4 113.2 2.9
Others 106.7 9.9 94.0 11.2 88.6 10.0 101.4 7.6 99.3 10.1 86.3 5.7
Ratio (%)
At home 27.4 0.6 27.9 0.7 27.0 0.6 26.4a 0.4 25.8ab 0.4 24.8b 0.4
Institutions 34.7 0.9 25.7 0.8 24.2 0.9 34.8a 0.8 24.8b 0.5 23.4b 0.5
Restaurant 26.5 0.8 20.0 0.6 19.1 0.7 26.3 0.7 19.3 0.4 19.8 0.5
Others 16.5 1.6 14.0 2.1 16.2 2.0 19.5 1.7 15.1 1.4 17.5 1.2
Different superscript letters mean significantly different between groups at α = 0.05 level by bonferroni’s t-test Table 3. Comparison of Rice intake amount in 1998, 2001 and 2005 according to meal format by age (19-49)
consumption amount of ‘unpolished rice’ and ‘sticky rice’
showed an increasing trend in 2001 and 2005 compared to 1998.
On the consumption amount of rice for each meal, all meals had declined in 2001 and 2005 compared to 1998, but in the event of ‘snacks’, it was shown to increase compared to 1998.
Consumption of the least amount of rice was for ‘breakfast’ while lunch had the highest rice consumption.
For the rice intake consumption by place, ‘home’ was the place with the greatest consumption, followed by ‘institution’,
‘restaurant’, and ‘other places’, and all places had a declining trend in 2001 and 2005 compared to 1998. In the age group
‘19-29 years old’, the whole rice consumption amount and consumption amount of ‘polished rice’ was lowest for all age classes, while rice consumption amount continued to decline each age category
The whole rice consumption data of the ‘30-49’ age group in 1998 was 223.2 g and it declined to 187.7 g in 2001 and 173.9 g in 2005 (P < 0.05), and in the event of ‘polished rice’
it was 1998 but showed a noticeable result with a decline in 2001 and 2005 by in 1998. The consumption amount of
‘unpolished rice’ was shown to increase from 1998, and in the case of ‘sticky rice’, it declined in 2001 but increased in 2005.
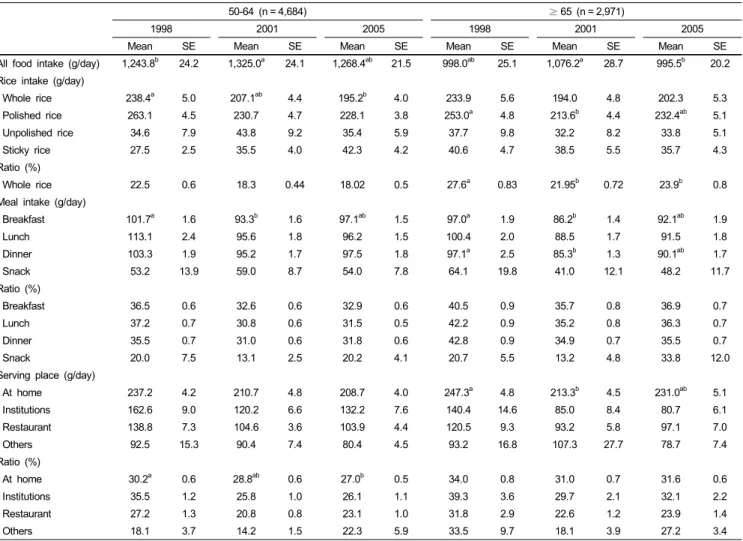
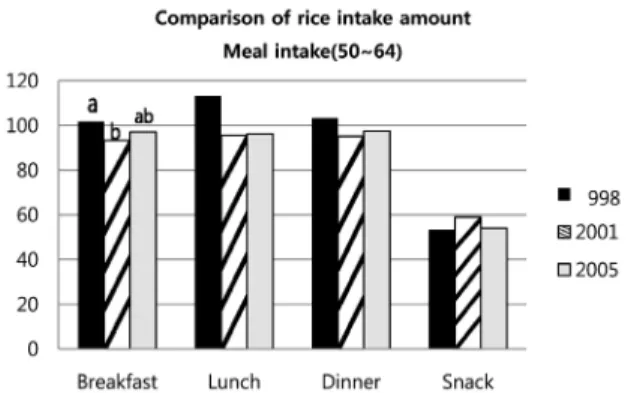
In the rice consumption data for each meal, ‘snack’ was shown to be the lowest consumption amount, and ‘lunch’ had the largest consumption amount, and in all meals 2001 and 2005 had a decrease compared to 1998 (Fig. 3). In the rice consumption data set for each place of meals, all places had a declining trend in 2001 and 2005 compared to 1998. ‘Home’ showed the most rice consumed and other places had the least consumption amount (Fig. 4). The age group of ‘30-49 years old’ consumed more rice than the age class of ‘19-29 years old’, and 2001 and 2005 showed a decreasing trend compared to 1998. The whole rice consumption amount of the age group ‘50-64’ in 1998 showed 238.4 g and in 2001 and fell to 207.1 g and in 2005 to 195.2 g with a declining trend each year (P < 0.05), and the consumption amount of ‘polished rice’ was reduced in 2001 and 2005 by 1998. The consumption data of ‘unpolished rice’
comparing 1998 to 2001 showed an increase of 9.2%, but in
2005 it did not show any noticeable change. In the rice
consumption data for each meal, ‘lunch’ had the highest rice
50-64 (n = 4,684) ≥ 65 (n = 2,971)
1998 2001 2005 1998 2001 2005
Mean SE Mean SE Mean SE Mean SE Mean SE Mean SE
All food intake (g/day) 1,243.8b 24.2 1,325.0a 24.1 1,268.4ab 21.5 998.0ab 25.1 1,076.2a 28.7 995.5b 20.2 Rice intake (g/day)
Whole rice 238.4a 5.0 207.1ab 4.4 195.2b 4.0 233.9 5.6 194.0 4.8 202.3 5.3
Polished rice 263.1 4.5 230.7 4.7 228.1 3.8 253.0a 4.8 213.6b 4.4 232.4ab 5.1
Unpolished rice 34.6 7.9 43.8 9.2 35.4 5.9 37.7 9.8 32.2 8.2 33.8 5.1
Sticky rice 27.5 2.5 35.5 4.0 42.3 4.2 40.6 4.7 38.5 5.5 35.7 4.3
Ratio (%)
Whole rice 22.5 0.6 18.3 0.44 18.02 0.5 27.6a 0.83 21.95b 0.72 23.9b 0.8
Meal intake (g/day)
Breakfast 101.7a 1.6 93.3b 1.6 97.1ab 1.5 97.0a 1.9 86.2b 1.4 92.1ab 1.9
Lunch 113.1 2.4 95.6 1.8 96.2 1.5 100.4 2.0 88.5 1.7 91.5 1.8
Dinner 103.3 1.9 95.2 1.7 97.5 1.8 97.1a 2.5 85.3b 1.3 90.1ab 1.7
Snack 53.2 13.9 59.0 8.7 54.0 7.8 64.1 19.8 41.0 12.1 48.2 11.7
Ratio (%)
Breakfast 36.5 0.6 32.6 0.6 32.9 0.6 40.5 0.9 35.7 0.8 36.9 0.7
Lunch 37.2 0.7 30.8 0.6 31.5 0.5 42.2 0.9 35.2 0.8 36.3 0.7
Dinner 35.5 0.7 31.0 0.6 31.8 0.6 42.8 0.9 34.9 0.7 35.5 0.7
Snack 20.0 7.5 13.1 2.5 20.2 4.1 20.7 5.5 13.2 4.8 33.8 12.0
Serving place (g/day)
At home 237.2 4.2 210.7 4.8 208.7 4.0 247.3a 4.8 213.3b 4.5 231.0ab 5.1
Institutions 162.6 9.0 120.2 6.6 132.2 7.6 140.4 14.6 85.0 8.4 80.7 6.1
Restaurant 138.8 7.3 104.6 3.6 103.9 4.4 120.5 9.3 93.2 5.8 97.1 7.0
Others 92.5 15.3 90.4 7.4 80.4 4.5 93.2 16.8 107.3 27.7 78.7 7.4
Ratio (%)
At home 30.2a 0.6 28.8ab 0.6 27.0b 0.5 34.0 0.8 31.0 0.7 31.6 0.6
Institutions 35.5 1.2 25.8 1.0 26.1 1.1 39.3 3.6 29.7 2.1 32.1 2.2
Restaurant 27.2 1.3 20.8 0.8 23.1 1.0 31.8 2.9 22.6 1.2 23.9 1.4
Others 18.1 3.7 14.2 1.5 22.3 5.9 33.5 9.7 18.1 3.9 27.2 3.4
Different superscript letters mean significantly different between groups at α = 0.05 level by bonferroni’s t-test.
Table 4. Comparison of Rice intake amount in 1998, 2001 and 2005 according to meal format by age (50 years and higher)
Fig. 3. Comparison of Rice intake amount in 1998, 2001 and 2005 according to meal format(Meal intake: 30-49)
Fig. 4. Comparison of Rice intake amount in 1998, 2001 and 2005 according to meal format (Serving place : 30-49)
consumption, and ‘snack’ had the lowest rice consumption amount and in the case of the consumption amount for
‘breakfast’, different age class had more rice consumption than the amount of rice consumption in ‘breakfast’. For each meal, 2001 and 2005 showed a declining trend compared to 1998, but
in the event of ‘snack’, it was shown to increase (Fig. 5). In the rice consumption amount for each meal place, the rice consumption amount of ‘home’ was the highest and ‘other places’
was lowest, and in all places, 2001 and 2005 showed a declining
trend compared to 1998. The age group ‘50-64’ consumed the
Fig. 5. Comparison of Rice intake amount in 1998,2001 and 2005 according
to meal format by age (Meal intake: 50-64) Fig. 6. Comparison of Rice intake amount in 1998, 2001 and 2005 according to meal format (Serving place: 50-64)
Fig. 7. Comparison of Rice intake amount in 1998, 2001 and 2005 according
to meal format(Meal intake: ≥ 65) Fig. 8. Comparison of Rice intake amount in 1998, 2001 and 2005 according to meal format (Serving place: ≥ 65)
most rice, but like other age classes, the whole rice consumption amount was in a declining trend (Fig. 6).
Whole rice consumption data in the age group of ‘65 or older’
in 1998 was 233.9 g. This fell in 2001 to 194 g and in 2005 to 202.3 g, and the consumption amount of ‘polished rice’ in 1998 was 253 g, which fell in 2001, and 2005 (P < 0.05). Unlike the trend of reduction each year for the consumption amount of ‘polished rice’ of other age groups, the age group of ‘65 or older’ showed a higher consumption amount in 2005 than in 2001. The consumption amount of ‘unpolished rice’ and ‘sticky rice’ reduced in 2001 and 2005 compared to 1998, and it showed differences with other age groups. In the rice consumption data set for each meal, lunch meals consumed the most rice and
‘snacks’ had the lowest consumption overall, and all meals had a declining trend in 2001 and 2005 compared to 1998 (Fig. 7).
In the rice consumption amount for each place, the rice consumption amount at ‘home’ was the highest, and it was higher than the rice consumption amount at ‘home’ out of any other age group. The rice consumption amount of other places was the lowest, and it declined at ‘home’ and ‘institution’ in 2001 and 2005 compared to 1998. The rice intake amount at ‘other places’ increased by 14.9 g in 2001 compared to 1998, but in 2005, it was surveyed and decline by 14.5 g. The age group of ‘65 or older’ had the higher frequency of rice consumption at home compared to other age groups and the rice consumption
at ‘breakfast’ did not have much of a difference from the rice consumption amount of lunch and dinner, but the whole rice intake amount was shown to decline (Fig. 8).
Discussion
This study analyzed trends in Korean adults’ rice intake during the period from 1998 to 2005, and found that whole rice intake was decreasing every year. In the results of this study, rice intake was decreasing in similar patterns for both men and women, and similar decreasing trends were observed in each age category as well. What is more, rice was consumed more at lunch and dinner than in breakfast among the meals, and households consumed the largest amount of rice by place of meal preparation.
The decreasing trend in rice intake was similar between men and women and in all age groups, but the rate of rice intake at home was higher in older age groups. In the study on one-portion size foods frequently eaten by Korean adults as well, rice intake per person decreased every year and the one-portion size of rice taken by Koreans reached 80 g in 2005, showing a result similar to the decreasing rice consumption found in this study [15].
The results of this study showed that Korean people’s rice
intake had been decreasing every year since the late 1990s. This
Fig. 9. Trends of rice intake amount in Asian country
trend was also observed in other countries consuming rice as a staple food. According to a study that analyzed trends in annual rice intake per household in Jiangsu Province, China during the period from 1995 to 2007, rice consumption decreased steadily from 71.3 kg in 1995 to 56.2 kg in 2000 and 50.2 kg in 2007 [16]. With regard to trends in annual rice intake per person in other Asian countries using rice as a staple food, annual rice intake was found to have decreased from 65.1 kg in 1999 to 61.4 kg in Japan (data from MAFF: Ministry of Agriculture, Forestry and Fisheries in Japan), from 54.9 kg in 1999 to 48.6 kg in 2005 in Taiwan (data from Taiwan Food Balance Sheet), and from 96.9 kg in 1999 to 80.7 kg in 2005 in Korea (Fig.
9) [10].
Summing up these previous studies, Korea is still consuming a larger amount of rice than Japan and Taiwan, but the rate of decrease is higher than that in Japan and Taiwan. Considering the fast rate of decrease in rice intake in Korea compared to other Asian countries consuming rice as their staple food, it is necessary to enact campaigns and dietary life education programs to promote rice consumption. Different from Asian countries where rice intake is going down, Western regions like the U.S.
and Europe show an increasing trend in the intake of grains including rice as reported by several studies on the trends of rice intake. According to a study on Americans’ rice intake during the periods between 1994-1996 (data from CSFII) and between 2001-2002 (data from NHANES), the proportion of people taking rice over 1/4 cup a day (14.1 g in dry weight) increased from 17.4% in 1994-1996 to 18.2% in 2001-2002, and the proportion of those not eating rice decreased from 78.8%
to 77.3%, showing a general trend of increase in rice intake among the American population [6]. In a study on 10 years’
intake of foods and nutrients by Australians aged over 60, on the contrary, the intake of bread and cereal decreased from 239 g in 1992-1994 (baseline) to 229 g and 222 g, respectively, in 1997-1999 and 2002-2004 among men, and from 218 g in 1992-1994 to 212 g (1997-1999) and 209 g (2002-2004) among women, showing a decreasing trend in the consumption of bread and cereal among both men and women [17]. In the results of this study, rice consumption by restaurants went down from 141.4
g in 1998 to 109.4 g in 2001 and up to 110.7 g in 2005, but whole rice intake decreased compared to the baseline level in 1998. This was similar to the previous report that the consumption of rice, which had been used as the main nutrition source, decreased naturally as a result of the Westernization of restaurant menus in Asian countries, the diversification of foods replacing rice as the sole staple food, and the increasing frequency of dining-out [18,19]. When studies on rice consump- tion in Korea were reviewed, rice consumption decreased gradually as a result of food culture being Westernized since the 1990s and increasingly frequent dining-outs, and rice intake was lowest among women in their 20s-30s who dine out more frequently than other age groups [18,20].
Studies on factors influencing rice intake reported that the type and amount of rice consumed were influenced by factors such as race, gender, age, area, economic level, and lifestyle. A study on rice consumption by Asian immigrants living in Houston and Texas found that the preferred variety and quality of rice were different according to the consumer’s income [21]. According to another study on Americans’ rice intake during the periods 1994-1996 and 2001-2002, the proportion of people eating rice over 1/4 cup a day was largest as 30.2% among Hispanics, and 23.6%, 23.4% and 14.2%, respectively, among blacks, Mexican Americans, and Caucasians [6]. In a study that surveyed American people’s rice intake according to education level, the proportion of rice eaters was largest as 21.0% among middle school graduates or lower, and 19.3% and 13.5%, respectively, among two-year college graduates and high school graduates [6].
In another survey on rice consumption according to age by Asian
immigrants living in Houston and Texas in the 1990s, young
consumers influenced by Western culture preferred Jasmine-type
rice but consumed rice less than adult immigrants [21]. In this
study as well, Korean people’s rice intake was higher in older
people as reported similarly in previous studies. In many studies,
on the other hand, socio-economic environment was found to
influence food intake. The meal skipping rate increased and rice
consumption decreased considerably in Korea with the IMF crisis
in December, 1997, but the meal skipping rate went down sharply
along with economic recovery. In the same way, Korean people’s
vegetable intake decreased in 1998 and then increased gradually
with economic recovery [14]. According to a study that surveyed
Indonesian pregnant women’s dietary habits during the economic
crisis between 1996-1998, the number of women avoiding
beneficial food was 3 among urban pregnant women and 53
among rural pregnant women before the economic crisis but the
numbers decreased to 2 and 47, respectively, during the economic
crisis [22]. In this study on Korean people’s rice intake, the
decreasing trend in rice intake was observed in all age groups
and rice intake was lowest in the age group of 20-30s and highest
in the group aged over 65. In a study that surveyed the American
population consuming grains during the period 1990-1992, the
proportion of those taking grain food 3-3.99 times a day was
23.4% among adults aged over 19, lower than 35.7% in the age
group of 2-18 and 26.1% in the infant group younger than 2 [7].
In this study, the amount and ratio of rice consumption were different among meals. In general, the amount was lowest at in breakfast and larger in lunch and dinner, but in the age groups of 50-64 and over 65, rice intake was little different among the meals and was larger than that in other age groups. The results of the data suggest that the declining trends in Korean adults’
rice consumption can be related to the tendency to skip breakfast altogether or the abundance of substitute breakfast foods ie.bread and other cereal grain. Moreover, rice consumption was lowest in the age group of 19-29 showing the highest tendencies to skip breakfast of all age division, and was highest in the age group of 50-64 who hardly skip breakfast. In a study on Korean people’s vegetable intake as well, breakfast skipping in every category influenced the group’s vegetable consumption and the same result was reported on the breakfast skipping rate by age group [14]
According to the results of analysis in this study, rice intake has decreased every year since the 1990s. This trend was considered to be influenced by several the factors of the possibility of changed food culture, socio-economic phenomena, and other external factors. But there is a limitation in the diversity of comparative studies on rice intake in connection to changed dietary life environment, socio-economic factors and other related factors. Thus, more advanced research on food intake and change should be conducted in consideration of various socio-economic factors of subjects and countries based on various previous studies on rice intake.
References
1. Hong TH, Kim KY, Kim CR, Seo JK, Oh CH, Jeong YJ. New Food Materials Science. Paju: Jigu Publishing Co.; 2011.
2. Slavin J. Whole grains and human health. Nutr Res Rev 2004;17:
99-110.
3. Moutou C, Brester GW, Fox JA. US consumers' socioeconomic characteristics and consumption of grain-based foods. Agribusiness 1998;14:63-72.
4. Koh-Banerjee P, Rimm EB. Whole grain consumption and weight gain: a review of the epidemiological evidence, potential mechanisms and opportunities for future research. Proc Nutr Soc 2003;62:25-9.
5. van de Vijver LP, van den Bosch LM, van den Brandt PA, Goldbohm RA. Whole-grain consumption, dietary fibre intake and body mass index in the Netherlands cohort study. Eur J Clin Nutr 2009;63:31-8.
6. Batres-Marquez SP, Jensen HH, Upton J. Rice consumption in
the United States: recent evidence from food consumption surveys.
J Am Diet Assoc 2009;109:1719-27.
7. Albertson AM, Tobelmann RC. Consumption of grain and whole- grain foods by an American population during the years 1990 to 1992. J Am Diet Assoc 1995;95:703-4.
8. Sakamoto S, Hayashi T, Hayashi K, Murai F, Hori M, Kimoto K, Murakami K. Pre-germinated brown rice could enhance maternal mental health and immunity during lactation. Eur J Nutr 2007;46:391-6.
9. Galvin MA, Kiely M, Flynn A. Impact of ready-to-eat breakfast cereal (RTEBC) consumption on adequacy of micronutrient intakes and compliance with dietary recommendations in Irish adults.
Public Health Nutr 2003;6:351-63.
10. Statistics Korea [Internet]. Daejeon; 2009. Available from: http://
kostat.go.kr/.
11. Ministry of Health and Welfare [Internet]. Korea National Health and Nutrition Examination Survey Report. Seoul: Ministry of Health and Welfare; 1998. Available from: http://knhanes.cdc.go.kr.
12. Ministry of Health and Welfare [Internet]. Korea National Health and Nutrition Examination Survey Report. Seoul: Ministry of Health and Welfare; 2001. Available from: http://knhanes.cdc.go.kr.
13. Ministry of Health and Welfare [Internet]. Korea National Health and Nutrition Examination Survey Report. Seoul: Ministry of Health and Welfare; 2005. Available from: http://knhanes.cdc.go.kr.
14. Lee JS, Kim J. Vegetable intake in Korea: data from the Korean National Health and Nutrition Examination Survey 1998, 2001 and 2005. Br J Nutr 2010;103:1499-506.
15. Choi MK, Hyun WJ, Lee SY, Park HJ, Kim SN, Song KH. One portion size of foods frequently consumed by Korean adults. Nutr Res Pract 2010;4:82-8.
16. Zheng Z, Henneberry SR. An analysis of food grain consumption in urban Jiangsu province of China. J Agric Appl Econ 2010;
42:337-55.
17. Flood VM, Burlutsky G, Webb KL, Wang JJ, Smith WT, Mitchell P. Food and nutrient consumption trends in older Australians: a 10-year cohort study. Eur J Clin Nutr 2010;64:
603-13.
18. Ryu HK. A comparative study on the nutrient content of rice-based and wheat-based meals in Miryang and Daegu. Korean J Community Living Sci 2003;14:47-57.
19. Kim YO. Changes in health status with the changing patterns of rice consumption among Korean. Food Ind Nutr 2008;13:15-21.
20. Statistics Korea [Internet]. The results of researching grain consumption at households in Korea. Daejeon; 2009 [cited 2009 Oct 15]. Available from: http://kostat.go.kr/.
21. Goodwin HL Jr, Holcomb RB, Rister ME. A study of Asian- American rice demand in Houston, Texas. J Food Distrib Res 1996;27:41-7.
22. Hartini TN, Padmawati RS, Lindholm L, Surjono A, Winkvist A. The importance of eating rice: changing food habits among pregnant Indonesian women during the economic crisis. Soc Sci Med 2005;61:199-210.