서 론
2010년 국민건강영양조사에 따르면 한국인의 24시간(1일) 나트륨 섭취량은 2007년 4,464 mg에서 2010년 4,878 mg으로 매년 증가했으 며, 세계보건기구 권고량의 2배 이상 높은 것으로 보고하고 있다.1) 또 한, 미국, 영국, 일본 등 타 국가들과 비교하여도 높은 것으로 조사되
었다.2)
한국인이 나트륨 섭취가 높은 것은 장류, 김치, 젓갈류 등 식염함 량이 높은 음식의 과다 섭취와 음식에 간을 맞추기 위해 사용하는 조미료로 식염을 주로 사용하는데 기인 한다.3)
나트륨의 과잉섭취는 한국인의 사망원인 2위4)인 고혈압5,6) 및 심·뇌 혈관계질환7,8)과 비만9,10) 등 각종 성인병 발생 증가의 주 원인이 된다.
Received July 21, 2017 Revised October 18, 2017 Accepted October 24, 2017
Corresponding author Hyun Woo Kim Tel: +82-43-230-6555, Fax: +82-43-230-5300 E-mail: [email protected]
ORCID: http://orcid.org/0000-0002-9664-8324
Copyright © 2018 The Korean Academy of Family Medicine
This is an open-access article distributed under the terms of the Creative Commons At- tribution Non-Commercial License (http://creativecommons.org/licenses/by-nc/4.0) which permits unrestricted noncommercial use, distribution, and reproduction in any medium, provided the original work is properly cited.
Original Article
https://doi.org/10.21215/kjfp.2018.8.5.741 eISSN 2233-9116
Korean J Fam Pract. 2018;8(5):741-746
Korean Journal of Family Practice
KJFP
한국 성인의 소변 중 나트륨 배설량 추세: 국민건강영양조사 2009-2015년 기반
한윤재, 김현우*, 김정현, 이동원, 정지훈, 조상현, 김선환, 정승진, 조병식, 윤재현
청주하나병원 가정의학과
Trends of Urinary Excretion of Sodium in Korean Adults: Based on the Korea National Health and Nutrition Examination Survey 2009-2015
Yun Jae Han, Hyun Woo Kim*, Jung Hyun Kim, Dong Won Lee, Ji Hoon Jung, Sang Hyun Cho, Sun Whan Kim, Seung Jin Jung, Byung Shik Cho, Jae Hyun Youn
Department of Family Medicine, Hana General Hospital, Cheongju, Korea
Background: Although the association between sodium intake and disease has been reported, no studies have assessed the trend of sodium excretion in urine in Koreans. We estimated daily urinary sodium excretion in Koreans and analyzed annual trends over time.
Methods: The 4th (2009), 5th (2010–2011), and 6th (2013–2014) National Health and Nutrition Examination Survey were used to extract data on adult subjects aged >20 years who did not take blood pressure medicine. The daily urinary sodium excretion was calculated using the E24UNA_K formula.
The chi-square test was used to compare annual differences in analysis variables. Independent two-sample t-tests and analysis of variance were used to compare differences in 24-hour average urinary sodium excretion. Linear regression analysis was used to examine the increase according to year.
Results: The daily average urinary sodium excretion in Korean adults was 170.8±35.6 meq/day from 2009 to 2015. The daily average sodium excretion was 177.3±35.0 meq/day in 2009, 168.9±37.7 meq/day in 2010–2011, and 170.4±34.8 meq/day in 2014–2015. There were no significant increases between these periods (P-trend=0.459).
Conclusion: Although there were no increases in daily average sodium excretion, Koreans should try to reduce sodium intake because the daily average sodium consumption by Koreans is more than double the recommended allowance.
Keywords: Urinalysis; Creatinine; Nutrition Surveys
Yun Jae Han, et al. Trends of Urinary Excretion of Sodium in Korean
Korean Journal of Family Practice
KJFP
고혈압의 경우 Law 등11)의 연구에 의하면 하루 소금 섭취량이 100 meq 증가했을 때 수축기혈압은 4–5 mmHg, 이완기혈압은 2 mmHg 정도 증가하며, He 등12) 연구에서도 유사한 결과를 보였다. 비만의 경 우 아침결식, 빠른 식사속도, 불규칙적인 식사 등 나트륨 섭취보다 기여요인이 높은 원인들이 있지만 이미 국·내외 많은 선행연구들에 서 나트륨과의 관련성을 보고하고 있다.13-17)
이처럼 나트륨 섭취와 각종 질병의 관련성이 밝혀지면서 전 세계 적으로 자국 국민들의 건강을 보호하기 위해 나트륨 저감화 정책이 시행되고 있다. 국제 건강 단체인 World Action on Salt and Health (WASH)에 의하면 핀란드, 영국과 같은 몇몇 국가에서는 이미 식품 에 첨가 된 소금의 양을 모두 표기하게 하였고 대중들의 인식을 높 이는 정책을 병행함으로써 소비되는 소금의 양을 줄였다고 한다. 또 한, 미국, 호주, 캐나다 등 선진국가에서도 소금의 질병 유의성을 중 요하게 인지하고 있어 역시 그 활동을 강화하고 있다고 한다.18)
한국 또한 보건복지부와 식품의약품안전처에서 나트륨 저감화 정책을 주도하고 있으며 지방자치단체와 시민단체에서도 저감화를 위한 홍보를 지속적으로 하고 있다.19)
나트륨 섭취와 관련한 성인병의 유의성 연구와 제도적인 장치 및 홍보가 국민들의 건강을 위해 중요하지만 보다 근본적인 나트륨 저 감화를 위해서는 성인의 섭취경향 파악이 우선시 되어야 할 것이다.
그러나 선행연구에서는 주로 질병에 근거한 유의성에 초점을 두었으 며, 생체표지자(소변)를 활용하여 한국 성인의 나트륨 섭취량의 다 년간 추세를 분석한 연구는 전무하다.
나트륨 섭취량을 측정하는 방법은 24시간 소변, 8시간 야간뇨 (over-night urine), 수시뇨(spot urine)와 이외 24시간 회상법, 식사 일 기법 등이 있다.20) 이중 24시간 소변검사가 가장 정확한 검사이지만 소변 수집에 어려움이 있기 때문에 대규모 역학연구에 이용하는 어 렵다.1) 그래서 수집이 용이한 수시뇨를 이용하는 방법이 많이 이용 된다. 수시뇨를 이용하여 나트륨 섭취량을 측정하는 것은 이미 여러 선행연구에서 유용성이 학문적으로 입증되었다.21-23)
본 연구에서는 국민건강영양조사의 수시뇨 검체의 분석값을 바 탕으로 한국 성인의 24시간 요나트륨 배설량을 추정하여 연도 별 배 설량과 추세를 살펴보고, 한국인의 나트륨 감소를 위한 보건의료정 책의 정책방향을 제시하는 기초자료가 되고자 한다.
방 법
1. 연구 대상자 선정
본 연구는 다년간의 추세분석을 위해 국민건강영양조사 제 4기 (2009년), 5기(2010–2011년), 6기(2013–2014년) 자료를 사용하였으며,
분석 대상은 20세 이상 성인 중 혈압약 비 복용자 635명으로 한정하 였다. 분석 자료를 3기에 걸친 5개년 자료만 선택한 것은 24시간 요나 트륨 추정을 위해 필요한 요나트륨과 요크레아틴 수치가 5개년 자료 에만 모두 기록되어 있기 때문이며, 혈압약 복용자를 연구에서 제외 한 것은 혈압약 성분 중 이뇨성분이 있는 경우 요분석값에 영향을 미치기 때문이다.
2. 24시간 요나트륨 배설량 추정값 산출
24시간 요나트륨 배설량 추정값 산출을 위해 본 연구에서는 Park 등24) 연구에서 사용한 Tanaka 공식의 한국형 공식인 E24UNA_K (=28.985×XNA0.346), XNA {=spot urine sodium (mEq/L)/[10×spot urine creatinine (mg/dL)]}×E24UCR_K (=7.428×age (yr)+10.372×weight (kg)+15.631×height (cm)-1234.758)를 사용하였다. 본 연구의 분석값은 모두 24시간 요나트륨 배설 추정량을 근거로 분석하였다.
3. 연구 변수 선택 및 정의
변수는 성별 이외 24시간 소변의 나트륨량 배설량을 추정·산출 하기 위해 사용하는 Tanaka 공식에 입력변수인 연령(yr), 키(cm), 몸무 게(kg), 요나트륨(mmol/L=meq/L), 요크레아틴(mg/dL)을 1차 변수로 선택하고 이를 순차적으로 공식에 대입하여 산출한 값을 24시간 요 나트륨 배설량(meq/day)으로 정의하였고 이를 새로운 종속변수 선 정하였다. 그리고 나트륨과 가장 유의성이 높은 질병인 고혈압과 직·간접적 영향이 있는 비만도를 추가 독립변수로 선정하여 추세분 석에 추가하였다.
독립변수의 분류에서 연령은 20세 이상–39세 미만, 40세 이상–59 세 미만, 60세 이상 3군, 관련 질병 변수인 고혈압은 국민건강영양조 사 자료에서 분류한 정상(수축기혈압 120 mmHg 미만, 이완기 혈압 80 mmHg 미만), 고혈압전단계(수축기혈압 120 mmHg 이상, 140 mmHg 미만, 이완기혈압 80 mmHg 이상 90 mmHg 미만), 고혈압(수 축기혈압 140 mmHg 이상 또는 이완기혈압 90 mmHg 이상) 3단계, 비 만은 세계보건기구 기준에 따라 체질량지수(body mass index) 18.5–
25 kg/m2, 정상; 25–30 kg/m2, 과체중; 30 kg/m2 이상, 비만으로 분류하 였다.
4. 통계 분석
분석은 해당 변수에 가중치를 적용하여 분석하였다. 분석 대상의 연도 별 변수 간 특성 비교는 카이제곱(chi-square)검정을 사용하였 으며, 24시간 평균 요나트륨 배설량의 변수 간 비교는 독립 표본 t-검 정(independent two-samples t-test)과 분산분석(analysis of variance, ANOVA), 연도에 따른 선형적 증가에 대한 분석은 선형회귀분석
한윤재 외. 한국 성인의 소변 중 나트륨 배설량 추세 Korean Journal of Family Practice
KJFP
(linear regression analysis)을 수행하였으며 그 유의값으로 추이변화 의 유의성(p-trend)을 검정하였다. 모든 분석은 SAS Enterprise Guide 6.1 (SAS Institute, Cary, NC, USA)로 하였으며 통계적 유의수준은 P<0.05로 설정하였다.
결 과
1. 연구 대상자의 특성
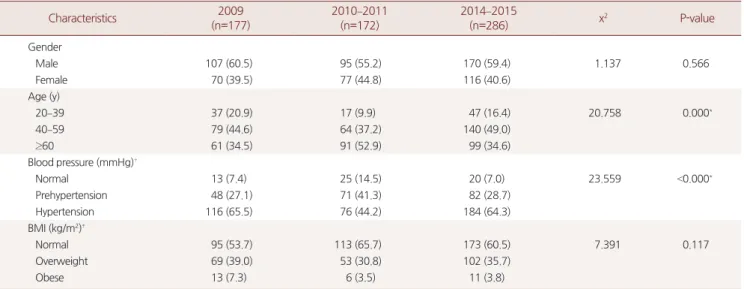
연구 대상자들의 연도 별 변수 간 특성결과 2009년 남자 107명 (60.5%), 여자 70명(39.5%), 2011–2014년 남자 95명(55.2%), 여자 77명 (44.8%), 2014–2015년 170명(59.4%), 여자 116명(40.6%)이고 통계적으로 유의하지 않았다(P=0.566). 연령은 2009년과 2014–2015년에 40–59세 가 각각 79명(44.6%), 140명(49.0%)으로 가장 많았고, 2010–2011년은 60세 이상이 91명(52.9%)으로 가장 많았으며 통계적으로 유의하였다 (P=0.000). 혈압분류에서는 모든 연도에서 고혈압자가 각각 116명 (65.5%), 76명(44.2%), 184명(64.3%)으로 가장 높았고, 고혈압전단계, 정 상 순이었으며 통계적으로 유의하였다(P<0.000). 비만분류에서는 2009년 정상체중 95명(53.7%), 과체중 69명(39.0%), 비만 13명(7.3%), 2010–2011년은 각각 113명(65.7%), 53명(30.8%), 6명(3.5%), 2014–2015년 은 173명(60.5%), 102명(35.7%), 11명(3.8%)이고 통계적으로 유의하지 않았다(P=0.117) (Table 1).
2. 연도 별 변수 간 24시간 평균 요나트륨 배설량(meq/day) 비교
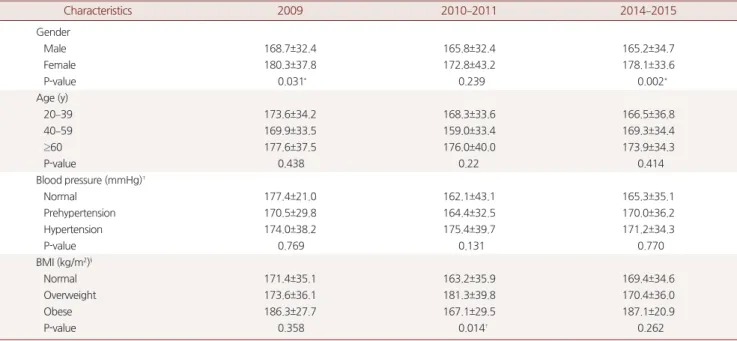
연도 별 변수 간 24시간 평균 요나트륨 배설량 비교 결과 성별에서 는 2009년에 여성이 180.3±37.8 meq/day, 남성이 168.7±32.4 meq/day로 여성의 배설량이 약 12 meq/day 많았고 통계적으로 유의하였다 (P=0.031). 2014–2015년에는 여성이 178.1±33.6 meq/day, 남성이 165.2±34.7 meq/day로 여성이 약 13 meq/day 많았고 통계적으로 유의 하였다(P=0.002). 그러나 2010–2011년에는 여성이 172.8±43.2 meq/
day, 남성이 165.8±32.4 meq/day였고 통계적으로 유의하지 않았다 (P=0.239).
연령에서는 2009년에 60세 이상이 177.6±37.5 meq/day, 20–39세 미 만 173.6±34.2 meq/day, 40–59세 미만 169.9±33.5 meq/day이고 통계적 으로 유의하지 않았다(P=0.438). 2010–2011년에는 60세 이상이 176.0±40.0 meq/day, 20–39세 미만 168.3±33.6 meq/day, 40–59세 미만 159.0±33.4 meq/day이고 통계적으로 유의하지 않았다(P=0.22). 2014–
2015년에는 60세 이상이 173.9±34.3 meq/day, 40–59세 미만 169.3±34.4 meq/day, 20–39세 미만 166.5±36.8 meq/day 이고 통계적으로 유의하 지 않았다(P=0.414).
혈압 분류에서는 2009년에 정상군이 177.4±21.0 meq/day, 고혈압 174.0±38.2 meq/day, 고혈압전단계 170.5±29.8 meq/day이고 통계적으 로 유의하지 않았다(P=0.769). 2010–2011년은 고혈압이 175.4±39.7 meq/day, 고혈압전단계 164.4±32.5 meq/day, 정상 162.1±43.1 meq/day 이고 통계적으로 유의하지 않았다(P=0.131). 2014–2015년은 고혈압
Table 1. Comparison of the characteristics between variables of the analysis subjects by year
Characteristics 2009
(n=177)
2010–2011 (n=172)
2014–2015
(n=286) x2 P-value
Gender
Male 107 (60.5) 95 (55.2) 170 (59.4) 1.137 0.566
Female 70 (39.5) 77 (44.8) 116 (40.6)
Age (y)
20–39 37 (20.9) 17 (9.9) 47 (16.4) 20.758 0.000*
40–59 79 (44.6) 64 (37.2) 140 (49.0)
≥60 61 (34.5) 91 (52.9) 99 (34.6)
Blood pressure (mmHg)†
Normal 13 (7.4) 25 (14.5) 20 (7.0) 23.559 <0.000*
Prehypertension 48 (27.1) 71 (41.3) 82 (28.7)
Hypertension 116 (65.5) 76 (44.2) 184 (64.3)
BMI (kg/m2)‡
Normal 95 (53.7) 113 (65.7) 173 (60.5) 7.391 0.117
Overweight 69 (39.0) 53 (30.8) 102 (35.7)
Obese 13 (7.3) 6 (3.5) 11 (3.8)
Values are presented as number (%).
BMI, body mass index.
*P<0.05. †Blood pressure categories (in mmHg): normal (systolic blood pressure [SBP] <120, diastolic blood pressure [DBP] <80), prehypertension (SBP of 120–139 or DBP of 80–89), hypertension (SBP ≥140 or DBP ≥90). ‡BMI categories (in kg/m2): normal (18 to <25), overweight (25 to <30), obese (≥30).
Yun Jae Han, et al. Trends of Urinary Excretion of Sodium in Korean
Korean Journal of Family Practice
KJFP
이 171.2±34.3 meq/day, 고혈압전단계 170.0±36.2 meq/day, 정상 165.3±35.1 meq/day이고 통계적으로 유의하지 않았다(P=0.770).
비만 분류에서는 2010–2011년에는 과체중군이 181.3±39.8 meq/day 로 가장 많았고 비만, 정상 순이었으며 통계적으로 유의하였다 (P=0.014, Scheffe: overweight>normal). 그러나 2009년에는 비만군이 186.3±27.7 meq/day, 과체중 173.6±36.1 meq/day, 정상 171.4±35.1 meq/
day이고 통계적으로 유의하지 않았다(P=0.358). 2014–2015년 역시 비 만군 187.1±20.9 meq/day, 과체중 170.4±36.0 meq/day, 정상 169.4±34.6 meq/day이고 통계적으로 유의하지 않았다(P=0.262) (Table 2).
3. 한국 성인의 24시간 평균 요나트륨 배설량(meq/day)의 연도 별 비교 및 추세
한국 성인의 24시간 평균 요나트륨 배설량의 연도 별 비교 및 추세
결과 2009년 177.3±35.0 meq/day, 2010–2011년 168.9±37.7 meq/day, 2014–2015년 170.4±34.8 meq/day 로 통계적으로 유의하지 않았고 (P=0.496), 선형적 증가추세 경향도 없었다(P=0.459) (Table 3).
고 찰
본 연구는 2009–2014년 국민건강영양조사 자료에 수시뇨의 요중 크레아틴과 요중나트륨 값을 바탕으로 Tanaka 공식의 한국형 공식 (E24UNA_K)을 적용하여 한국 성인의 24시간 요나트륨 배설량을 추정하여 연도 별 배설량과 추세를 분석하였다.
연구 결과 2009–2015년의 한국 성인의 24시간 평균 요나트륨 배설 량은 170.8±35.6 meq/day이며, 3기 중(2009–2015년) 2009년은 177.3±35.0 meq/day, 2010–2011년 168.9±37.7 meq/day, 2014–2015년
Table 2. Comparison of 24 hour urine sodium excretion (meq/day) between variables by year
Characteristics 2009 2010–2011 2014–2015
Gender
Male 168.7±32.4 165.8±32.4 165.2±34.7
Female 180.3±37.8 172.8±43.2 178.1±33.6
P-value 0.031* 0.239 0.002*
Age (y)
20–39 173.6±34.2 168.3±33.6 166.5±36.8
40–59 169.9±33.5 159.0±33.4 169.3±34.4
≥60 177.6±37.5 176.0±40.0 173.9±34.3
P-value 0.438 0.22 0.414
Blood pressure (mmHg)‡
Normal 177.4±21.0 162.1±43.1 165.3±35.1
Prehypertension 170.5±29.8 164.4±32.5 170.0±36.2
Hypertension 174.0±38.2 175.4±39.7 171.2±34.3
P-value 0.769 0.131 0.770
BMI (kg/m2)§
Normal 171.4±35.1 163.2±35.9 169.4±34.6
Overweight 173.6±36.1 181.3±39.8 170.4±36.0
Obese 186.3±27.7 167.1±29.5 187.1±20.9
P-value 0.358 0.014† 0.262
Values are presented as mean±standard deviation.
BMI, body mass index.
*P<0.05. †Scheffe (P=0.014): overweight>normal. ‡Blood pressure categories (in mmHg): normal (systolic blood pressure [SBP] <120, diastolic blood pressure [DBP]
<80), prehypertension (SBP of 120–139 or DBP of 80–89), hypertension (SBP ≥140 or DBP ≥90). §BMI categories (in kg/m2): normal (18 to <25), overweight (25 to
<30), obese (≥30).
Table 3. Annual comparisons and trends in 24 hours urine sodium excretion (meq/day) in Korean adults
Survey period Urine sodium 95% confidence interval
(min–max) F P-value
2009 177.3±35.0 168.1–178.5 (79.7–279.6) 0.702 0.496
2010–2011 168.9±37.7 163.2–174.6 (71.3–287.5)
2014–2015 170.4±34.8 166.4–174.5 (77.3–256.5)
Total 170.8±35.6 -
P-trend* 0.459 (F=0.548, R2=0.0009)
*Linear regression analysis for linear trend change verification.
한윤재 외. 한국 성인의 소변 중 나트륨 배설량 추세 Korean Journal of Family Practice
KJFP
170.4±34.8 meq/day 유의한 선형적 증가는 없는 것으로 분석되었다.
본 연구의 결과와 비교하기 위해 2015년 국민건강영양조사 자료 를 살펴본 결과 한국인의 나트륨 섭취량은 목표 섭취량 대비 섭취비 율이 2005년 269.6%에서 매년 증가와 감소를 반복하면서 2013년에는 200% 이하로 떨어지지만 2015년부터는 다시 200%가 넘는다고 보고 하고 있다.20) 24시간 배출 추정량을 산출한 본 연구와 정확한 비교는 불가능하지만 등락의 폭이 적다는 관점에서 본다면 큰 흐름의 차이 는 없다고 해석할 수 있다. 하지만 본 연구결과에서 2009–2015년까 지 여성이 남성보다 요나트륨 배설량이 많다는 것과 고혈압과 비만 군의 배설량 차이가 유의하지 않다는 결과는 1972년 Dahl25)의 연구 부터 최근 Pramono 등26)의 연구에 이르기까지 그간의 연구에서 나 타낸 통념적인 결과와 다른 내용이다. 이처럼 이전 선행연구에서 나 트륨과 고혈압과의 유의성을 보고27,28)했지만 2011년 Stolarz-Skrzypek 등29)의 연구에서는 요중나트륨 배설량과 고혈압의 발병률은 차이 가 없고 오히려 배설량이 적으면 심혈관질환의 사망률이 높다고 했 으며 Lelong 등30)의 연구에서는 1일 소금 섭취량과 수축기혈압은 남 성에서는 유의했지만 여성에서는 유의하지 않았다고 했다. 또한, 2011년 부산 지역 일부 성인을 대상으로 한 연구의 경우 남성의 요나 트륨 배설량이 여성보다 많지만 그 차이가 유의하지 않다라는 결과 를 나타냈다. 이상의 연구들에서 서로 다른 결과를 나타내는 이유 중 하나는 대상자의 특성이 연구마다 다르기 때문인 것으로 사료된 다. 본 연구 또한 분석대상을 혈압약 비 복용자로 한정하여 연구결 과에 영향을 미쳤다고 판단된다. 하지만 아직 대다수의 연구에서는 나트륨과 질병의 유의성을 주장하고 있다.
요중에 배설되는 나트륨은 섭취량의 급격한 변화나 다른 경로에 서의 비정상적인 상실이 없는 한, 섭취량과 거의 같은 양을 배설하며 염광광도법에 의한 성인의 24시간 요나트륨 배설량은 130–260 mEq/
day이다. 본 연구에서 산출한 24시간 평균 배설량 170.8 mEq/day, 최 고 배설량 287.5 mEq/day과 상대치 개념으로 비교해 보면 배설량은 비교적 양호한 수준이라고 할 수 있다.
나트륨 섭취량과 배설량을 줄이는 것은 질병의 예방뿐 아니라 사 회·경제적 비용도 절감할 수 있다. 2012년 식품의약품안전처 보도자 료에 따르면 나트륨 1일 섭취량을 3,000 mg (소금 7.5 g)으로 낮출 경 우 사회적 편익이 13조원(의료비용 절감 등 3조원, 사망 감소에 따른 편익 10조원)이 발생한다고 한다. 이처럼 나트륨 저감화는 국민의 건 강과 사회적 편익을 위해 반드시 필요한 공공 실천사항이며 현재 한 국도 이를 위한 홍보와 사업을 정책적으로 지향하고 있다.
본 연구의 제한점으로는 분석 대상을 혈압약 비 복용자로 한정했 다는 점과 나트륨 섭취량 측정에 있어 수시뇨를 바탕으로 산출했다 는 점이다. 이 부분을 유념하여 연구 결과를 해석해야 할 것이다. 향
후 연구결과의 신뢰성을 위해 24시간 뇨배설량을 바탕으로 측정한 대량 연구가 필요할 것으로 사료된다. 특히 질병의 유의성 부분은 국 민건강과 직결되기 때문에 반드시 실현되어야 한다.
요 약
연구배경:
나트륨 섭취로 인한 질병의 발생과 다년간의 섭취량에 대 한 연구들이 있지만 소변의 나트륨 배설량을 근거한 한국 성인의 다 년간 요나트륨 배설량의 추세를 분석한 연구는 없다. 그래서 본 연구 에서는 한국 성인의 24시간(1일) 요나트륨 배설량을 추정하여 연도 별 배설량과 추세를 분석하였다.방법:
국민건강영양조사 제 4기(2009년), 5기(2010–2011년), 6기 (2013–2014년) 자료를 이용하였고, 20세 이상 성인 중 혈압약 비 복용 자를 선정하여 분석하였다. 24시간 요나트륨 배설량은 E24UNA_K 공식으로 산출하였다. 그리고 분석 대상의 연도 별 변수 간 특성 비 교는 카이제곱(chi-square)검정, 24시간 평균 요나트륨 배설량의 변수 간 비교는 독립 표본 t-검정(independent two-samples t-test)과 분산분 석(ANOVA), 연도에 따른 배설량의 선형적 증가는 단순선형회귀분 석(linear regression analysis)으로 검증하였다.결과:
2009–2015년의 한국 성인의 24시간 평균 요나트륨 배설량은 170.8±35.6 meq/day이며, 2009년 177.3±35.0 meq/day, 2010–2011년 168.9±37.7 meq/day, 2014–2015년 170.4±34.8 meq/day으로 유의한 증가 는 없었다(P-trend=0.459).결론:
한국 성인의 24시간 요나트륨 배설량의 증가는 없었지만 한국 은 나트륨 섭취량이 권장량보다 2배 이상 높기 때문에 나트륨 저감 화을 위한 각고의 노력이 필요할 것이다.중심단어:
요검사; 크레아티닌; 영양조사REFERENCES
1. Korea Centers for Disease Control and Prevention. Korea National Health and Nutrition Examination Survey (KNHANES V-1). Cheongju: Korea Centers for Disease Control and Prevention; 2011.
2. Rhee MY, Lee SY, Oh SW, Shin SJ, Yim JY, Kim JH, et al. Study for the effect of Natrium intake on the prevalence of cardiovascular disease. Seoul: Ministry of Food and Drug Safety; 2013 Nov. Report No. 1475007349.
3. Lim HJ. A study on the food intake, sodium and potassium intakes and uri- nary excretion of preschool children in Pusan. Korean J Nutr 2000; 33: 647- 59.
4. Statistics Korea. Annual report on the cause of death statistics. Daejeon: Sta- tistics Korea; 2008.
5. HE FJ, MacGregor GA. Salt, blood pressure and cardiovascular disease.
Yun Jae Han, et al. Trends of Urinary Excretion of Sodium in Korean
Korean Journal of Family Practice
KJFP
Curr Opin Cardiol 2007; 22: 298-305.
6. Adrogué HJ, Madias NE. Sodium and potassium in the pathogenesis of hy- pertension. N Engl J Med 2007; 356: 1966-78.
7. Cook NR, Cutler JA, Obarzanek E, Buring JE, Rexrode KM, Kumanyika SK, et al. Long term effects of dietary sodium reduction on cardiovascular dis- ease outcomes: observational follow-up of the trials of hypertension pre- vention (TOHP). BMJ 2007; 334: 885-8.
8. Tuomilehto J, Jousilahti P, Rastenyte D, Moltchanov V, Tanskanen A, Pietinen P, et al. Urinary sodium excretion and cardiovascular mortality in Finland: a prospective study. Lancet 2001; 357: 848-51.
9. He FJ, Marrero NM, MacGregor GA. Salt intake is related to soft drink con- sumption in children and adolescents: a link to obesity? Hypertension 2008;
51: 629-34.
10. Hoffmann IS, Cubeddu LX. Salt and the metabolic syndrome. Nutr Metab Cardiovasc Dis 2009; 19: 123-8.
11. Law MR, Frost CD, Wald NJ. By how much does dietary salt reduction low- er blood pressure? I--analysis of observational data among populations.
BMJ 1991; 302: 811-5.
12. He FJ, Markandu ND, MacGregor GA. Modest salt reduction lowers blood pressure in isolated systolic hypertension and combined hypertension. Hy- pertension 2005; 46: 66-70.
13. Song HJ, Cho YG, Lee HJ. Dietary sodium intake and prevalence of over- weight in adults. Metabolism 2013; 62: 703-8.
14. Yoon YS, Oh SW. Sodium density and obesity; the Korea National Health and Nutrition Examination Survey 2007-2010. Eur J Clin Nutr 2013; 67:
141-6.
15. Grimes CA, Riddell LJ, Campbell KJ, Nowson CA. Dietary salt intake, sugar- sweetened beverage consumption, and obesity risk. Pediatrics 2013; 131: 14- 21.
16. Jain N, Minhajuddin AT, Neeland IJ, Elsayed EF, Vega GL, Hedayati SS. As- sociation of urinary sodium-to-potassium ratio with obesity in a multieth- nic cohort. Am J Clin Nutr 2014; 99: 992-8.
17. Yi SS, Firestone MJ, Beasley JM. Independent associations of sodium intake with measures of body size and predictive body fatness. Obesity (Silver Spring) 2015; 23: 20-3.
18. He FJ, Jenner KH, Macgregor GA. WASH-world action on salt and health.
Kidney Int 2010; 78: 745-53.
19. Kim HN. Sodium reduction policy of foreign nations and perception of in- stitutional foodservice customers on low sodium diet [dissertation]. Seoul:
Chung-Ang Univ.; 2012. Korean.
20. Korea Centers for Disease Control and Prevention. Korea National Health and Nutrition Examination Survey (KNHANES VI-3). Cheongju: Korea Centers for Disease Control and Prevention; 2016.
21. National Centre for Social Research. An assessment of dietary sodium levels among adults (aged 19-64) in the general population in Wales based on analysis of dietary sodium in 24 hour urine samples. London: Joint Health Surveys Unit; 2007.
22. Scottish Centre for Social Research. A survey of 24 hour urinary sodium excretion in a representative sample of the Scottish population as a measure of salt intake. Edinburgh: Scottish Centre for Social Research; 2011.
23. Ortega RM, López-Sobaler AM, Ballesteros JM, Pérez-Farinós N, Rodrí- guez-Rodríguez E, Aparicio A, et al. Estimation of salt intake by 24 h urinary sodium excretion in a representative sample of Spanish adults. Br J Nutr 2011; 105: 787-94.
24. Park JH, Kim YC, Koo HS, Oh SW, Kim S, Chin HJ. Estimated amount of 24-hour urine sodium excretion is positively correlated with stomach and breast cancer prevalence in Korea. J Korean Med Sci 2014; 29 Suppl 2: S131- 8.
25. Dahl LK. Salt and hypertension. Am J Clin Nutr 1972; 25: 231-44.
26. Pramono A, Noriko N, S B Komara. Natrium dischargement from periph- eral blood as a predominant factor influenced by the administration of ba- nana (Musa paradisiaca) on elderly female hypertensive patient. IOP Conf Ser Mater Sci Eng 2017: 193.
27. Jeong YS, Lim HJ, Kim SB, Kim HJ, Son SM. Blood pressure and dietary re- lated risk factors associated with high sodium intake assessed with 24-hour urine analysis for Korean adults. Korean J Community Nutr 2014; 19: 537- 49.
28. Pfeiffer CM, Hughes JP, Cogswell ME, Burt VL, Lacher DA, Lavoie DJ, et al.
Urine sodium excretion increased slightly among U.S. adults between 1988 and 2010. J Nutr 2014; 144: 698-705.
29. Stolarz-Skrzypek K, Kuznetsova T, Thijs L, Tikhonoff V, Seidlerová J, Richart T, et al. Fatal and nonfatal outcomes, incidence of hypertension, and blood pressure changes in relation to urinary sodium excretion. JAMA 2011; 305:
1777-85.
30. Lelong H, Galan P, Kesse-Guyot E, Fezeu L, Hercberg S, Blacher J. Relation- ship between nutrition and blood pressure: a cross-sectional analysis from the NutriNet-Santé Study, a French web-based cohort study. Am J Hyper- tens 2015; 28: 362-71.