Nutritional intake of Korean population before and after adjusting for within-individual variations: 2001 Korean National Health and Nutrition Survey Data
Dong Woo Kim1, Jae Eun Shim2, Hee Young Paik1, Won O Song3 and Hyojee Joung4§
1Department of Food and Nutrition, Seoul National University, Seoul 151-742, Korea
2Research Institute of Human Ecology, Seoul National University, Seoul 151-742, Korea
3Department of Food Science and Human Nutrition, Michigan State University, MI 48824, USA
4The Graduated School of Public Health, Seoul National University, 599 Gwanangno, Gwanak-gu, Seoul 151-742, Korea
Abstract
Accurate assessment of nutrient adequacy of a population should be based on usual intake distribution of that population. This study was conducted to adjust usual nutrient intake distributions of a single 24-hour recall in 2001 Korean National Health and Nutrition Surveys (KNHNS) in order to determine the magnitude of limitations inherent to a single 24-hour recall in assessing nutrient intakes of a population. Of 9,960 individuals who provided one 24-hour recall in 2001 KNHNS, 3,976 subjects provided an additional one-day 24-hour recall in 2002 Korean National Nutrition Survey by Season (KNNSS). To adjust for usual intake distribution, we estimated within-individual variations derived from 2001 KNHNS and 2002 KNNSS using the Iowa State University method. Nutritionally at risk population was assessed in reference to the Dietary Reference Intakes for Koreans (KDRIs). The Korean Estimated Average Requirement (Korean EAR) cut-point was applied to estimate the prevalence of inadequate nutrient intakes except for iron intakes, which were assessed using the probability approach. The estimated proportions below Korean EAR for calcium, riboflavin, and iron were 73%, 41%, and 24% from usual intake distribution and 70%, 51%, and 39% from one-day intake distribution, respectively.
The estimated proportion of sodium intakes over the Intake Goal of 2,000 mg/day was 100% of the population after adjustment. The energy proportion from protein was within Korean Acceptable Macronutrient Distribution Ranges (Korean AMDR), whereas that of carbohydrate was higher than the upper limit and that of fat was below the lower limit in the subjects aged 30 years or older. According to these results, the prevalence of nutritional inadequacy and excess intake is over-estimated in Korea unless usual intake distributions are adjusted for one-day intakes of most nutrients.
Key Words: Dietary assessment, DRIs (Dietary Reference Intakes), usual intake, within-individual variation
Introduction13)
Collection and assessment of usual dietary intake data in free-living populations are challenging in terms of reliability and validity [1-3]. Monitoring of usual intake requires collection of dietary intake data over a long period [4], which is not feasible in large scale population studies.
Food frequency questionnaires (FFQs) and 24-hour recall are two common approaches for collecting dietary data. Although FFQs are designed to measure long-term dietary intake, their validity highly depends on the list of food items the questionnaire as well as participants’ cognitive functions [5-8]. On the other hand, 24-hour recall is convenient in collecting information about food types and amounts, but its validity is limited in estimating usual intake due to large day-to-day variations in individual dietary intake. In order to compensate for daily variations, researchers average multiple 24-hour recall or use statistical approaches [9,10].
Several statistical methods have been developed over the last
two decades to address the limitations of 24-hour recall in estimating usual dietary intake of populations. Most of these methods focus on controlling the so-called within-individual variation of short-term dietary measurements. Hoffman et al. [11]
compared six different statistical methods to estimate usual intake distribution. Dodd et al. [9] recently reviewed the theory of the statistical methods for estimating usual intake distribution. The authors concluded that the usual intake distribution calculated from statistical modeling approach is closer to the distribution of doubly labeled water measurement than those of FFQs and one 24-hour recall.
The Dietary Reference Intakes for Koreans (KDRIs) [12] with Estimated Average Requirements (EARs) and Tolerable Upper Intake Levels (ULs) are important references in estimating the prevalence of inadequacies in order to establish appropriate public health policies. However, interpretation depends largely on valid estimation of usual intake of the population [13,14].
In this study, we assessed nutritionally inadequate subjects based on Korean DRIs, using the Iowa State University (ISU)
§Corresponding Author: Hyojee Joung, Tel. 82-2-880-2716, Fax. 82-2-880-8775, Email. [email protected] Received: January 3, 2011, Revised: March 25, 2011, Accepted: April 11, 2011
ⓒ2011 The Korean Nutrition Society and the Korean Society of Community Nutrition
This is an Open Access article distributed under the terms of the Creative Commons Attribution Non-Commercial License (http://creativecommons.org/licenses/by-nc/3.0/) which permits unrestricted non-commercial use, distribution, and reproduction in any medium, provided the original work is properly cited.
Fig. 1. Rotating sampling scheme to collect two 24-hour recall data from a subset population: 2001 Korean National Health and Nutrition Survey, PSUs:
Primary sampling units
method, from adjusted one-day 24-hour recall data by controlling within-individual variations of subsamples. To calculate the proportion of inadequate or excessive intake, we applied Korean EARs or Korean ULs to the adjusted and unadjusted distributions of dietary intake data.
Subjects and Methods
Study subjects and design
The dietary intake data used in this study were from the 2001 KNHNS and the 2002 Korean National Nutrition Survey by Season (KNNSS), which were conducted by the Korean Ministry of Health and Welfare. The purpose of the surveys was to estimate the yearly food intake and assess health and nutritional status among Koreans. The 2001 KNHNS was a cross-sectional survey conducted in nationally representative samples between November and December of 2001 [15]. A total of 43,032 individuals from 13,200 households of 600 Primary Sampling Units (PSUs) took part in the 2001 KNHNS in one or more of four parts: Health Interview Survey, Health Behavior Survey, Health Examination Survey and Nutrition Survey.
Data collected in the Nutrition Survey were interviewer- administered one 24-hour recall of 9,968 individuals from 4,000 households of 200 PSUs. Three additional 24-hour recalls were repeated in three subsequent seasons in the 2002 KNNSS to offset seasonal variation in food intake and estimate the annual food intake of the Korean population [16]. In 2002, the subjects were selected by a rotation sampling method as depicted in Fig. 1.
Briefly, the rotating sampling method for the 2002 KNNSS spring
survey included 500 overlapping households of 50 PSUs out of 200 PSUs surveyed nationwide in the 2001 KNHNS. Similarly, another 500 overlapping households of 50 PSUs were made in the subsequent 2002 KNNSS summer survey. For the 2002 KNNSS fall survey, the same rotating sampling scheme was used to overlap 500 households of 50 PSUs between summer and fall surveys (Fig. 1). In this manner, individuals from 1500 households of 150 PSUs had two 24-hour recall data.
Dietary recall data of the 2001 KNHNS and the 2002 KNNSS were collected by trained interviewers from each individual at their residence using 43 food models and 281 color photographs of foods to assist in estimating portion sizes. The 6th edition of the food composition table from the National Rural Living Science Institute [15] was used to calculate nutrient values in foods. The database of the National Rural Living Science Institute consisted of 2,337 food items and 2,294 dishes [15]. Further, the processed food database containing a total 2,752 food items, including 1,250 processed foods, 690 imported foods, 553 fast foods, and 259 nutritional supplements, was used. In the end, two 24-hour recalls were collected from 3,976 individuals through the 2001 KNHNS and the 2002 KNNSS. The two-day intake data were used to estimate within-individual variance, and all of the one-day intake data of the 2001 KNHNS were used to estimate the percent of subjects with inadequate and excessive intake in reference to 2005 KDRIs.
Estimation of usual intake distribution
The X-Windows-based version of the Software for Intake Distribution Estimation (C-SIDE) (version 1.02, 1996; available from the Center for Survey Statistics and Methodology, Iowa State University, Ames, IA, USA) along with an additional guidebook were used to estimate the usual intake distribution [17-19] adjusted by within-individual variations.
A three-step process ensued to produce the results of the present study.
1. Within-individual variances were estimated by C-SIDE for each nutrient for gender/age subgroups using the two-day intake data derived from the 2001 KNHNS and the 2002 KNNSS.
2. One-day intake from the 2001 KNHNS was analyzed with C-SIDE using the within-individual variance estimated from step 1 as outer inputs in order to calculate the estimated adjusted intake distribution [20].
3. C-SIDE was used to estimate nutritional adequacy of the population in reference to the KDRIs.
Assessment of nutrient intakes
According to the definition of KDRIs, nutritional inadequacy of the population was assessed for individual nutrient for which Korean EARs and Korean ULs reference values had been established. For assessment of sodium intake, the WHO/FAO’s
Mean SDa Intake distribution percentiles
5th 10th 25th 50th 75th 90th 95th
Protein (g) One-dayb 71.5 41.2 25 32 45 63 88 120 145
Adjustedc 71.5 27.7 40 45 55 68 84 102 115
Vitamin A (μg RE) One-day 620 777 110 163 278 466 763 1,173 1,537
Adjusted 613 357 299 345 436 563 730 934 1,094
Vitamin C (mg) One-day 132 116 19 29 54 101 175 270 359
Adjusted 132 61 63 74 95 125 161 201 228
Thiamin (mg) One-day 1.3 0.8 0.4 0.5 0.8 1.1 1.6 2.2 2.8
Adjusted 1.3 0.5 0.7 0.8 1.0 1.2 1.5 1.8 2.1
Riboflavin (mg) One-day 1.1 0.7 0.4 0.5 0.7 1.0 1.4 1.9 2.3
Adjusted 1.1 0.4 0.6 0.7 0.9 1.1 1.3 1.6 1.8
Niacin (mg) One-day 16.7 11.2 5.0 6.6 9.7 14.2 21.0 29.3 36.3
Adjusted 16.7 6.9 8.7 10.0 12.4 15.7 19.9 24.7 28.2
Calcium (mg) One-day 499 331 138 187 285 430 627 871 1,069
Adjusted 498 195 281 318 386 476 585 706 791
Phosphorus (mg) One-day 1,166 561 469 583 788 1,076 1,437 1,861 2,174
Adjusted 1,166 391 693 777 931 1,126 1,356 1,604 1,776
Iron (mg) One-day 12.2 9.1 3.4 4.5 6.7 10.1 15.0 21.7 27.7
Adjusted 12.1 5.6 6.1 7.0 8.8 11.3 14.5 18.2 21.0
Sodium (mg) One-day 4,913 3,238 1,222 1,737 2,753 4,295 6,253 8,750 10,814
Adjusted 4,916 1,979 2,431 2,838 3,615 4,648 5,914 7,318 8,313
Carbohydrate (%E)d One-day 66.8 11.3 41.3 46.2 52.0 60.1 67.7 74.8 80.6
Adjusted 66.8 6.5 53.0 55.5 58.2 62.6 67.1 71.4 74.9
Protein (%E)d One-day 14.7 4.4 8.6 9.2 10.1 11.9 14.0 16.7 19.8
Adjusted 14.7 2.0 11.3 11.8 12.4 13.3 14.5 15.9 17.3
Fat (%E)d One-day 18.5 9.5 3.9 5.2 7.2 11.5 17.4 24.0 31.0
Adjusted 18.5 5.5 9.0 10.2 11.7 14.6 18.1 21.9 25.7
For all subjects of 1 year of age and older (n = 9,960).
aSD = standard deviation
b1-day diet intake from Korean National Health and Nutrition Survey, 2001
cISU method applied to one-day diet intake
dPercentage of total energy intake (%E) was calculated by using Atwater coefficient (Carbohydrate = 4 kcal/g, Protein = 4 kcal/g, Fat = 9 kcal/g).
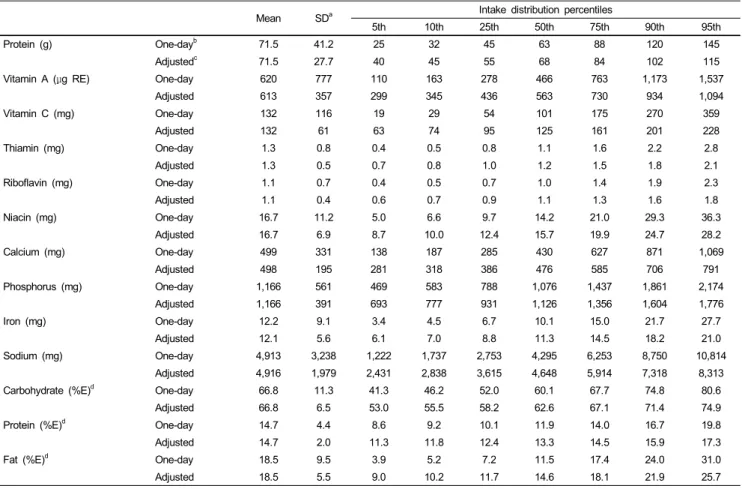
Table 1. Percentile distribution of major nutrient intake and percentage of energy sources: 2001 Korean National Health and Nutrition Survey
Intake Goal to prevent chronic disease, i.e., less than 2000 mg/day, was used.
The usual intake distributions of ten micronutrients and three macronutrients were calculated: protein, vitamin A, vitamin C, thiamin, riboflavin, niacin, calcium, phosphorus, sodium, iron, carbohydrate, protein, and fat. The macronutrients were applied with the Atwater coefficients, calculated % energy contribution for comparison with the Korean Acceptable Macronutrient Distribution Ranges (Korean AMDR).
Statistical analysis
The percentage of subjects whose one day intake was inadequate or in excess in reference to the KDRIs was computed using the SAS program (version 9.1, 2002, SAS Institute, Inc., Cary, NC, USA). The prevalence of nutritional inadequacy and excess was estimated based on usual intake distributions produced by the ISU method as described above. Percentage of subjects whose intake was less than the Korean EARs, above the Korean ULs, and below and above the Korean AMDR was calculated using C-SIDE software. The ten micronutrients analyzed and compared
to the Korean EARs or the Korean ULs in this study are presented based on estimates of usual intake distributions: mean, standard deviation, and intakes at the 5th, 10th, 25th, 50th, 75th, 90th and 95th percentiles.
Results
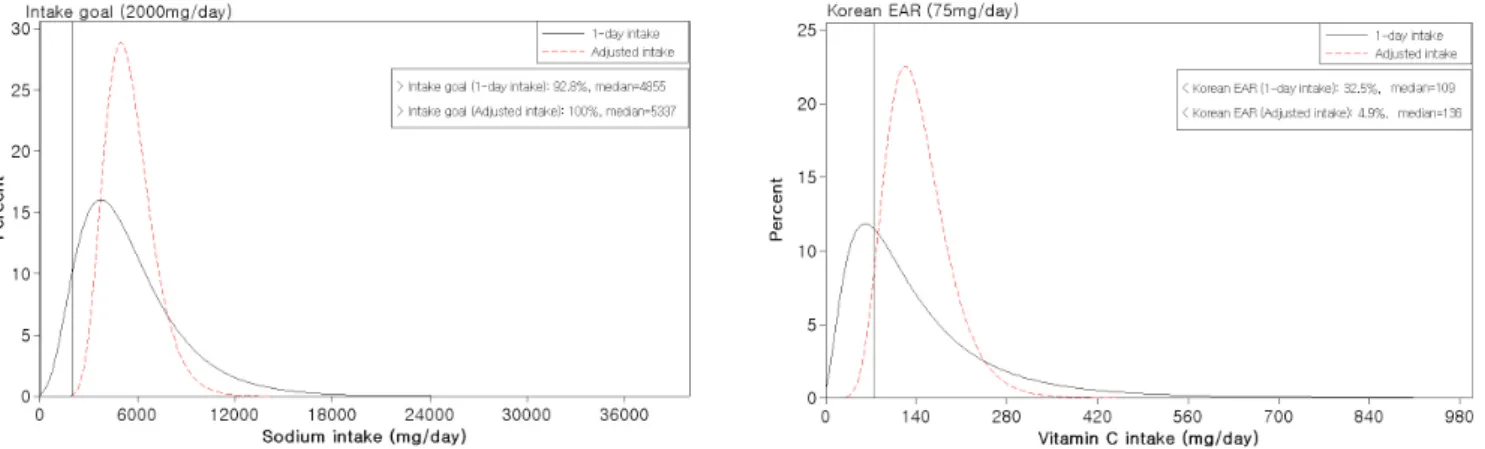
Comparison between the two distributions of the adjusted intake using the ISU method and unadjusted one-day intake is shown in Table 1. Total population includes everyone over one year of age (n = 9,960). The variances in intake distribution of all nutrients and percentage of energy source examined became smaller when adjusted for within-individual variance as compared to the one-day intake distribution. The usual intake distribution changes in vitamin C and sodium, which exhibited remarkable differences before and after adjusting, in those aged over 20 years using the 2001 KNHNS are presented as examples. Fig. 2 shows the comparison of vitamin C and sodium intake distributions before and after adjusting for within-individual variations using the ISU method. The distribution curves of the adjusted 24-hour
Fig. 2. Comparison between one 24-hour recall (solid line) and adjusted daily intakes (dashed line) using the ISU method to estimate adequacy of vitamin C and sodium intakes in Korean adults (> 20 years old): 2001 Korean National Health and Nutrition Survey. Sodium Intake Goal: < 2,000 mg/day
Sample size
Percent of subjects below Korean EAR
Protein Vitamin A Vitamin C Calcium Ironb
One-dayc Adjustedd One-dayc Adjustedd One-dayc Adjustedd One-dayc Adjustedd One-dayc Adjustedd Males and females:
1 to 2 yrs 242 5 0 33 14 29 7e 29 11 49 26
3 to 5 yrs 499 3 0 30 10 25 0e 55 50 40 22
Males:
6 to 8 yrs 275 2 0 33 9 23 0 66 75 46 28
9 to 11 yrs 322 3 0 39 5 30 0 61 64 49 29
12 to 14 yrs 248 7 0 56 10 47 3 88 96 44 31
15 to 19 yrs 321 13 2 55 0 49 19 88 97 57 51
20 to 29 yrs 560 14 0 46 14 38 7 68 82 25 2
30 to 49 yrs 1,641 9 0 38 12 29 4 62 55 14 1
50 to 64 yrs 643 11 1 44 24 31 3 64 60 20 4
over 65 yrs 354 24 10 62 57 44 22 72 71 36 19
over 20 yrsf 3,198 11 1 43 20 33 6 64 62 20 4
Females:
6 to 8 yrs 244 3 0 41 11 25 1 80 87 52 34
9 to 11 yrs 272 4 0 39 17e 32 2 72 81e 61 51
12 to 14 yrs 232 6 0 52 32e 34 7 87 97 53 41
15 to 19 yrs 327 15 0 60 55e 46 0 91 100 75 77
20 to 29 yrs 696 14 0 48 10 35 4 73 86 59 50
30 to 49 yrs 1,765 11 0 46 8 27 1 71 78 50 35
50 to 64 yrs 757 18 1 51 23 29 1 72 77 26 4
over 65 yrs 562 33 19 69 66 48 22 82 87 41 26
over 20 yrsf 3,780 16 1 51 20 32 4 73 80 46 30
over 1 yrsf 9,960 12 2 46 19 33 5 70 73 39 24
aThe Korean EAR is the median requirement of nutrients.
bComparison to Korean EAR determined using probability approach
cOne-day diet intake from 2001 Korean National Health and Nutrition Survey
dISU method applied to one-day diet intake
eThe within-individual variances for “All persons over 1 year” were used to estimate adjusted intake distribution.
fFor different Korean EARs across the age/gender subgroups, the weighted average was used based on the sample size of each age/gender subgroup.
Table 2. Percentage of subjects whose intake was below the 2005 Korean Estimated Average Requirement (Korean EARa): 2001 Korean National Health and Nutrition Survey
recall data were taller and narrower than the unadjusted one 24-hour recall data. The prevalence of vitamin C inadequacy decreased to 4.9% after the adjustment compared to 32.5% when one 24-hour recall was used. Before adjustment of 24-hour recall
distribution, the proportion of population with excessive sodium intake was 92.8%, however, in the adjusted 24-hour recall distribution, almost all subjects’ intakes were over the Intake Goal (< 2,000 mg/day).
Sample size
Percent of subjects above Korean UL
Vitamin A Sodiumb Iron
One-dayc Adjustedd One-dayc Adjustedd One-dayc Adjustedd
Males and females:
1 to 2 yrs 242 17 17 - - 2 0
3 to 5 yrs 499 10 1 - - 0 0
Males:
6 to 8 yrs 275 5 1 - - 1 0
9 to 11 yrs 322 4 0 84 100 0 0
12 to 14 yrs 248 1 0 92 100 0 0
15 to 19 yrs 321 1 0 93 100 1 0
20 to 29 yrs 560 1 0 96 100 1 0
30 to 49 yrs 1,641 2 0 98 100 1 0
50 to 64 yrs 643 1 0 96 100 2 0
Over 65 yrs 354 1 0 90 100 2 0
Over 20 yrsf 3,198 1 0 96 100 1 0
Females:
6 to 8 yrs 244 5 0 - - 0 0
9 to 11 yrs 272 1 0e 82 100 0 0
12 to 14 yrs 232 0 0e 88 100 0 0
15 to 19 yrs 327 0 0e 86 100 1 0
20 to 29 yrs 696 1 0 89 100 1 0
30 to 49 yrs 1,765 1 0 92 100 1 0
50 to 64 yrs 757 1 0 90 100 1 0
Over 65 yrs 562 0 0 82 99 2 0
Over 20 yrsf 3,780 1 0 90 100 1 0
Over 1 yrsf 9,960 2 1 92 100 1 0
aThe Korean UL is the highest level of daily nutrient intake that is likely to pose no risk of adverse effects on human health.
bThe Korean UL was not established for sodium; therefore, sodium was compared with Intake Goal (2,000 mg/day) of KDRIs.
cOne-day diet intake from Korean National Health and Nutrition Survey, 2001.
dISU method applied to one-day diet intake.
eThe within-individual variance for “All persons over 1 year” were used to estimate adjusted intake distribution.
fWhen the Korean ULs differed across the composite age groups of over 20 years for males and females and the over one-year group, the weighted average was used based on the sample size of each age/gender subgroup.
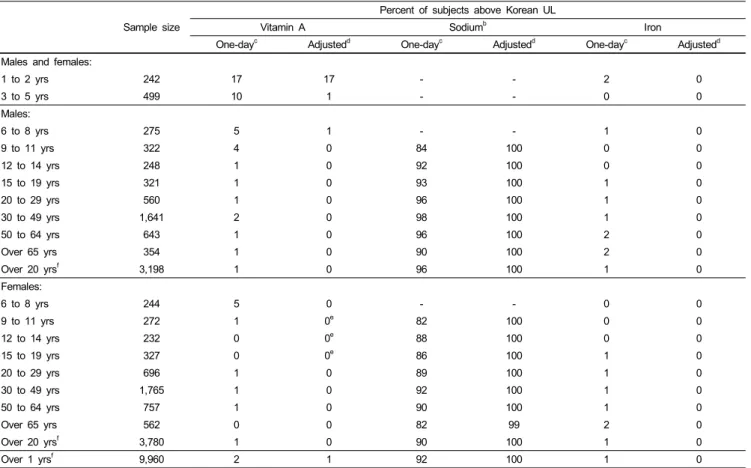
Table 3. Percentage of subjects whose intake was above the 2005 Korean Tolerable Upper Intake Level (Korean ULa): 2001 Korean National Health and Nutrition Survey
Prevalence of inadequate intake estimated by adjusted intake vs.
one-day intake
The percentage of individuals whose daily intake was below the Korean EARs based on the adjusted data distribution using the ISU method and one-day data are compared in Table 2. In the Korean population, inadequate intake of calcium was most prominent at a rate of 73%. Inadequate intake of riboflavin (data not shown) and iron was also prevalent at rates of 41% and 24%
of the population, respectively. Phosphorus (data not shown) and protein were the nutrients for which the prevalence of inadequate intake was relatively low. Most of the nutrients may be problematic for an elderly subgroup aged over 65 years compared to other gender/age groups. Overall, the prevalence of inadequate intake diminished after adjusting for within-individual variations, with the exception of calcium. Among the nutrients showing the largest changes before and after adjusting for within-individual variations, vitamins C and A exhibited differences of 28% and 27.3%, respectively.
Prevalence of excess intake estimated before and after adjusting for within-individual variations
The percentages of subjects whose intakes were above the Korean ULs for two nutrients and above the Intake Goals for sodium were compared based on adjusted intake distribution and one-day intake (Table 3).
Excessive intakes over the Korean ULs did not surface seriously for the nutrients studied in most subgroups. However, sodium intake exceeded the Intake Goal in nearly 100% of all subgroups.
Interestingly, the percentage of population whose intake exceeded the upper intake levels was higher in the 1-2 years group than in the other age groups. Overall, the proportion of subjects whose intake was excessive decreased when the adjusted intake was used compared to one-day intake. Conversely, the proportion of the population whose sodium intake exceeded the Intake Goal was higher when adjusted intake was used compared to one-day intake. This is because the variance reduced through adjustment decreased the size of the population whose intake fell away from the median. In the case of sodium, however, the one-day intake
Sample size
Percent of subjects below Korean AMDR Percent of subjects above Korean AMDR
Carbohydrate Protein Fat Carbohydrate Protein Fat
One-dayb Adjustedc One-dayb Adjustedc One-dayb Adjustedc One-dayb Adjustedc One-dayb Adjustedc One-dayb Adjustedc Males and females:
1 to 2 yrs 242 26 11 2 0 26 14 18 8 7 2 25 7
3 to 5 yrs 499 15 1 1 0 19 0 28 7 5 0 15 0
Males:
6 to 8 yrs 275 17 1 1 0 17 0 23 2 6 0 16 0
9 to 11 yrs 322 19 1 0 0 18 5 24 1 5 0 20 7d
12 to 14 yrs 248 18 2 0 0 21 2 29 5 7 0 17 2
15 to 19 yrs 321 21 2 0 0 21 0 25 1 9 0 19 1
20 to 29 yrs 560 16 2 0 0 28 7 33 11 11 2 23 9
30 to 49 yrs 1,641 16 1 0 0 40 12 38 13 14 2 20 4
50 to 64 yrs 643 9 0 1 0 58 56 57 51 13 2 10 1
Over 65 yrs 354 5 1 0 0 66 68 63 67 13 2 8 2
Over 20 yrs 3,198 14 3 0 0 44 31 43 31 13 3 17 7
Females:
6 to 8 yrs 244 16 0 0 0 22 9 33 4 8 1 16 6d
9 to 11 yrs 272 17 5 0 0 17 3 24 7 8 0 17 3
12 to 14 yrs 232 16 1 0 0 23 0 27 3 5 1 16 0
15 to 19 yrs 327 14 4 1 0 19 4 26 11 5 0 17 4
20 to 29 yrs 696 18 0 0 0 30 16 35 0 8 0 26 18d
30 to 49 yrs 1,765 11 1 0 0 45 27 46 35 10 1 16 3
50 to 64 yrs 757 6 0 0 0 70 76 68 73 9 1 7 1
Over 65 yrs 562 5 0 1 0 75 84 76 84 9 1 5 0
Over 20 yrs 3,780 10 2 0 0 52 46 53 50 9 1 14 5
Over 1 yrs 9,960 14 1 0 0 40 26 42 33 10 1 16 6
aThe Korean AMDR is the recommended distribution of energy among macronutrients (Carbohydrate, protein, fat).
bOne-day diet intake from Korean National Health and Nutrition Survey, 2001
cISU method applied to one-day diet intake.
dThe within-individual variance for “All persons over 1 year” were used in order to estimate adjusted intake distribution.
Table 4. Percentage of subjects whose intake was below and above than 2005 Korean Acceptable Macronutrient Distribution Range (Korean AMDRa): 2001 Korean National Health and Nutrition Survey
of most subjects was already higher than that of the Intake Goal, and thus reduction in variance by the adjustment process reduced those whose intake fell below the Intake Goal.
Prevalence of inadequacy and excess intake of macronutrients estimated before and after adjusting for within-individual variations
The percentage of the population whose intake of macronutrients was under and over the Korean AMDR is summarized in Table 4. According to the 2001 KNHNS, carbohydrates were the primary source of energy, with 67% of daily energy derived from carbohydrates. The percentage of energy intake from carbohydrates exceeded the Korean AMDR (55-70%) in all women over 20 years of age and particularly in older women over 65 years of age, constituting 50% and 84%, respectively. Conversely, the percentage of subjects whose energy intake from fat was less than the Korean AMDR level was high in women and older women, constituting 46% and 84%, respectively. The percentage of energy from protein was approximately within the Korean AMDR.
Discussion
In the present study, we estimated the prevalence of nutrient inadequacies and excesses among Koreans compared to KDRIs before and after adjusting for within-individual variations.
Importantly, we compared the estimated prevalence by one-day intake data versus by usual intake data adjusted by the ISU method. In both approaches, the intakes of calcium, iron, riboflavin, and vitamin A were inadequate, whereas intake of sodium was excessive. In addition, high intake of carbohydrates and low intake of fat were determined by calculating the energy composition ratio of macronutrients.
Inadequate intake of calcium and iron in Koreans has been reported in several studies using non-representative samples [21-23]. Inadequate intake of calcium and riboflavin has also been reported in the population survey of the Korean National Nutrition Survey (KNSS) conducted from 1969 to 1989. The trends of nutrient intake based on the KNNS for the 20-year period [24] indicated inadequate intake levels of calcium and riboflavin as well as adequate intake of thiamin, niacin, and vitamin C. Based on the 2001 KNHNS dietary survey data, the
Korean Ministry of Health and Welfare reported that calcium intake was inadequate for the entire population, whereas intake levels of vitamin A and riboflavin were inadequate for the population aged over 65 years [15]. At that time, the Recommended Dietary Allowance for Koreans (Korean RDA) was used to assess the percentage of the population whose intake was inadequate (<
75% of the Korean RDA) or excessive (> 125% of the Korean RDA). Consistent with the aforementioned reports, the problematic nutrients identified in our study were the same, though the percentage of the population whose intake was at risk differed.
In the present study, the adjusted intake distribution decreased the percentage of the population whose intake was below the Korean EARs by 8.8-28% compared to that assessed by one-day intake data. Only calcium demonstrated the opposite result; the percentage of the population whose intake of calcium was below the recommended increased by 3.2%. These increased proportions of inadequacies after controlling for within-individual variations have also been reported elsewhere [25,26], especially for some nutrients for which the median intake lies far below the EAR, regardless of the statistical approaches or software used.
Consistent with previous reports, Koreans in the present study consumed a higher percentage of energy from carbohydrates (67%) and a lower percentage from fat (19%) compared to the Korean AMDR. Park et al. [27] reported that the percentage of energy from carbohydrates decreased, whereas those from protein and fat increased in Korea from 1969 to 1988. They also reported that the percentages of energy intake from carbohydrates, protein, and fat were 67:19:14%, respectively, in 1988. Based on these data, we can conclude that the energy distribution of macronutrients has stabilized in Korea but remains higher than the Korean AMDR in adults. In addition, the percentage of energy derived from fat appears to have remained low for Korean adults relative to the Korean AMDR, although it has trended upward over time. Garriguet in Canada [28] reported in 2007 a composition ratio of macronutrients of 51:17:32% for carbohydrates, protein, and fat, respectively, in a study involving more than 35,000 subjects from the Canadian Community Health Survey data of 2004 using C-SIDE software.
Koreans have one of the highest rates of total 24-hour urinary sodium excretion in the world [29], and stomach cancer is the second most prevalent cancer death in Korea. In addition, approximately 30% of the adult population has hypertension [30].
Many epidemiological, clinical, and experimental studies have proposed that high intake of dietary salt is related to the prevalence of hypertension and stomach cancer [31-33]. Therefore, recommendations to decrease salt intake are common worldwide [34]. Researchers have also identified a dietary pattern that takes in a great deal of salt from food in Korea [35,36]. The KDRIs nevertheless include an Intake Goal of sodium (< 2,000 mg/day) for the prevention of chronic diseases. In this study, we also confirmed that the proportion of excessive sodium intake was unacceptably high. Excessive sodium intake in the diet of Koreans remains a serious public health concern.
Except for iron and niacin, the proportion of the population
whose intake exceeded the Korean ULs was very low. Vitamin A was the only nutrient in which a small proportion of the population exceeded the Korean ULs. This result is, however, based solely on food intake, which represents one of the limitations of the present study. When food intake is combined with supplements, the proportion exceeding the Korean ULs will likely increase. It is expected that public health issues surrounding excessive intake of certain nutrients in the Korean population will soon surface.
In the present study, under-reporting or over-reporting dietary intake by the survey population could not be delineated. Goldberg criteria have been commonly used to correct the overall bias of under-reporting at the group level [37], but information that can classify individuals into three categories relative to energy expenditure was not available from the 2001 KNHNS. Another limitation of this study was that seasonal variations were not taken into account. The dietary data used in this study were collected during different seasons; therefore, it would have been appropriate to remove the effect of seasonal variation. Moreover, the ISU method was designed to take into account the sequence of observations, such as the day of the week or time of year.
However, the overlapping dietary data from the 2001 KNHNS and 2002 KNNSS were merged to create two-day dietary data without considering the season, day of the week, or time of year.
Through the merging process, two-day dietary data from different seasons were regarded as a single dataset to estimate within- individual variation. In spite of this limitation, the present study is one of the first studies to estimate typical nutrient intake levels among a representative Korean population and determine the prevalence of nutritional inadequacies and excesses that are associated with within-individual variation.
In this study, we confirmed that estimated prevalence of inadequate intake based on one-day intake results in over or under- estimation, since within-individual variation is not considered.
In the Korean population, average intakes of calcium and riboflavin were the most inadequate, whereas sodium intake was the most excessive. Adequate dietary intakes of Koreans were observed for protein, phosphorous, and percentage energy from protein. After adjusting for within-individual variation, the magnitude of inadequacy decreased for most nutrients. Researchers interested in estimating the percentage of persons below or above a certain standard should keep in mind that one 24-hour recall could be misleading in terms of within-individual variation. To achieve an optimal state of public health in Korea, nutrients that were inadequately consumed in this study should be managed by nutritional policy and be made known in the hopes of stimulating interest regarding this topic.
Reference
1. Freudenheim JL, Marshall JR. The problem of profound mismeasurement and the power of epidemiological studies of diet
and cancer. Nutr Cancer 1988;11:243-50.
2. Hebert JR, Miller DR. Methodologic considerations for investigating the diet-cancer link. Am J Clin Nutr 1988;47:1068-77.
3. Subar AF, Thompson FE, Kipnis V. Respond to "A further look at dietary questionnaire validation" and "Another perspective on food frequency questionnaires". Am J Epidemiol 2001;154:
1105-6.
4. Basiotis PP, Welsh SO, Cronin FJ, Kelsay JL, Mertz W. Number of days of food intake records required to estimate individual and group nutrient intakes with defined confidence. J Nutr 1987;
117:1638-41.
5. Subar AF, Kipnis V, Troiano RP, Midthune D, Schoeller DA, Bingham S, Sharbaugh CO, Trabulsi J, Runswick S, Ballard- Barbash R, Sunshine J, Schatzkin A. Using intake biomarkers to evaluate the extent of dietary misreporting in a large sample of adults: the OPEN study. Am J Epidemiol 2003;158:1-13.
6. Kipnis V, Subar AF, Midthune D, Freedman LS, Ballard-Barbash R, Troiano RP, Bingham S, Schoeller DA, Schatzkin A, Carroll RJ. Structure of dietary measurement error: results of the OPEN biomarker study. Am J Epidemiol 2003;158:14-21.
7. Freedman LS, Midthune D, Carroll RJ, Krebs-Smith S, Subar AF, Troiano RP, Dodd K, Schatzkin A, Bingham SA, Ferrari P, Kipnis V. Adjustments to improve the estimation of usual dietary intake distributions in the population. J Nutr 2004;134:1836-43.
8. Byers T. Food frequency dietary assessment: how bad is good enough? Am J Epidemiol 2001; 154: 1087-8.
9. Dodd KW, Guenther PM, Freedman LS, Subar AF, Kipnis V, Midthune D, Tooze JA, Krebs-Smith SM. Statistical methods for estimating usual intake of nutrients and foods: a review of the theory. J Am Diet Assoc 2006; 106:1640-50.
10. Dwyer J, Picciano MF, Raiten DJ. Estimation of usual intakes:
What We Eat in America-NHANES. J Nutr 2003;133:609S-623S.
11. Hoffmann K, Boeing H, Dufour A, Volatier JL, Telman J, Virtanen M, Becker W, De Henauw S; EFCOSUM Group.
Estimating the distribution of usual dietary intake by short-term measurements. Eur J Clin Nutr 2002;56:S53-62.
12. The Korean Nutrition Society. Dietary Reference Intakes for Koreans. Seoul, South Korea: The Korean Nutrition Society;
2005 (in Korean).
13. Barr SI, Murphy SP, Poos MI. Interpreting and using the dietary references intakes in dietary assessment of individuals and groups. J Am Diet Assoc 2002;102:780-8.
14. Chang HY, Suchindran CM, Pan WH. Using the overdispersed exponential family to estimate the distribution of usual daily intakes of people aged between 18 and 28 in Taiwan. Stat Med 2001;20:2337-50.
15. Korean Ministry of Health and Welfare. Report on 2001 National Health and Nutrition Survey. Ministry of Health and Welfare;
2002 (in Korean).
16. Korean Ministry of Health and Welfare. Report on 2002 National Nutrition Survey by Season. Ministry of Health and Welfare;
2002 (in Korean).
17. Dodd KW. A User's Guide to C-SIDE: Software for Intake Distribution Estimation. Version 1.02. CARD Technical Report 96-TR32. Ames, IA: Center for Agricultural and Rural Development, Iowa State University; 1996.
18. Dodd KW. A Technical Guide to C-SIDE. Dietary Assessment Research Series Report 9. CARD Technical Report 96-TR32.
Ames, IA: Center for Agricultural and Rural Development, Iowa State University; 1996.
19. Nusser SM, Carriquiry AL, Dodd KW, Fuller WA. A semipara- metric transformation approach to estimating usual daily intake distributions. J Am Stat Assoc 1996;91:1440-9.
20. US Department of Agriculture, Agricultural Research Service FSRG, Beltsville Human Nutrition Research Center [Internet].
What we eat in America, NHANES 2001-2002: usual nutrient intakes from food compared to dietary reference intakes;
[Accessed on 2010 December 25]. Available from: http://www.
ars.usda.gov/SP2UserFiles/Place/12355000/pdf/0102/usualintaket ables2001-02.pdf.
21. Lee EJ, Kim MH, Cho MS, Kim YJ, Kim WY. A study on nutrient intakes and hematological status in women of childbearing age: comparison between non-pregnant and pregnant women.
Korean J Nutr 2003;36:191-199 (in Korean).
22. Park SY, Paik HY, Skinner JD, Spindler AA, Park HR. Nutrient intake of Korean-American, Korean, and American adolescents.
J Am Diet Assoc 2004;104:242-5.
23. Kim HS, Kim JS, Kim NS, Kim JH, Lee BK. Association of vitamin D receptor polymorphism with calcaneal broadband ultrasound attenuation in Korean postmenopausal women with low calcium intake. Br J Nutr 2007;98:878-81.
24. Park MA, Kim ES, Lee KH, Moon HK, Song IJ, Tchai BS. The trend of food and nutrient intakes of Korean (1969~1989) – The third report, nutrient intake from the annual report of the National Nutrition Survey -. J Korean Soc Food Nutr 1992;21:655-661 (in Korean).
25. Mackerras D, Rutishauser I. 24-Hour national dietary survey data: how do we interpret them most effectively? Public Health Nutr 2005;8:657-65.
26. Ishiwaki A, Yokoyama T, Fujii H, Saito K, Nozue M, Yoshita K, Yoshiike N. A statistical approach for estimating the distribution of usual dietary intake to assess nutritionally at-risk populations based on the new Japanese Dietary Reference Intakes (DRIs). J Nutr Sci Vitaminol (Tokyo) 2007;53:337-44.
27. Park YJ, Choi BS, Seo YJ. Comparative studies on food consumption pattern between Korea and Japan - I. Annual change of nutrient intake -. J Korean Soc Diet Cult 1992;7:65-72 (in Korean).
28. Garriguet D. Canadians' eating habits. Health Rep 2007;18:17-32.
29. Joossens JV, Hill MJ, Elliott P, Stamler R, Lesaffre E, Dyer A, Nichols R, Kesteloot H. Dietary salt, nitrate and stomach cancer mortality in 24 countries. European Cancer Prevention (ECP) and the INTERSALT Cooperative Research Group. Int J Epidemiol 1996;25:494-504.
30. Korean Ministry of Health and Welfare. The third Korea National Health and Nutrition Examination Survey (KNHNES III), 2005 - Health Examination -. Ministry of Health and Welfare; 2006 (in Korean).
31. Frohlich ED, Varagic J. The role of sodium in hypertension is more complex than simply elevating arterial pressure. Nat Clin Pract Cardiovasc Med 2004;1:24-30.
32. Tsugane S, Sasazuki S. Diet and the risk of gastric cancer: review of epidemiological evidence. Gastric Cancer 2007;10:75-83.
33. Dias-Neto M, Pintalhao M, Ferreira M, Lunet N. Salt intake and risk of gastric intestinal metaplasia: systematic review and meta-analysis. Nutr Cancer 2010;62:133-47.
34. Karppanen H, Mervaala E. Sodium intake and hypertension. Prog Cardiovasc Dis 2006;49:59-75.
35. Son SM, Park YS, Lim HJ, Kim SB, Jeong YS. Sodium intakes of Korean adults with 24-hour urine analysis and dish frequency
questionnaire and comparison of sodium intakes according to the regional area and dish group. Korean J Community Nutr 2007;
12:545-58.
36. Park HR, Jeong GO, Lee SL, Kim JY, Kang SA, Park KY, Ryou HJ. Workers intake too much salt from dishes of eating out and food service cafeterias; direct chemical analysis of sodium content.
Nutr Res Pract 2009;3:328-33.
37. Goldberg GR, Black AE, Jebb SA, Cole TJ, Murgatroyd PR, Coward WA, Prentice AM. Critical evaluation of energy intake data using fundamental principles of energy physiology: 1.
Derivation of cut-off limits to identify under-recording. Eur J Clin Nutr 1991;45:569-81.