http://dx.doi.org/10.7585/kjps.2015.19.3.151
Open Access
151
가락동 농수산물도매시장 반입 들깻잎과 상추의 잔류농약 실태 및 안전성 평가
박원희*·황인숙·김은정·조태희·홍채규·이재인·최수정·김진아·이윤정·김미선·김지혜·김무상 서울시보건환경연구원 강남농수산물검사소 농산물검사팀
Pesticide Residues Survey and Safety Evaluation for Perilla Leaf &
Lettuce on the Garak-dong Agricultural & Marine Products Market
Won-Hee Park *, In-Sook Hwang, Eun-Jeong Kim, Tae-Hee Cho, Chae-Kyu Hong, Jae-In Lee, Su-Jeong Choi, Jin-A Kim, Yun-Jeong Lee, Mi-Sun Kim, Gi-Hae Kim and Moo-Sang Kim
Agricultural Products Inspection Team, Gangnam Agro-marin Products Inspection Center, Seoul Metropolitan Government Research Institute of Public Health and Environment
(Received on December 2, 2014. Revised on August 10, 2015. Accepted on September 18, 2015)
Abstract This study was conducted to monitor residual pesticides in perilla leaf & lettuce and to assess their risk to human health. The total number of perilla leaf & lettuce were 4,063 and 2,248 respectively and these products were collected at the Garak-dong Agricultural & Marine Products Market sold by auction from 2010 to 2012. Multi-residual analysis of 285 pesticides were performed by GC-ECD, GC-NPD, HPLC-DAD and HPLC-FLD. In perilla leaf, 61 pesticides were detected and detection rate was 20.0%. 28 pesticides were detected in case of lettuce and detection rate was 4.8%. In order to do risk assessment by perilla leaf &
lettuce consumption, estimated daily intake of residual pesticides were determined and compared to acceptable daily intake, referring to hazard index (HI values). The range of % HI values of perilla leaf was from 0.000% to 0.049%. The range of % HI values of lettuce was from 0.000% to 0.095%. These results show that the risk caused by pesticide residues in perilla leaf & lettuce intake were very low and these vegetable intake was safe.
Key words Perilla leaf & lettuce, Pesticide residues, Hazard index
서 론
최근 소비자가 가장 선호하는 농산물은 안전농산물로, 유 기농산물 생산량이 2001년 0.4%에서 2009년 12.2%로 증가 한 것처럼 과거 다수확 및 고품질의 시대에서 패러다임의 변화가 급격하게 이루어지고 있다(Namgung et al., 2014).
이렇듯 유기농 등 친환경농법으로 재배하는 농산물이 증가 하고는 있지만 일반 채소류 재배에 농약의 사용을 완전히 배재할 수는 없다.
농약은 사용목적에 따라 살균제, 살충제, 제초제 등으로 분류되며, 이들은 각각 대상 생물체에 작용점과 작용기작에
의해 독성을 유발시킨다. 농약의 독성은 독성의 발현 속도 에 따라 급성독성, 아급성독성, 만성독성으로 구분한다.
농산물에 잔류하는 농약은 적은 양으로 농산물의 1일 섭 취량을 고려하면 급성독성을 일으킬 가능성은 매우 낮으나 농산물을 비롯한 식품은 일생동안 섭취하기 때문에 검출빈 도와 그 수준이 높아질수록 농약의 만성독성이 문제될 수 있다(Kim et al., 2009).
위해평가란 인체가 식품에 존재하는 생물학적, 화학적, 물 리적 위험원 등의 위해요소에 노출되었을 때 유해영향발생 확률을 과학적으로 예측하는 일련의 과정으로 위험확인, 위 험결정, 노출평가와 위해도 결정의 4단계를 말한다.
1968 년부터 우리나라에서는 식품 중 잔류농약 모니터링 을 시작하였으며(Do et al., 2010), 1990년도에 미국에서 이
*Corresponding author E-mail: [email protected]
ORIGINAL ARTICLES / RESIDUE
루어지고 있는 농약의 법적규제와 안전성 평가에 이용되고 있는 방법들이 우리나라에 소개됨으로써 위해도 평가가 본 격적으로 시작되었다(Lee 1991).
국내 유통 농산물에 대한 잔류농약 모니터링 및 안전성평 가에 관련된 연구를 살펴보면 채소류에서의 농약 검출율이 높으며 그 중에서도 엽채류에서의 위해지수 수치는 안전한 수준이나 상대적으로 높았다(Jang et al., 2011). 들깻잎과 상추는 시민들이 육류와 더불어 가장 많이 섭취하는 쌈채소 류로서 조리가공 등의 과정을 거치지 않고 대부분 생식으로 섭취하게 된다(Choi, 2006, Chung H. J. and H. S. Cheon, 2012). 따라서 본 연구는 2010년부터 2012년까지 서울시 공 영도매시장 내 경매용으로 반입된 들깻잎과 상추를 대상으 로 검출된 잔류농약의 실태를 조사하고 그 결과를 토대로 검출농약에 대한 섭취량을 추정하여 소비자들에게 위의 쌈 채류 섭취에 따른 잔류농약의 안전성 평가를 통해 농약의 유해성 평가를 위한 기초자료로 활용하고자 하였다.
재료 및 방법
재료
2010 년부터 2012년까지 서울시 공영도매시장의 하나인 가락동 농수산물도매시장에 경매용으로 반입된 농산물 중 들깻잎 4,063건, 상추 2,248건을 대상으로 잔류농약을 분석 하였다.
표준품 및 시약
잔류농약 분석용 표준품은 Dr. Ehrenstorfer GmbH (Germany)와 Wako (Japan)를 구입하여 사용하였고 추출 및 정제 용매인 acetone, dichloromethane, hexane은 Kanto (Japan) 제품을 사용하였고 acetonitrile, methanol은 Burdick
& Jackson(USA), NaCl 은 Merck(Denmark)을 사용하였다.
정제카트리지는 가스크로마토그래피분석을 위해 Florisil cartridge (Agilent technologies, 6 cc, 1 g), 액체크로마토그
래피는 NH
2cartridge (Agilent technologies, 6 cc, 1 g) 를 사 용하였다.
분석방법 및 기기
시료의 전처리 및 분석방법은 식품공전의 식품 중 잔류농 약 분석법 다종농약 다성분 분석법 제2법에 따라 285종 농 약성분을 기체크로마토그래프와 액체크로마토그래프로 동 시 분석하였다. 분석기기는 정성분석을 위해 GC/MSD(Gas Chromatography/Mass Selective Detector)는 6890 series (Agilent사, USA)의 5975 Mass Selective Detector를 사용 하였고, LC/MSD (Liquid Chromatography/Mass Selective Detector)는 1200 series (Agilent사, USA)의 6130 Quadropole Mass Selective Detector를 사용하였다.
정량분석을 위해서 GC/NPD (Gas Chromatograph/ Nitrogen Phosphorous Detector) 와 GC/ECD (Gas Chromatograph/
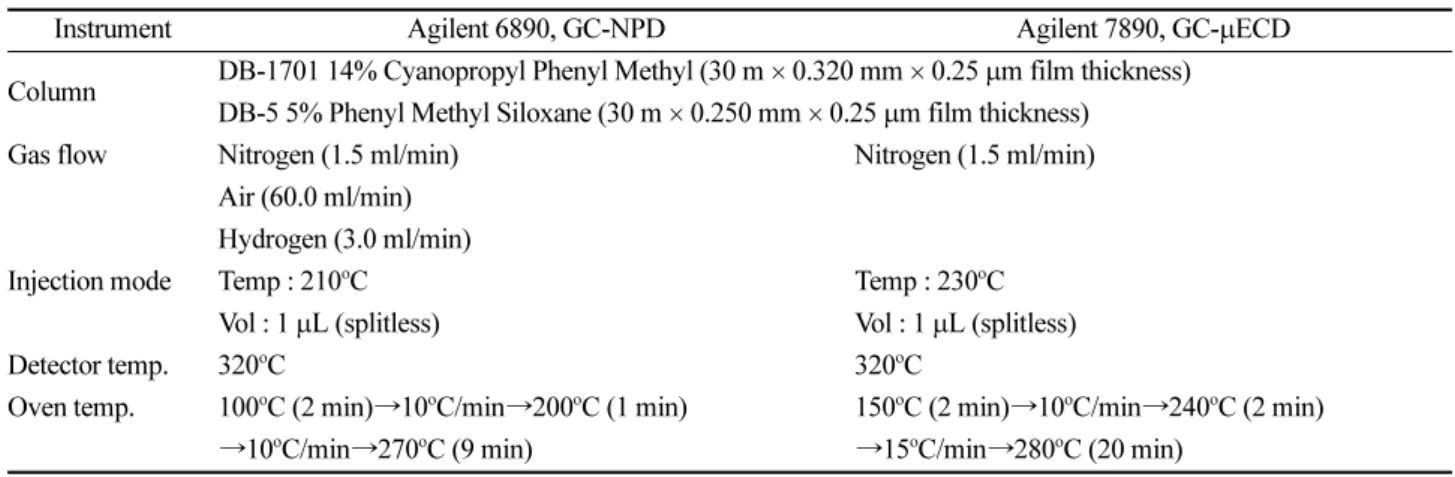
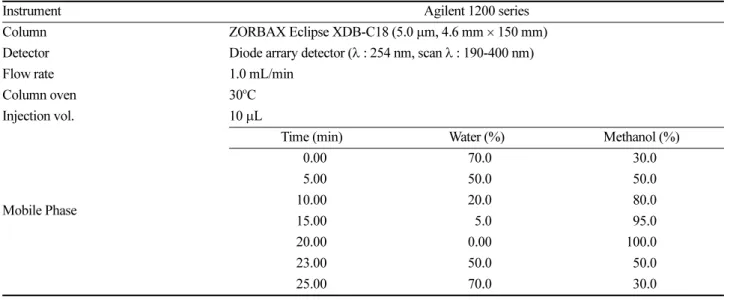
Electron Capture Detector) 는 6890 및 7890 (Agilent사, USA) 를 사용하였고, HPLC/DAD (High Performance Liquid Chromatograph/Diode Array Detector)와 HPLC/FLD (High Performance Liquid Chromatograph/Fluorescence Detector) 는 1200 series (Agilent사, USA)를 사용하였다. 기기분석 조건은 Table 1~5에 나타내었다.
안전성평가
들깻잎과 상추의 일일섭취량은 국민건강영양조사의 식품 별 1인1일 평균섭취량자료를 사용하였으며 들깻잎은 0.0023 kg/per/day, 상추는 0.0051 kg/per/day이었다(MHW, 2008).
또한 평균체중은 CODEX 가이드라인에 따라 잔류 농약 기 준 설정 시 적용하는 아시아인의 평균체중인 55 kg을 적용 하였다.
농약별 ADI (Acceptable Dietary Intake)는 식품의약품안 전처의 잔류농약데이터베이스 자료를 활용하였고(KFDA, 2013), ADI 값이 설정되지 않은 농약은 CODEX나 EU 자료 를 이용하였다.
Table 1. Analytical condition of GC-NPD and GC-ECD
Instrument Agilent 6890, GC-NPD Agilent 7890, GC-μECD
Column DB-1701 14% Cyanopropyl Phenyl Methyl (30 m × 0.320 mm × 0.25 μm film thickness) DB-5 5% Phenyl Methyl Siloxane (30 m × 0.250 mm × 0.25 μm film thickness)
Gas flow Nitrogen (1.5 ml/min) Nitrogen (1.5 ml/min) Air (60.0 ml/min)
Hydrogen (3.0 ml/min)
Injection mode Temp : 210
oC Temp : 230
oC
Vol : 1 μL (splitless) Vol : 1 μL (splitless)
Detector temp. 320
oC 320
oC
Oven temp. 100
oC (2 min)→10
oC/min→200
oC (1 min) 150
oC (2 min)→10
oC/min→240
oC (2 min)
→10
oC/min→270
oC (9 min) →15
oC/min→280
oC (20 min)
들깻잎과 상추를 통해 일일 섭취되는 농약의 추정량(EDI, estimated daily intake) 은 이들 채소류에 포함되어 있는 농약 의 평균잔류량(mg/kg)과 일일 섭취하는 채소류양의 곱이 된 다. 위해평가 지침에 따르면 잔류농약의 평균농도 산출 시 불 검출율이 60% 이상인 경우 불검출건을 0과 검출한계인 LOD (limit of detection) 로 적용하여 각각 하한과 상한으로 산출하 여야 한다(Lee, 2013). 그러나 본 연구에 사용된 잔류농약 모 니터링 자료는 2010년부터 3년간 여러 장비로부터 얻어진 검 출결과로서 성분별 LOD적용이 어려웠다. 한편 식품공전 잔 류농약 분석법 실무해설서 분석법의 검출한계는 잔류허용기 준의 1/2~1/10까지 검출하도록 규정하고 있어 불검출된 시료 의 농도는 농약의 농산물 최저기준치의 1/5에 해당하는 양을 검출한계로 적용하여 농약의 평균잔류량을 산출하였다.
Estimated Daily Intake (mg/day/person) =
Pesticide Average Conc. (mg/kg) × Daily Food Intake (kg/
day/person)
잔류농약이 포함된 채소류 섭취가 안전한 지의 여부는 허 용 가능한 일일농약섭취량 (ADI)와 일일 섭취되는 농약의 추정량(EDI)의 비를 통해 결정할 수 있다(Chun and Kang, 2003).
위해지수(Hazard Index, HI %) = EDI/ADI × 100
결과 및 고찰
들깻잎과 상추의 잔류농약 검출 현황 및 부적합 농약 현황 2010 년부터 3년간 서울 가락동 농수산물도매시장에서 경 매되는 채소류 중 들깻잎은 4,063건 상추는 2,248건의 검사 를 실시하였으며, 이중 들깻잎은 812개 시료에서 농약이 검 출되었고, 그 중 40건은 식품의약품안전처에서 고시한 잔류 허용기준을 초과하여 부적합으로 판명되었다. 한편 상추는 108 건의 시료에서 농약이 검출되었으며, 10건이 부적합으로 처리되었다. 다시 표현하면 잔류농약 검출율은 들깻잎 20.0%, Table 2. Analytical condition of HPLC/DAD
Instrument Agilent 1200 series
Column ZORBAX Eclipse XDB-C18 (5.0 μm, 4.6 mm × 150 mm) Detector Diode arrary detector ( λ : 254 nm, scan λ : 190-400 nm)
Flow rate 1.0 mL/min
Column oven 30
oC
Injection vol. 10 μL
Mobile Phase
Time (min) Water (%) Methanol (%)
0.00 70.0 30.0
5.00 50.0 50.0
10.00 20.0 80.0
15.00 5.0 95.0
20.00 0.00 100.0
23.00 50.0 50.0
25.00 70.0 30.0
Table 3. Analytical condition of HPLC/FLD
Instrument Agilent 1100 series
Column Carbamate analysis column
Detector Fluorescence detector (Exciting λ: 340 nm, Emission λ: 445 nm) Post column Reaction o-phthalaldehyde, 0.05N-NaOH
Flow rate 1.3 mL/min
Injection vol. 20 μL
Mobile Phase
Time (min) 12% Methanol Methanol:Acetonitrile:Water (35:35:30)
0.00 80.0 20.0
5.00 20.0 80.0
8.00 0.00 100.0
9.00 80.0 20.0
10.00 80.0 20.0
Table 4. Pesticide residues detected in perilla leaf Name of pesticide Class No.of
detection
Detection range (mg/kg)
Mean conc. of detection (mg/kg)
MRL (mg/kg)
ADI (mg/kg/day) Analyzed by GC
Bifenthrin Pyrethroid 8 0.058~0.393 0.159 10 0.01
Cadusafos Organophosphate 3 0.006~2.796 0.987 0.05 0.0005
Chlorfenapyr Arylpyrrole 3 0.014~0.279 0.105 7.0 0.026
Chlorothalonil Chloronitrile 13 0.016~3.493 0.670 5.0 0.02
Chlorpyrifos Organophosphate 7 0.007~1.482 0.421 0.01 0.01
Chlorpyrifos-methyl Organophosphate 1 0.015 0.015 0.2 0.01
Cyhalothrin Pyrethroid 3 0.022~0.186 0.241 3.0 0.02
Cypermethrin Pyrethroid 95 0.049~4.251 0.612 5.0 0.02
Diazinon Organophosphate 19 0.007~1.785 0.129 0.1 0.005
Dichlofluanid Sulfamide 2 0.079~0.181 0.130 15 0.3
*Diethofencarb Carbamate 179 0.051~14.568 1.249 10 0.43
Diniconazole Triazole 17 0.027~0.300 0.105 0.05 0.02
Endosulfan Organochlorine 55 0.006~4.166 0.257 0.1 0.006
EPN Organophosphate 2 0.240~4.093 2.167 0.05 0.0014
Ethoprophos Organophosphate 9 0.004~0.854 0.192 0.02 0.0004
Fenarimol Carbamate 2 0.075~0.325 0.199 1.0 0.01
Fenazaquin Pyrimidine 5 0.106~1.020 0.504 3.0 0.1
**Fenbuconazole Triazole 1 0.528 0.528 3.0 0.03
Fenitrothion Organophosphate 3 0.021~0.148 0.076 0.2 0.006
Fenobucarb Carbamate 2 0.124~0.161 0.143 0.5 0.012
Fenvalerate Pyrethroid 4 0.076~0.362 0.254 0.5 0.02
Fludioxonil Phenylpyrrole 23 0.120~9.565 1.620 3.0 0.4
Indoxacarb Oxadiazine 6 0.585~1.899 1.156 20 0.01
Iprobenfos(IBP) Phosphorothiolate 4 0.016~0.150 0.065 0.2 0.035
Iprodione Dicarboximide 4 0.986~24.730 9.713 10 0.06
Isoprothiolane Dithiolane 2 0.030~0.119 0.075 0.2 0.1
Kresoxim-methyl Oximinoacetate 5 0.065~9.615 2.351 0.1 0.4
Metalaxyl Phenylamide 11 0.048~1.257 0.288 0.5 0.08
Methidathion Organophosphate 5 0.007~3.311 1.345 0.2 0.001
Myclobutanil Triazole 12 0.056~3.015 0.531 1.0 0.03
Parathion Organophosphate 1 0.178 0.178 0.3 0.004
Pendimethalin Dinitroaniline 1 0.101 0.101 0.2 0.12
Permethrin Pyrethroid 1 0.606 0.606 3.0 0.05
Pirimicarb Carbamate 3 0.047~0.091 0.065 2.0 0.02
Procymidone Dicarboximide 29 0.032~56.049 3.797 5.0 0.1
Pyridalyl - 1 2.652 2.652 5.0 0.028
Tebuconazole Triazole 2 0.537~1.919 1.228 5.0 0.03
Tebufenpyrad - 118 0.036~1.943 0.319 5.0 0.01
Tetraconazole Triazole 3 0.093~0.147 0.116 15 0.0073
Tolylfluanid Sulfamide 1 0.060 0.060 1.0 0.08
Vinclozolin Dicarboximide 5 0.014~1.492 0.359 2.0 0.01
상추 4.8%이고 부적합율은 들깻잎 1.0%, 상추 0.4%이었다.
이는 김 등이 2010년 국내 유통 중인 관행 및 인증 농산물 중 들깻잎과 상추를 대상으로 잔류농약 110종을 분석한 결과 농약 검출율이 들깻잎 20.6%, 상추 3.1%로 보고한 수치와 비 교해 볼 때 매우 유사한 검출율을 보였다(Kim et al., 2011).
또한 서울 강남지역 농산물의 잔류농약 모니터링 연구 등 을 조사한 결과 부적합율이 2009년에는 1.8%, 2011년에는 1.4% 로 나타나서(Kim et al., 2009; Chae 2012) 본 연구 결 과보다는 다소 높은 수치를 보였는데 이번 검사 대상에는 겨자채, 시금치, 셀러리 등 특이적으로 부적합율이 높은 농 산물이 제외되었기 때문으로 판단된다.
들깻잎에서 검출된 농약종류는 총 61종으로 가스크로마 토그래프 및 질량분석기에서 41종, 액체크로마토그래프에서 20 종이 분석되었다. 동일 들깻잎에서 2종 이상의 농약이 검 출된 것도 있어 1,042건의 농약이 검출되었다. 상추에서 검 출된 농약종류는 총 28종으로 가스크로마토그래프 및 질량 분석기에서 20종, 액체크로마토그래프 및 질량분석기에서 8 종이 분석되었고, 총 118건의 농약이 검출되었다. Table 4를 살펴보면, 들깻잎에서 아족시스트로빈 198회, 디에토펜카브 179 회, 테부펜피라드 118회로 위 3종의 농약이 495회 검출
되어 1,042건의 47.5%를 차지하였다. 디에토펜카브 및 아족 시스트로빈은 항진균제이며, 테부펜피라드는 응애방제에 주 로 적용되는 살충제이다. Table 5는 상추에 대한 농약 사용 실태를 수재하였으며, 엔도설판 19회, 프로시미돈 17회, 디 메토모르프 13회로 조사되었고, 3종 농약의 검출건수는 118 건으로 41.5 %를 차지하였다. 엔도설판은 유기염소계 살충 제이며 디메토모르프는 시나믹 에시드계, 프로시미돈은 디 카복시미드계 살균제로 분류된다.
잔류농약 안전성 평가
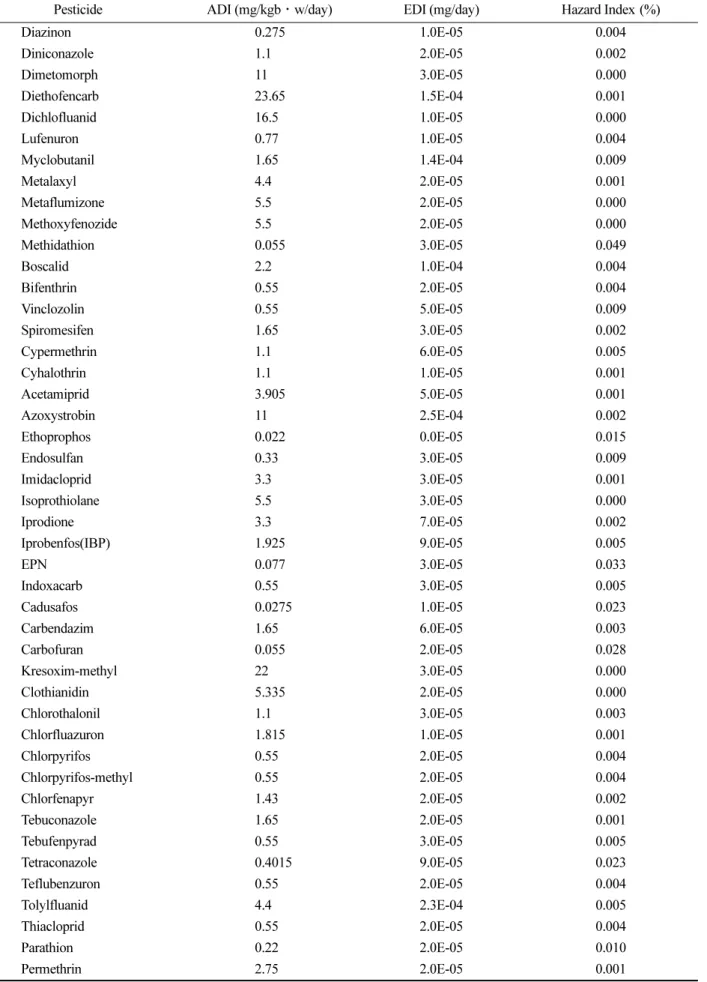
2010 년부터 2012년까지 경매용 들깻잎 및 상추의 잔류농 약 실태조사 결과 검출된 농약성분에 대한 각각의 농약 1일 섭취허용량(ADI, accetable daily intake)을 이용 하여 노출 평가를 실시하였다. 즉 모니터링 결과 검출량을 바탕으로 1 일 추정섭취량(EDI, estimated daily intake)을 계산하여 ADI를 고려할 경우 몇 %에 해당되는 농약 을 섭취하게 되 는지 위해지수(hazard Index, HI %)로 계산하여 Table 6 및 7 에 나타내었다.
들깻잎에서 검출된 농약을 대상으로 노출평가를 실시한 결과 위해지수는 0.000 0.049%로서 안전한 수준이 것으로 Table 4. Pesticide residues detected in perilla leaf (continued)
Name of pesticide Class No.of detection
Detection range (mg/kg)
Mean conc. of detection
(mg/kg)
MRL (mg/kg)
ADI (mg/kg/day) Analyzed by HPLC
Acetamiprid Neonicotinoid 1 0.443 0.443 10 0.071
Azoxystrobin Methoxycaylate 198 0.033~14.585 2.015 20 0.2
Boscalid Carboxamide 4 0.655~4.452 2.747 30 0.04
Carbendazim Benzimidazole 54 0.188~8.010 1.729 20 0.03
Carbofuran Carbamate 1 2.932 2.932 0.1 0.001
Chlorfluazuron Benzoylurea 10 0.113~1.784 0.821 2.0 0.033
Clothianidin Neonicotinoid 2 0.206~0.333 0.270 7.0 0.097
Dimetomorph Organophosphate 13 0.591~3.156 1.607 20 0.2
Fenpyroxymate - 19 0.134~2.736 1.055 7.0 0.01
Flubendiamide - 3 0.854~7.035 4.346 15 0.017
Flufenoxuron Benzoylurea 5 0.286~1.432 0.920 2.0 0.01
Imidacloprid Neonicotinoid 13 0.138~0.733 0.440 7.0 0.06
Lufenuron Benzoylurea 15 0.128~2.368 0.870 7.0 0.014
Metaflumizone - 2 0.836~1.322 1.079 5.0 0.1
Methoxyfenozide Diacylhydrazine 1 2.694 2.694 5.0 0.1
Pyraclostrobin Carbamate 7 0.180~3.459 1.612 10 0.03
Pyrimethanil Anilopyrimidine 21 0.273~3.476 1.593 10 0.2
Spiromesifen Tetronic acid 1 6.354 6.354 0.2 0.03
Teflubenzuron Benzoylurea 1 1.278 1.278 5.0 0.01
Thiacloprid Neonicotinoid 1 2.040 2.040 20 0.01
* Codex ** EU
판단된다. 위해지수(%)가 가장 높은 농약은 메티다티온 0.049, 이피엔 0.033, 카보퓨란 0.028, 테트라코나졸 0.023, 카두사포스 0.023이며, 그 외 농약들은 0.015 이하로 평가되 었다.
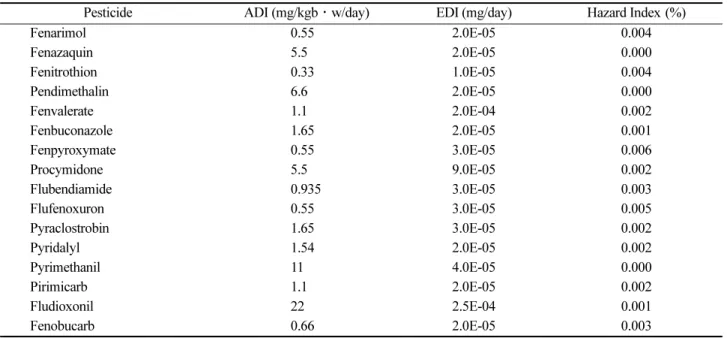
상추에서 검출된 농약에 대한 위해지수는 0.000~0.095%
로서 들깻잎의 경우와 마찬가지로 안전한 것으로 평가되었 으며, 그 중 위해지수가 높은 농약들을 살펴보면 테부피림 포스 0.095, 테트라코나졸 0.054, 빈클로졸린 0.019, 엔도설 판 0.018, 보스칼리드 0.013이며 그 외 농약들은 0.010 이하 로 평가되었다. 이는 2010년 김 등이 국내 유통 중인 관행 및 인증 농산물 중 들깻잎과 상추를 대상으로 110종의 잔류 농약 안전성 평가를 실시한 결과 상추에서 검출된 사이퍼메 트린과 들깻잎에서 검출된 디클로르보스는 모두 ADI의
0.1% 미만으로 나타나 본 연구결과와 동일하였다(Kim et al., 2011).
장 등은 2009년 서울지역 유통 채소류를 대상으로 258종 의 잔류농약 위해성 평가를 실시한 결과 위해도가 높은 농 약은 디에토펜카브 7.33%, 인독사카브 5.13% 이피엔 3.96%, 디니코나졸 3.92% 클로로탈로닐 2.09%이었으며, 기타 농약 은 모두 3% 이하로 나타났다고 보고하였다(Jang et al., 2010).
또한 김 등은 2008년도 국내 대형시장 유통 농산물에 대한 잔류농약 모니터링 검출 농약을 토대로 위해도 평가를 실시 한 결과 ADI 대비 0.0000~0.3462%의 현저히 낮은 수준을 나타냈다고 보고 하였다(Kim et al., 2008). 농산물에 대한 잔류농약 모니터링 및 안전성 평가연구를 살펴보면 위해도 는 10%를 넘지 않는 안전한 수준이나 검출된 농약의 종류 Table 5. Pesticide residues detected in lettuce
Name of pesticide Class No.of detection
Detection range (mg/kg)
Mean conc. of detection (mg/kg)
MRL (mg/kg)
ADI (mg/kg/day) Analyzed by GC
Bifenthrin Pyrethroid 3 0.036~0.111 0.078 1.0 0.01
Chlorfenapyr Arylpyrrole 3 0.003~0.075 0.046 0.5 0.026
Chlorothalonil Chloronitrile 4 0.060~2.521 0.718 5.0 0.02
Chlorpyrifos Organophosphate 1 0.257 0.257 0.01 0.01
Cyhalothrin Pyrethroid 8 0.060~2.521 0.116 5.0 0.02
Cypermethrin Pyrethroid 4 0.174~1.529 0.558 2.0 0.02
Diazinon Organophosphate 3 0.023~0.043 0.035 0.1 0.005
Diethofencarb Carbamate 3 0.013~8.094 3.300 5.0 0.43
Endosulfan Organochlorine 19 0.015~1.306 0.224 0.10 0.006
Fenarimol Carbamate 2 0.376~0.512 0.444 1.00 0.01
Fludioxonil Phenylpyrrole 1 1.429 1.429 3.0 0.4
Indoxacarb Oxadiazine 2 0.198~1.478 0.838 3.0 0.01
Isoprothiolane Dithiolane 1 0.148 0.148 0.2 0.1
Metalaxyl Phenylamide 3 0.043~1.245 0.679 2.0 0.08
Pendimethalin Dinitroaniline 1 0.145 0.145 0.2 0.12
Procymidone Dicarboximide 17 0.013~7.030 1.269 5.0 0.1
Pyridaben - 2 0.783~1.404 1.094 2.0 0.01
Tebupirimfos Organophosphate 1 0.131 0.131 0.01 0.0002
Tetraconazole Triazole 1 6.660 6.600 1.0 0.0073
Vinclozolin Dicarboximide 2 0.037~0.083 0.060 1.0 0.01
Analyzed by HPLC
Acetamiprid Neonicotinoid 1 0.424 0.424 10.0 0.071
Azoxystrobin Methoxycaylate 4 0.647~40.547 11.215 2.0 0.2
Boscalid Carboxamide 8 0.486~16.530 4.793 5.0 0.04
Carbendazim Benzimidazole 2 1.118~2.322 1.720 5.0 0.03
Chlorantraniliprole - 1 0.987 0.987 7.0 2.0
Dimetomorph Organophosphate 13 0.449~7.053 2.686 7.0 0.2
Flubendiamide - 5 1.083~4.056 2.637 10.0 0.017
Imidacloprid Neonicotinoid 3 0.339~0.637 0.471 7.0 0.06
Table 6. Exposure assessment parameter of pesticides in perilla leaf
Pesticide ADI (mg/kgb·w/day) EDI (mg/day) Hazard Index (%)
Diazinon 0.275 1.0E-05 0.004
Diniconazole 1.1 2.0E-05 0.002
Dimetomorph 11 3.0E-05 0.000
Diethofencarb 23.65 1.5E-04 0.001
Dichlofluanid 16.5 1.0E-05 0.000
Lufenuron 0.77 1.0E-05 0.004
Myclobutanil 1.65 1.4E-04 0.009
Metalaxyl 4.4 2.0E-05 0.001
Metaflumizone 5.5 2.0E-05 0.000
Methoxyfenozide 5.5 2.0E-05 0.000
Methidathion 0.055 3.0E-05 0.049
Boscalid 2.2 1.0E-04 0.004
Bifenthrin 0.55 2.0E-05 0.004
Vinclozolin 0.55 5.0E-05 0.009
Spiromesifen 1.65 3.0E-05 0.002
Cypermethrin 1.1 6.0E-05 0.005
Cyhalothrin 1.1 1.0E-05 0.001
Acetamiprid 3.905 5.0E-05 0.001
Azoxystrobin 11 2.5E-04 0.002
Ethoprophos 0.022 0.0E-05 0.015
Endosulfan 0.33 3.0E-05 0.009
Imidacloprid 3.3 3.0E-05 0.001
Isoprothiolane 5.5 3.0E-05 0.000
Iprodione 3.3 7.0E-05 0.002
Iprobenfos(IBP) 1.925 9.0E-05 0.005
EPN 0.077 3.0E-05 0.033
Indoxacarb 0.55 3.0E-05 0.005
Cadusafos 0.0275 1.0E-05 0.023
Carbendazim 1.65 6.0E-05 0.003
Carbofuran 0.055 2.0E-05 0.028
Kresoxim-methyl 22 3.0E-05 0.000
Clothianidin 5.335 2.0E-05 0.000
Chlorothalonil 1.1 3.0E-05 0.003
Chlorfluazuron 1.815 1.0E-05 0.001
Chlorpyrifos 0.55 2.0E-05 0.004
Chlorpyrifos-methyl 0.55 2.0E-05 0.004
Chlorfenapyr 1.43 2.0E-05 0.002
Tebuconazole 1.65 2.0E-05 0.001
Tebufenpyrad 0.55 3.0E-05 0.005
Tetraconazole 0.4015 9.0E-05 0.023
Teflubenzuron 0.55 2.0E-05 0.004
Tolylfluanid 4.4 2.3E-04 0.005
Thiacloprid 0.55 2.0E-05 0.004
Parathion 0.22 2.0E-05 0.010
Permethrin 2.75 2.0E-05 0.001
Table 6. Exposure assessment parameter of pesticides in perilla leaf (continued)
Pesticide ADI (mg/kgb·w/day) EDI (mg/day) Hazard Index (%)
Fenarimol 0.55 2.0E-05 0.004
Fenazaquin 5.5 2.0E-05 0.000
Fenitrothion 0.33 1.0E-05 0.004
Pendimethalin 6.6 2.0E-05 0.000
Fenvalerate 1.1 2.0E-04 0.002
Fenbuconazole 1.65 2.0E-05 0.001
Fenpyroxymate 0.55 3.0E-05 0.006
Procymidone 5.5 9.0E-05 0.002
Flubendiamide 0.935 3.0E-05 0.003
Flufenoxuron 0.55 3.0E-05 0.005
Pyraclostrobin 1.65 3.0E-05 0.002
Pyridalyl 1.54 2.0E-05 0.002
Pyrimethanil 11 4.0E-05 0.000
Pirimicarb 1.1 2.0E-05 0.002
Fludioxonil 22 2.5E-04 0.001
Fenobucarb 0.66 2.0E-05 0.003
Estimated dietary intake amount(mg/day/person)= average value× daily food intake (kg/day/person) ADI(mg/55kg/day)=ADI(mg/kg/day)ÁÔkg(Korean average weight)
Hazard Index = EDI/ADI
Table 7. Exposure assessment parameter of pesticides in lettuce
Pesticide ADI (mg/kgb·w/day) EDI (mg/day) Hazard Index (%)
Diazinon 0.275 2.1E-05 0.007
Dimetomorph 11 1.3E-04 0.001
Diethofencarb 23.65 7.4E-05 0.000
Metalaxyl 4.4 5.6E-05 0.001
Boscalid 2.2 2.9E-04 0.013
Bifenthrin 0.55 5.1E-05 0.009
Vinclozolin 0.55 1.0E-04 0.019
Cypermethrin 1.1 5.6E-05 0.005
Cyhalothrin 1.1 2.2E-05 0.002
Acetamiprid 3.905 1.0E-04 0.003
Azoxystrobin 11 1.5E-04 0.001
Endosulfan 0.33 6.0E-05 0.018
Imidacloprid 3.3 5.4E-05 0.002
Isoprothiolane 5.5 5.1E-05 0.001
Indoxacarb 0.55 5.5E-05 0.010
Carbendazim 1.65 1.8E-05 0.001
Chlorantraniliprole 110 5.3E-05 0.000
Chlorothalonil 1.1 5.7E-05 0.005
Chlorpyrifos 0.55 1.1E-05 0.002
Chlorfenapyr 1.43 1.1E-05 0.004
Tebupirimfos 0.011 1.1E-05 0.095
Tetraconazole 0.4015 2.2E-04 0.055
Fenarimol 0.55 5.3E-05 0.010
Pendimethalin 6.6 5.1E-05 0.001
Procymidone 5.5 10.0E-05 0.002
Flubendiamide 0.935 8.1E-05 0.009
Pyridaben 0.55 5.6E-05 0.010
Fludioxonil 22 5.4E-05 0.002
및 농산물 대상에 따라 수치가 광범위하였다.
위해지수가 100%보다 크면 클수록 일일허용가능 농약섭 취량을 많이 초과하는 것 이므로 위해하다고 판단할 수 있 으며, 100보다 작으면 작을수록 위해가능성이 적은 것으로 판정할 수 있다(Chun and Kang, 2003). 그러나 FAO/WHO 에서는 좀 더 세분화하여 유독성분에 대한 인체 노출량이 ADI 값의 10% 미만일 때는 위험성을 걱정할 필요가 없고 10% 를 초과하면 정밀조사와 철저한 법적 규제를 필요로 하 였으며 ADI의 30% 수준에 도달하게 되면 위험 경고하도록 하였다. 들깻잎과 상추에서 검출된 농약의 위해지수는 각각 최고치가 0.049%, 0.095%로 이들 농산물 섭취에 의한 위해 성은 낮은 것으로 나타났으며 FAO/WHO 기준에 안전한 수 준이다(Lee and Lee, 1997).
또한 세척방법에 따른 잔류농약 제거율은 들깻잎의 경우 51~91% 수준 (Seo at al, 2007), 상추의 경우 7~77% 수준 으로(Kwon et al, 2013)제거되는 것을 감안한다면 유통되고 있는 들깻잎과 상추의 잔류농약은 인체에 위해한 영향을 미 치지 않을 것으로 판단된다.
Literature Cited