저작자표시-비영리-변경금지 2.0 대한민국 이용자는 아래의 조건을 따르는 경우에 한하여 자유롭게
l 이 저작물을 복제, 배포, 전송, 전시, 공연 및 방송할 수 있습니다. 다음과 같은 조건을 따라야 합니다:
l 귀하는, 이 저작물의 재이용이나 배포의 경우, 이 저작물에 적용된 이용허락조건 을 명확하게 나타내어야 합니다.
l 저작권자로부터 별도의 허가를 받으면 이러한 조건들은 적용되지 않습니다.
저작권법에 따른 이용자의 권리는 위의 내용에 의하여 영향을 받지 않습니다. 이것은 이용허락규약(Legal Code)을 이해하기 쉽게 요약한 것입니다.
Disclaimer
저작자표시. 귀하는 원저작자를 표시하여야 합니다.
비영리. 귀하는 이 저작물을 영리 목적으로 이용할 수 없습니다.
변경금지. 귀하는 이 저작물을 개작, 변형 또는 가공할 수 없습니다.
이 재 호
2 0 2 0 년
2 월
박 사 학 위 논 문
Isocitrate Dehydrogenase 2 Deficiency
계 명 대 학 교 대 학 원
의 학 과
이 재 호
지 도 교 수 임 승 순
2 0 2 0 년 2 월
Induces Dysfunction of Energy
Metabolism in Brown Adipose Tissue
이 재 호
Isocitrate Dehydrogenase 2 Deficiency
지 도 교 수 임 승 순
이 논 문 을 박 사 학 위 논 문 으 로 제 출 함
2 0 2 0 년 2 월
계 명 대 학 교 대 학 원
Induces Dysfunction of Energy Metabolism in Brown Adipose Tissue
의 학 과 생 리 학 전 공
이재호의 박사학위 논문을 인준함
주 심 송 대 규
부 심 임 승 순
부 심 배 재 훈
부 심 권 택 규
부 심 우 창 훈
계 명 대 학 교 대 학 원
2 0 2 0 년 2 월
Acknowledgement
본 논문을 제출하기까지 정말 많은 시간이 들었고, 많은 이들의 도움을 받 았습니다. 긴 시간 동안 항상 옆에서 연구의 방향을 제시해 주시고 부족한 부분들을 채워주신 지도 교수님 임승순 교수님과 심사위원을 맡아 주신 송 대규 교수님, 배재훈 교수님, 권택규 교수님, 우창훈 교수님께 진심으로 감 사드립니다.
저는 이곳에서 석사를 시작하고 지금까지 나이만 먹었지 부족한 점이 많 았습니다. 하지만 함께 연구실에서 가족들보다 시간을 오래 보냈던 박사님 들과 함께 학위를 거쳤던 분들 그리고 연구원분들의 도움과 조언이 있었기 에 저의 부족함을 채우고 긴 시간을 버틸 수 있었습니다. 그 덕에 무사히 이 논문을 쓸 수 있었습니다.
그리고 언제나 집이 멀다고 시간이 없다고 자주 얼굴도 비추지 못하고 일 년 동안 명절에나 겨우 맘 편하게 보던 아버지, 어머니, 누나 그리고 매형 에게 정말 죄송스러운 마음뿐이었습니다. 이쪽 분야의 일에 대해 이해는 못 하지만 그래도 반대하지 않고 꿋꿋하게 정신적인 버팀목이 되어 주었기에 많은 시간을 버틸 수 있었습니다.
그 외 언제나 저에게 많은 도움을 주신 분들께 감사드리고 이 논문을 바 칩니다.
2020년 2월
이 재 호
Table of Contents
1. Introduction ··· 1
2. Materials and Methods ··· 4
3. Results ··· 15
4. Discussion ··· 48
5. Summary ··· 53
References ··· 54
Abstract ··· 63
국문초록 ··· 65
List of Tables
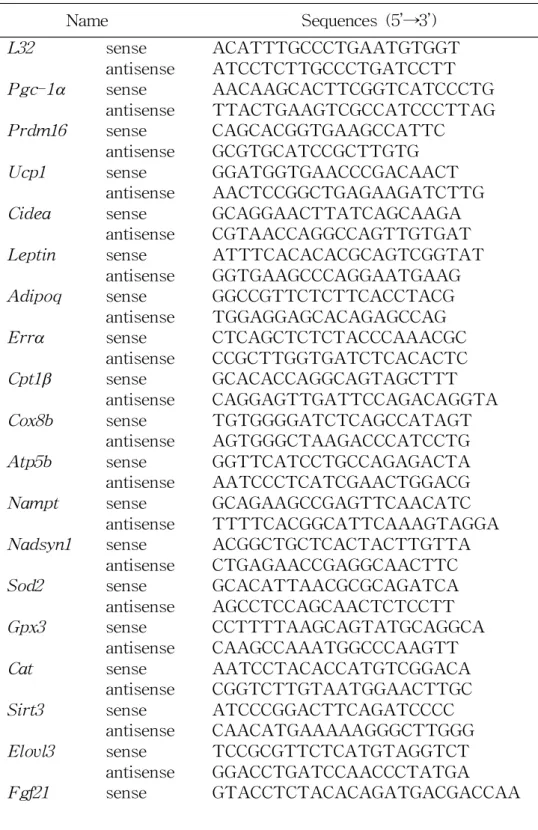
Table 1. Primer List for qPCR ··· 13
List of Figures
Figure 1. Increased fat accumulation by HFD in IDH2 KO mice ··· 22
Figure 2. HFD leads to change of body composition in IDH2 KO mice ··· 23
Figure 3. Serum profiling analysis ··· 24
Figure 4. Lower energy expenditure in IDH2 KO mice ··· 25
Figure 5. Lower physical activity of the IDH2 KO mice ··· 26
Figure 6. Tissue survey of IDH2 gene expression level ··· 27
Figure 7. IDH2 deficiency induces BAT whitening ··· 28
Figure 8. Ablation of IDH2 reduces expression of mitochondria-related genes in BAT ··· 29
Figure 9. Deficiency of IDH2 decreases mitochondrial function in BAT ··· 30
Figure 10. Organic acid levels from metabolomics analysis ··· 31
Figure 11. Nicotinamide levels are decreased in BAT of IDH2 KO mice ··· 32
Figure 12. ROS production in brown adipocytes of the WT and IDH2 KO mice ··· 33
Figure 13. The effects of ROS production in the WT and IDH2 KO BAT ··· 34
Figure 14. Body weight and body composition in response to BHA treatment in WT and IDH2 KO mice ··· 35
Figure 15. Effect of anti-oxidant reagent against diet-induced obesity · 37
Figure 16. RNA-sequencing data by BHA in BAT of HFD-fed IDH2 KO mice ··· 38
Figure 17. Anti-oxidant reagent recovers genes expression in BAT of IDH2 KO mice ··· 39
Figure 18. Anti-oxidant restores mitochondrial function in IDH2 KO mice ··· 40
Figure 19. Measurement of body temperature in WT and IDH2 KO mice
after cold exposure ··· 41
Figure 20. Thermogenic genes expression in BAT of WT and IDH2 KO mice ··· 42
Figure 21. Mitochondrial OXPHOS levels of BAT in WT and IDH2 KO mice induced by ambient temperature or cold exposure ··· 44
Figure 22. Recovered body temperature in IDH2 KO mice by supplement of aKG ···45
Figure 23. Genes expression by aKG in BAT of WT and IDH2 KO mice ··· 46
Figure 24. Scheme of IDH2-mediated effect of anti-oxidant in BAT ··· 47
1. Introduction
Isocitrate dehydrogenase 2 (IDH2) is a nicotinamide adenine dinucleotide phosphate (NADP
+)-dependent enzyme located in the mitochondria and catalyzes the oxidative decarboxylation of isocitrate to alpha-ketoglutarate (aKG) in the tricarboxylic acid (TCA) cycle (1-3).
Moreover, IDH2 participates in regulating mitochondrial oxidative stress by catalyzing the production of nicotinamide adenine dinucleotide hydrogen phosphate (NADPH) (4-6). Therefore, IDH2 acts as a critical factor in mitochondrial function as one of the metabolic enzymes that donates NADPH for redox balancing in multiple organs (7).
The role of IDH2 in cancer has been broadly studied and most studies included the induction of apoptosis by degradation of the cancer cell functions by loss of genes through gene mutation (8-13). Recent studies have suggested that IDH2 knockout (KO) mice could exacerbate mitochondrial dysfunction during the development of nonalcoholic steatohepatitis due to the enhanced accumulation of the mitochondrial reactive oxygen species (ROS) (14). However, the underlying molecular mechanism of the effect of IDH2 on metabolic diseases remains unclear.
Obesity is connected with several metabolic diseases including type 2
diabetes and cardiovascular disease (15-19). Mammalian adipose tissue
has been traditionally divided into two different types (20,21). White
adipose tissue (WAT) stores energy in unilocular adipocytes, whereas
brown adipose tissue (BAT) dissipates energy through non-shivering
thermogenesis in multi-locular adipocytes (22-24). Brown adipocytes
generate heat and counteract obesity by virtue of abundant mitochondria
and mitochondrial uncoupling protein 1 (UCP1) (25-27). Thus, there has
been an emerging interest in brown fat as a potential target for
anti-obesity therapy.
BAT is the major organ for non-shivering thermogenesis in mammals (28). It presents a unique process for heat production in response to cold stress and provides a protective mechanism against obesity (29,30).
Many features of the molecular mechanisms underlying the function of BAT are known; however, these studies do not comprehensively understand how BAT function is controlled and incorporated with the whole body metabolism to ensure efficient burning of the metabolic substrates for the provision of heat.
Heat generation in BAT is known to get induced to defend against obesity and insulin resistance in mice with high fat diet (HFD) (31). A potentially harmful drawback of the promoted uncoupled respiration is the generation of mitochondrial oxidative stress that must be restricted to inhibit the oxidative damage to enzyme complexes involved in the TCA cycle (32,33).
To modulate substrate flow and balance electron transfer, appropriate coordinated action of key mitochondrial electron transport (ET) enzymes is required (34). One of the key TCA steps includes the oxidative decarboxylation of isocitrate by IDH, leading to the production of aKG.
IDH3 catalyzes the irreversible reaction between isocitrate and nicotinamide adenine dinucleotide (NAD
+) to form aKG. In contrast, IDH1 and IDH2 are marched with NADP
+and NADPH, and exist in the cytosol and mitochondrial matrix. Mitochondrial NADPH is essential for the provision of dependent scavenging of mitochondrial ROS that occurs during the times of promoted ET chain activity (35,36).
Even though IDH2 has been supposed as a distinct enzyme in the
regulation of mitochondrial ROS, its contribution to the mitochondrial
function for energy metabolism such as obesity or thermogenesis remain
unknown.
The study aimed to elucidate the physiologic mechanism by which
IDH2 regulates energy metabolism, and to investigate the role of IDH2
on the regulation of HFD-induced obesity and cold-exposure in mice.
2. Materials and Methods
2.1. Animal Study:
Four-wk-old male IDH2 KO and WT mice with the C57BL/6J were used for this study. All mice were kept in SPF facility. These mice were fed either a low fat diet (LFD, 10% fat, Research Diet, New Brunswick, NJ, USA) or a HFD (60% fat, Research Diet, New Brunswick, NJ, USA)
Butylated hydroxyanisole (BHA, 7.5 g/kg, Sigma Aldrich, St. Louis, MO, USA) was co-treated as an anti-oxidant, when necessary. Body weight was checked weekly. Body composition was analyzed using nuclear magnetic resonance (NMR, LF50 body composition analysis-analyzer, Bruker, Brussels, Belgium). To analyze the thermogenesis function of BAT, control 8-wk-old mice were housed at 24 ℃ and cold-exposed groups were kept at 4 ℃ for 3 h. One percent aKG (Sigma Aldrich, St. Louis, MO, USA) was supplemented via drinking water for 4 wk. All procedures were carried out in accordance with the guidelines provided by Institution of Animal care and Use Committees KM-2015-32R3.
2.2. Materials:
Peroxisome proliferator-activated receptor gamma coactivator 1-alpha
(PGC-1a), catalase (CAT), fibroblast growth factor 21 (FGF21), and
total oxidative phosphorylation (OXPHOS) cocktail antibodies were
purchased from Abcam (Cambridge, UK). The antibodies against sirtuin
1 (SIRT1), sirtuin 3 (SIRT3), acetylated-lysine, superoxide dismutase 2 (SOD2), peroxisome proliferator-activated receptor gamma (PPARg), and UCP1 were purchased from Cell signaling (Beverly, MA, USA).
Glutathione peroxidase 3 (GPX3) antibody was purchased from Adipogen (San Diego, CA, USA). Nicotinamide adenine dinucleotide synthetase 1 (NADSYN1) antibody was purchased from Aviva system biology (San Diego, CA, USA). Antibodies against nicotinamide phosphoribosyltransferase (NAMPT), 60 kDa heat shock protein (HSP60) and glyceraldehyde-3-phosphate dehydrogenase (GAPDH) were purchased from Santa Cruz (Dallas, TX, USA); the GAPDH antibody was used for loading control. BSA, Insulin, triiodothyronine (T3), rosiglitazone, and sodium palmitate were purchased from Sigma Aldrich (St. Louis, MO, USA).
2.3. Analysis of Metabolic Cages:
Mice were fed either LFD or HFD when relocated to single cages in Phenomaster system (TSE Systems Gmbh, Bad Homburg, Germany) for 3 days. During the analysis period, temperature, physical activity, food intake, drinking, oxygen and carbon dioxide contents, oxygen uptake (VO
2), and carbon dioxide production (VCO
2) were measured at the same time using standard indirect calorimetry analysis. Energy expenditure and respiratory exchange ratio were calculated automatically from VO
2and VCO
2. The data were collected in TSE Phenomaster software (TSE Systems Gmbh, Bad Homburg, Germany).
2.4. Serum Profiling:
Trigryceride (TG), cholesterol, high-density lipoprotein (HDL), low-density lipoprotein (LDL), non-esterified fatty acids (NEFA), AST and ALT concentrations were measured by a Beckman Coulter AU480 automatic biochemistry analysis system (Model AU-480, Beckman Coulter, Krefeld, Germany).
2.5. Mice Positron Emission Tomography/Computed Tomography (PET/CT) Imaging:
For PET/CT imaging was performed with the Triumph II PET/CT system (LabPET8, Gamma Medica-Ideas, Waukesha, WI, USA). CT scans were recorded with an X-ray detector (fly acquisition, number of projections: 512, binning setting: 2, frame number: 1, X-ray tube voltage: 75 kVp, focal spot size: 50 mm, magnification factor: 1.5, matrix size: 512) immediately following the acquisition of PET images. The PET images were reconstructed using three-dimensional (3D)-OSEM iterative image reconstruction and CT images were reconstructed using filtered back-projections. Mice housed at ambient temperature (AT, 22—
24 ℃) and fed the HFD for 4 wk were used for the study. All mice were anesthetized using 1—2% isoflurane gas during the imaging. PET images were co-registered with anatomical CT images using 3D image visualization and analysis software (VIVID, Gamma Medica-Ideas, Northridge, CA, USA).
2.6. Isolation of Primary Brown Adipocytes from BAT:
The primary brown adipocytes from 4-wk-old mice were separated by
collagenase digestion. Briefly, the BAT are dissected, minced, and
digested with 0.2% type I collagenase (Worthington Biochemical Co., Freehold, NJ, USA) in DPBS buffer (Welgene, Daegu, Korea) for 40 min at 37 ℃. The brown adipocytes were separated from the cell pellet bycentrifugation at 1000 × g for 5 min at 4 ℃. The cell pellet was then suspended in fetal bovine serum (FBS, Hyclone, Logan, UT, USA) and filtered through a 40-mm mesh filter (BD Bioscience, San Diego, CA, USA). The pelleted primary brown adipocytes were re-suspended in Dulbecco's modified Eagle's medium (DMEM, Corning, NY, USA) containing 15% FBS and 1% penicillin/streptomycin, and subsequently seeded in six-well plates for proliferation. Cells were differentiated using a differentiation medium (DMEM containing 15% FBS, 50 nM insulin, 5 nM T3, and 1 mM rosiglitazone) for two days.
2.7. Mitochondrial ROS Production Assay:
Primary brown adipocytes (2 × 10
5cells/well) were cultured in the absence or presence of 500 mM BSA-conjugated palmitate. Subsequently, 100 mM BHA was added to it and the cells were incubated for 1 h.
MitoSOX
TMRed mitochondrial superoxide indicator (MitoSOX Red, Molecular Probes, Eugene, OR, USA) was added to the cells and incubated at 37 ℃ for 15 min. The cells were harvested by treating with 0.05% trypsin-ethylenediaminetetraacetic acid and then washed twice with cold PBS. The cells conjugated with MitoSOX Red were detected using the fluorescence 1 setting of fluorescence-activated cell sorting (FACS) Calibur (BD Biosciences, San Diego, CA, USA).
2.8. Mitochondrial Oxygen Consumption Rate (OCR):
The mitochondrial OCR was measured with a Seahorse XF24 analyzer (Seahorse Bioscience Inc., North Billerica, MA, USA) in 24-well plates.
Primary brown adipocytes were seeded at 2 × 10
4cells per well before the analysis. On the day before the OCR measurement, the sensor cartridge was placed into calibration buffer (Seahorse Bioscience Inc., North Billerica, MA, USA) and incubated in a non-CO
2incubator at 37 ℃. Primary brown adipocytes were washed and incubated in DMEM without sodium bicarbonate. The medium as well as mitochondrial OXPHOS inhibitors were adjusted to pH 7.4 on the day of the OCR assay. The basal OCR was measured three times and three readings were taken after the addition of each mitochondrial OXPHOS inhibitor [oligomycin (2 mg/mL) and rotenone (1 mM)]. The basal and post-oligomycin OCRs were calculated by averaging the last three measurements after the maintenance of a steady state. Coupled respiration was expressed as percent decrease from the basal respiration.
Additionally, carbonyl cyanide 4-(trifluoromethoxy) phenylhydrazone (5 mM) was used to measure the maximal mitochondrial respiration of the cells. OCR was automatically calculated and recorded by the sensor cartridge and the Seahorse XF24 software.
2.9. Transmission Electron Microscopy (TEM):
The BAT samples from WT and IDH2 KO mice were prefixed in 2%
paraformaldehyde and 2.5% glutaraldehyde (Electron Microscopy
Sciences, Fort Washington, PA, USA) in 0.1 M phosphate buffer (pH
7.4). The tissues were removed and stored in the same fresh fixative
overnight at 4 ℃. Tissues were washed, post-fixed in 1% osmium
tetroxide for 2 h, dehydrated through an ascending series of ethanol,
propylene oxide and embedded in Epon mixture (Oken Shoji Co., Tokyo, Japan). Thin sections (70 nm) were made using Leica EM UC6 ultramicrotome (Leica Microsystems, Wetzlar, Germany), mounted on 200 mesh copper grids, stained with 2% uranyl acetate and 1% lead citrate for 5 min each, and observed under a Hitachi H-7650 transmission electron microscope (Hitachi, Tokyo, Japan) at the accelerating voltage of 80 kV.
2.10. RNA-sequencing (RNA-seq):
The BAT samples were collected from WT and IDH2 KO mice fed LFD or HFD. Same amounts of RNA from three individual mice were pooled together to make 3 separate samples for analysis by RNA-seq (Macrogen Inc., Seoul, Korea). Briefly, one mg of the total RNA was analyzed using the Truseq RNA library kit (Illumina, San Diego, CA, USA) to construct the cDNA libraries. The protocol included polyA-selected RNA extraction, RNA fragmentation, random hexamer primed reverse transcription, and 100 nt paired-end sequencing using an Illumina Hiseq 2000 (Illumina, San Diego, CA, USA). An agilent technologies’ 2100 bioanalyzer was used for the qualification.
2.11. Quantitative Polymerase Chain Reaction
(qPCR):Total RNA was isolated using the TriZol reagent (Life Technologies,
Carlsbad, CA, USA) and the cDNA was prepared using iScript cDNA
synthesis kit (Bio-Rad, Hercules, CA, USA) according to the
manufacturers’ instructions. The qPCR was carried out using a CFX96
TMreal time system (Bio-Rad, Hercules, CA, USA). The primer sequences
are listed in Table 1.
Threshold cycle (CT) number of each gene was calculated, and ribosomal protein L32 was used as reference genes. Delta-delta CT values of genes were presented as relative fold induction.
2.12. Westerm Blot Analysis:
Whole tissue lysate was extracted using RIPA lysis buffer [50 mM Tris-Hcl pH 8.0, 150 mM NaCl, 1.0% NP-40 or Triton X-100, 0.5%
Na
3VO
4, and 0.1% sodium dodecyl sulfate (SDS)] containing complete protease inhibitor cocktail (GeneDepot, Barker, TX, USA). Proteins were diluted in loading dye, heated at 94 ℃ for 5 min. Lysates were centrifuged at 13,000 rpm for 15 min at 4 ℃ and the supernatant fractions were collected. Proteins were resolved by 5—10% Tris-HCl SDS/polyacrylamide gel electrophoresis gel electrophoresis and transferred onto nitrocellulose (GE-health care, Uppsala, Sweden). All immunoblots were developed by horseradish peroxidase-conjugated secondary antibody (Santa Cruz, Dallas, TX, USA) with an ECL detection system (Bio-Rad, Hercules, CA, USA).
2.13. Measurement of Mitochondrial DNA Copy Number:
Total DNA were extracted with the DNA isolation kit (Bioseum,
Seoul, South Korea). For mitochondrial DNA (mtDNA) copy number
measurement, qPCR was performed using a CFX96
TMBio-Rad qPCR
machine. utilizing cyclooxygenase-1 (COX1) primers for mtDNA and
normalized against the nuclear H-19 gene. The relative mtDNA copy
number was defined as the total amount of mtDNA divided by the total
amount of nuclear DNA.
2.14. Mitochondrial Protein Isolation:
To isolate mitochondrial protein, BAT tissues were processed for mitochondrial isolation using a mitochondria isolation kit (Thermo Scientific, Madison, WI, USA). Briefly, the tissues were disrupted by manual cutting and dounce homogenization. Samples were then incubated according to the manufacturer's protocol and centrifuged to isolate cytosolic and mitochondrial fractions. Mitochondrial fractions were washed and suspended in mitochondria lysis buffer and then subjected to Western blot analysis of total OXPHOS levels.
2.15. Extraction and LC/MS/MS Quantitation of Metabolites from Tissue Homogenates :
Frozen BAT from C57B/6J mice was homogenized in ice-cold 50%
acetonitrile/50% water with 0.3% formic acid. Tissue homogenates were
aliquoted for metabolomics assays and stored at -80 ℃. For the analysis
of organic acids, homogenates (50 mL) were spiked with
isotopically-labelled internal standards, extracted in ethylacetate, and
organic acids in dried extracts were derivatized with
O-benzylhydroxylamine using 1-ethyl-3-(3-dimethylaminopropyl)carbodiimide
coupling chemistry according to prior studies (37). Then, derivatized
organic acids were quantitated using multiple reaction monitoring on a
Dionex UltiMate 3000 Quantiva triple quadrupole mass spectrometer
(Thermo Scientific, Madison, WI, USA) as previously described.
For nicotinamide adenine dinucleotide hydrogen (NADH) and NADPH extraction, 100 mL aliquots of homogenates spiked with isotopically-labelled internal standards. This was followed by the addition of 100 mL of 1 M ammonium formate to adjust the pH to 4.
Samples were vortexed thoroughly and centrifuged at 18,000 × g for 5 min at 10 ℃. The clarified homogenates were passed through an AcroPrep advance 3 K Omega filter plate (Pall Co., Ann Arbor, MI, USA) prior to LC/MS/MS analysis. Quantitation of reduced nucleotides was achieved using multiple reaction monitoring on a Dionex UltiMate 3000 HPLC Quantiva triple quadrupole mass spectrometer.
2.16. Statistical Analysis:
Data were analyzed using GraphPad Prism 5.0 for Windows
(GraphPad Software Inc., San Diego, CA, USA). Student’s t-test was
two-tailed, and data are shown as mean ± SEM. P value less than 0.05
was considered significant;
*p < 0.05,
**p < 0.01,
***p < 0.001.
Name Sequences (5’→3’)
L32
sense ACATTTGCCCTGAATGTGGT
antisense ATCCTCTTGCCCTGATCCTT
Pgc-1asense AACAAGCACTTCGGTCATCCCTG
antisense TTACTGAAGTCGCCATCCCTTAG
Prdm16
sense CAGCACGGTGAAGCCATTC
antisense GCGTGCATCCGCTTGTG
Ucp1
sense GGATGGTGAACCCGACAACT
antisense AACTCCGGCTGAGAAGATCTTG
Cidea
sense GCAGGAACTTATCAGCAAGA
antisense CGTAACCAGGCCAGTTGTGAT
Leptin
sense ATTTCACACACGCAGTCGGTAT
antisense GGTGAAGCCCAGGAATGAAG
Adipoq
sense GGCCGTTCTCTTCACCTACG
antisense TGGAGGAGCACAGAGCCAG
Erra
sense CTCAGCTCTCTACCCAAACGC
antisense CCGCTTGGTGATCTCACACTC
Cpt1b
sense GCACACCAGGCAGTAGCTTT
antisense CAGGAGTTGATTCCAGACAGGTA
Cox8b
sense TGTGGGGATCTCAGCCATAGT
antisense AGTGGGCTAAGACCCATCCTG
Atp5b
sense GGTTCATCCTGCCAGAGACTA
antisense AATCCCTCATCGAACTGGACG
Nampt
sense GCAGAAGCCGAGTTCAACATC
antisense TTTTCACGGCATTCAAAGTAGGA
Nadsyn1sense ACGGCTGCTCACTACTTGTTA
antisense CTGAGAACCGAGGCAACTTC
Sod2
sense GCACATTAACGCGCAGATCA
antisense AGCCTCCAGCAACTCTCCTT
Gpx3
sense CCTTTTAAGCAGTATGCAGGCA
antisense CAAGCCAAATGGCCCAAGTT
Cat
sense AATCCTACACCATGTCGGACA
antisense CGGTCTTGTAATGGAACTTGC
Sirt3
sense ATCCCGGACTTCAGATCCCC
antisense CAACATGAAAAAGGGCTTGGG
Elovl3
sense TCCGCGTTCTCATGTAGGTCT
antisense GGACCTGATCCAACCCTATGA
Fgf21
sense GTACCTCTACACAGATGACGACCAA
Table 1. Primer List for qPCR
antisense CGCCTACCACTGTTCCATCCT
Nrf2
sense CTCGCTGGAAAAAGAAGTG
antisense CCGTCCAGGAGTTCAGAGG
Pparg1sense TCGCTGATGCACTGCCTATG
antisense GAGAGGTCCACAGAGCTGATT
Cox7a1
sense CAGCGTCATGGTCAGTCTGT
antisense AGAAAACCGTGTGGCAGAGA
Tfam
sense ATTCCGAAGTGTTTTTCCAGCA
antisense TCTGAAAGTTTTGCATCTGGGT
Atp5b:
ATP synthase F1 subunit beta;
Cat:catase;
Cidea:cell death-inducing DNA fragmentation factor alpha-like effector A; Cox7a1:
cytochrome c oxidase subunit 7a1; Cox8b: cytochrome c oxidase subunit 8B; Cpt1
b: carnitine palmitoyltransferase 1 beta; Elovl3: elongation of very long chain fatty acids protein 3; Err
a: estrogen-related receptor alpha;
Fgf21: fibroblast growth factor 21; Gpx3: glutathione peroxidase 3; L32:
ribosomal protein L32;
Nadsyn1:nicotinamide adenine dinucleotide synthetase 1; Nampt: nicotinamide phosphoribosyltransferase; Nrf2: nuclear factor erythroid 2-related factor 2;
Pgc-1a: Peroxisome proliferator-activated receptor gamma coactivator 1-alpha;
Pparg1:peroxisome proliferator-activated receptor gamma 1; Prdm16: positive regulatory domain containing 16; Sirt3: sirtuin 3; Sod2: superoxide dismutase 2;
Tfam:transcription factor A, mitochondrial;
Ucp1:mitochondrial uncoupling protein 1.
3. Results
3.1. IDH2 Protects from HFD-induced Metabolic Stress in BAT Mitochondria:
3.1.1. IDH2 KO Mice Are More Responsive toward HFD-induced Obesity:
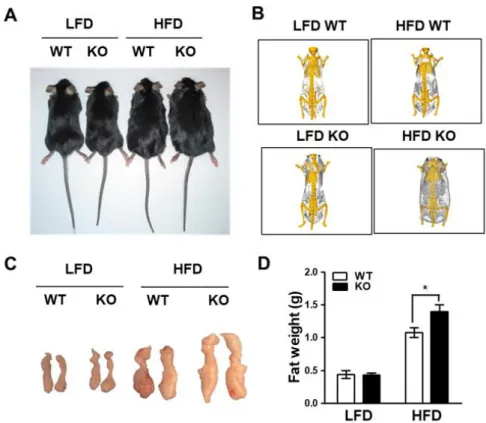
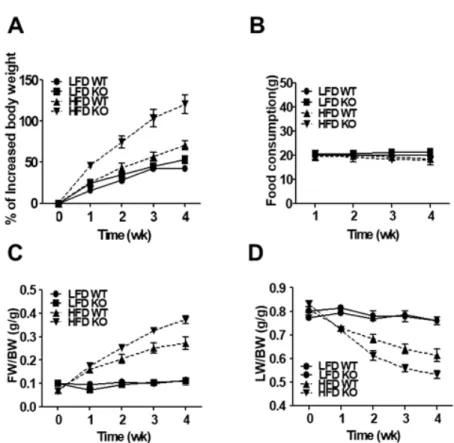
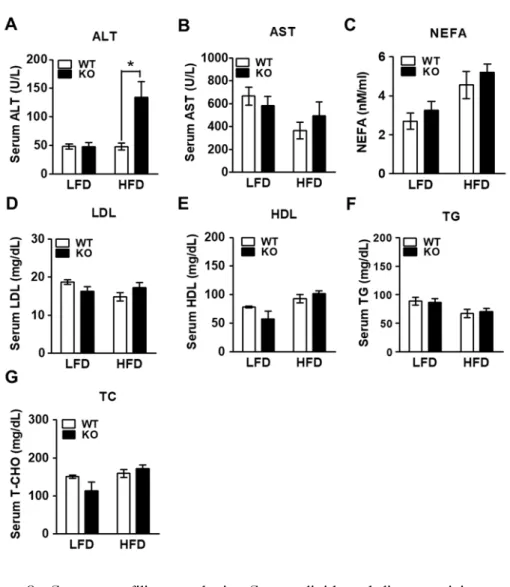
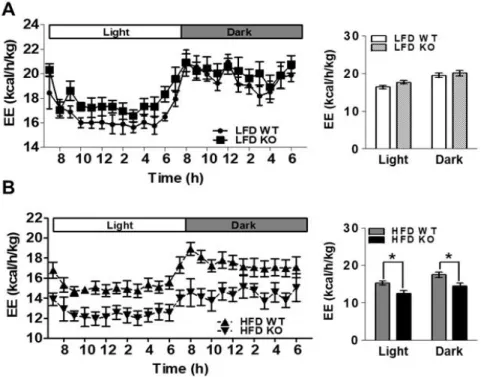
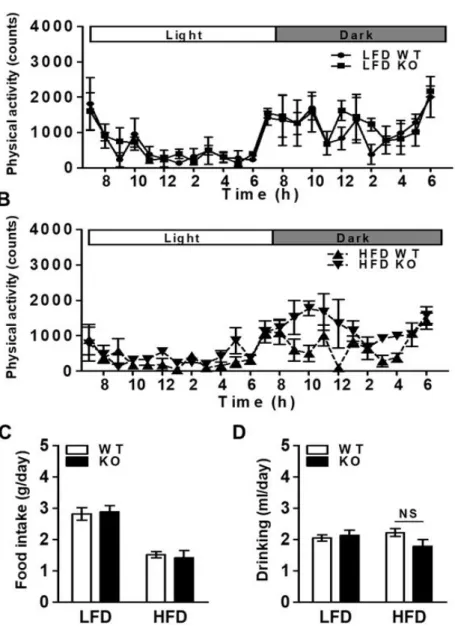
To examine the effects of IDH2 on whole body energy homeostasis during metabolic stress, this data compared body weight gain in WT and IDH2 KO mice fed a HFD or LFD (Figure 1A). As a result, it was supported that HFD-IDH2 KO mice gained more weight and showed an increase in the amount of white fat (Figure 1B-D). The IDH2 KO mice on HFD started to gain body weight more quickly of doubled by 4 wk despite having eaten the same amount of diet (Figure 2A&B). Most of the excessive body weight in the HFD-IDH2 KO mice was because of a rise in fat mass and a decline in lean mass (Figure 2C&D). There was a significant increase in the serum level of ALT in serum of IDH2 KO (Figure 3A-G). In agreement with the increased body weight, there was a significant impairment in the whole-body energy expenditure in HFD-IDH2 KO mice (Figure 4A&B). There were no differences observed for physical activity, food intake or water consumption (Figure 5A-D). These results indicate that IDH2 KO mice drastically increases the fat accumulation during HFD, which can, in part, be attributed to a reduction in the whole body energy expenditure.
3.1.2. HFD Impairs BAT Function in IDH2 KO Mice:
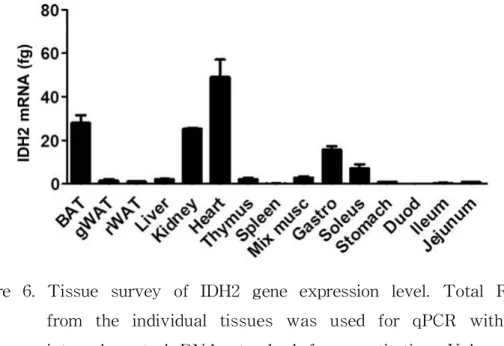
IDH2 was expressed at high levels in the heart, kidney, muscle, and
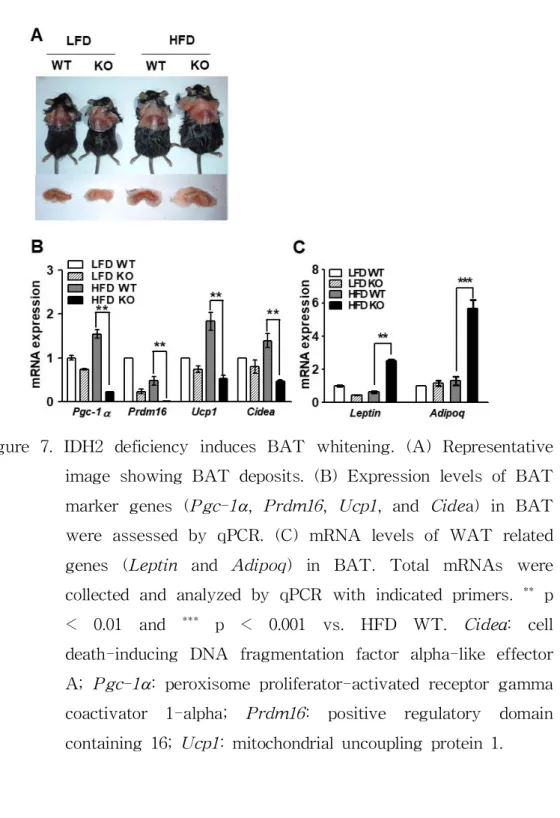
BAT as was revealed by the tissue survey (Figure 6). Previous study has shown that IDH2 KO mice were susceptible to increased heart failure with mitochondrial dysfunction (38). Another recent report has shown that IDH2 KO mice had an increased frequency of hepatic steatosis than WT fed a HFD (14). Thus, this study hypothesized that IDH2 might defend against HFD-induced body weight gain and the associated metabolic disease. Consistent with this hypothesis, BAT depots of HFD-IDH2 KO mice were expanded and pale, suggesting a decrease in BAT energy expenditure (Figure 7A). Consistent with the expression of BAT-related genes such as Pgc-1
a, positive regulatory domain containing 16 (Prdm16), Ucp1 and cell death-inducing DNA fragmentation factor alpha-like effector A (Cidea) decreased (Figure 7B) and the expression of WAT-related genes such as Leptin and Adipoq increased in BAT of HFD-IDH2 KO mice (Figure 7C). These results provided further evidence supporting the hypothesis that BAT function is significantly impaired in HFD-IDH2 KO mice.
3.1.3. BAT Impairment in IDH2 KO Is Caused by Mitochondrial Dysfunction:
IDH2 is a mitochondrial enzyme required for maintaining the redox balance. Therefore, this study hypothesized that excessive body weight gain in HFD-IDH2 KO mice might result from mitochondrial dysfunction. Gene expression profiles by an RNA-seq analysis for BAT in WT and IDH2 KO mice confirmed that many genes expressed at lower levels in IDH2 KO mice were linked with mitochondrial function.
These included genes that were down-regulated only in HFD-IDH2 KO
BAT or those expressed at lower levels in BAT of IDH2 KO mice fed
both LFD and HFD (Figure 8A). The decreased gene expression in
IDH2 KO BAT is, at least, partly due to the reduced activity of
PGC-1a protein in IDH2 KO BAT (Figure 8B-D). In addition, expression of the estrogen-related receptor alpha (Err
a) was also found to have reduced in IDH2 KO BAT (Figure 9A) along with that of several other known Err
aand Pgc-1
atarget genes analyzed directly by qPCR (Figure 9A). The levels of mitochondrial DNA were also lower in BAT from IDH2 KO mice (Figure 9B). Further, the TEM images showed weak mitochondrial structure with disrupted cristae in BAT from the HFD-IDH2 KO mice (Figure 9C). A direct analysis of mitochondrial respiration using the Seahorse also showed that the IDH2 KO BAT underwent a dramatic reduction in the total OCR (Figure 9D).
This study checked the levels of TCA cycle intermediates and nicotinamide, these data observed that following IDH, TCA intermediates as well as NAD
+, NADH, NADP
+, and NADPH were significantly lower in BAT of HFD-IDH2 KO mice (Figure 10A-C). The RNA-seq data also suggested that the expression of Nampt and Nadsyn1 was reduced in BAT of HFD-IDH2 KO mice. These two enzymes are involved in the production of NAD
+through the kynurenine and salvage pathways, respectively. Direct qPCR for Nampt and Nadsyn1 mRNA and Western blot data for NAMPT protein confirmed that their levels were reduced in IDH2 KO BAT (Figure 11A-C).
Decreased levels of NAMPT and NADSYN1 protein were consistent
with the lower levels of nicotinamide. In addition, NAD
+is an allosteric
regulator of the sirtuin family of deacetylases. In fact, PGC-1a and
SOD2 are directly deacetylated by SIRT1 and SIRT3, respectively,
(39,40) and, both PGC-1a and SOD2 are known to play important roles
in the mitochondrial function. In concordance with these previous
studies, expression of SIRT1 and SIRT3 was lower in BAT from IDH2
KO mice both LFD and HFD (Figure 11D). The protein acetylation
levels were also significantly higher in the IDH2 KO BAT (Figure 11E).
3.1.4. Ablation of IDH2 Leads to Up-regulated Accumulation of ROS:
To directly calculate the ROS levels, brown adipocytes isolated from BAT of WT and IDH2 KO mice were treated with the MitoSOX Red dye. The FACS analysis data revealed significantly higher levels of MitoSOX Red staining in BAT from IDH2 KO mice. This alteration was sustained when the cells were treated with BSA-conjugated palmitate to increase the ROS production (Figure 12A&B). Levels of mRNA and protein for CAT, SOD2, and GPX3, which are mitochondrial anti-oxidants genes, were also found to have decreased in BAT from the IDH2 KO mice on both LFD and HFD (Figure 13A&B). Taken together, these data suggest that ablation of IDH2 results in the dysfunction of ROS regulation when the mice were exposed to HFD, they could not control the excessive ROS accumulation, resulting in oxidative damage to mitochondria.
3.1.5. Supplementation of an Anti-oxidant Restores the Energy Imbalance and Obesity in HFD-IDH2 KO Mice:
This study hypothesized that the inhibition of ROS accumulation
would restore the mitochondrial dysfunction and weight gain phenotype
in the HFD-IDH2 KO mice. To test this, this study supplemented the
bioavailable anti-oxidant BHA (41) to the LFD and HFD for WT and
IDH2 KO mice. Interestingly, BHA supplementation significantly
decreased the body weight gain in both WT and IDH2 KO mice despite
having eaten the same amount of diet (Figure 14A&B). The decline in
the weight gain was in accordance with a decrease in total fat mass
(Figure 14C). Lean body mass was also normalized by BHA
supplementation in WT and IDH2 KO mice (Figure 14D). BHA
treatment also decreased the levels of MitoSOX Red staining in brown adipocytes treated with BSA-conjugated palmitate (Figure 15A&B) while increasing both the energy expenditure and mitochondrial DNA copy number in HFD-IDH2 KO BAT (Figure 15C&D).
To verify gene expression that might help define the BHA-mediated protection from HFD-induced weight gain, this study performed RNA-seq in BAT from WT and IDH2 KO mice with HFD or HFD supplemented with BHA. It was observed that the levels of 1396 genes were decreased by 1.5-fold or more due to the HFD in IDH2 KO BAT relative to that in WT BAT (Figure 16A&B). Further, expression of 24 genes among them was significantly increased by BHA treatment (Figure 16C). These included genes that contribute to the mitochondrial function, energy expenditure, NAD regulation, and ROS resolution such as Pgc-1
a, Ucp1, Sirt3, Gpx3, Sod2, Cat, and Nampt as well as
Nadsyn1 (Figure 17A-H). Protein levels for these genes showed partialrestoration with BHA treatment (Figure 18A). The increases in acetyl-lysine of global protein levels were also changed by the BHA treatment (Figure 18B). Taken together, these results indicate that the BHA-mediated ROS scavenging results in, at least, a partial recovery of mitochondrial function and body weight gain, suggesting that the major reason behind the excessive weight gain and mitochondrial dysfunction could be increased downstream ROS resulting from the ablation of IDH2.
3.2. IDH2 Deficiency Induces Dysfunction of Brown Adipose Tissue in Acute Thermogenic Effects:
3.2.1. IDH2 Deficiency Leads to Impaired Thermogenesis in Mice
under the Cold Environment:
To evaluate cold-induced non-shivering thermogenesis in IDH2 KO mice, they were exposed to 4 ℃ for 3 h and then compared to the animals maintained at AT. Both WT and IDH2 KO mice had a similar rectal temperature under the AT and at the early time points (within 1 h) after the cold challenge at 4 ℃ (Figure 19A&B). However, IDH2 KO mice showed a significantly lower rectal temperature than WT mice after exposure to cold for 3 h (Figure 19B), suggesting that IDH2 was required for maintaining the whole-body temperature by non-shivering thermogenesis. Consistent with this model, visual inspection showed that the BAT depots of IDH2 KO mice after cold exposure were bleached, suggesting a decrease in BAT energy expenditure (Figure 19B). Taken together, these results indicated that IDH2-deficiency caused increased BAT-whitening and induced thermogenic dysfunction.
3.2.2. IDH2 Ablation Decreases Thermogenesis and Mitochondrial Biogenesis Marker Genes in BAT:
The BAT from cold-exposed IDH2 KO mice tended to have markedly
lower mRNA levels of thermogenic genes such as Ucp1, Cidea, Prdm16,
elongation of very long chain fatty acids protein 3 (Elovl3), and Fgf21
than those of WT after cold challenge (Figure 20A). These results
suggested that IDH2 genetic ablation decreased the thermogenic effects
of BAT under cold stimulation. The test mice also showed reduced
expression of mitochondrial biogenesis genes such as
Pgc-1a,
peroxisome proliferator-activated receptor gamma 1 (Ppar
g1), nuclearfactor erythroid 2-related factor 2 (Nrf2), cytochrome c oxidase subunit
8B (Cox8b), cytochrome c oxidase subunit 7a1 (Cox7a1), ATP synthase
F1 subunit beta (Atp5b) and transcription factor A mitochondrial (Tfam)
(Figure 20B). Protein levels for UCP1, FGF21, PGC-1a, and PPARg
were decreased in IDH2 KO BAT (Figure 20C). This evident decreased in IDH2 KO BAT was underscored by decreased amounts of proteins belonging to complexes I—V in mitochondria (Figure 21). These findings suggest that IDH2 deficiency in BAT protects the mice from obesity and the related complications by elevating the energy expenditure.
3.2.3. Supplementation of Alpha-ketoglutarate Recovers Thermogenic Impairment in Cold-exposed IDH2 KO Mice:
The levels of metabolic intermediates of TCA cycle, such as succinate,
fumarate, malate, and citrate which are down stream products of aKG
were found to have been significantly reduced in IDH2 KO BAT
(Figure 10C). Therefore, this study hypothesized that the
supplementation of aKG might recover the thermogenic impairment in
cold-exposed IDH2 KO mice. To test the effect of aKG on BAT, WT
and IDH2 KO mice were exposed to 1% aKG via drinking water for 4
wk. Interestingly, aKG supplementation dramatically recovered the body
temperature upon cold exposure in IDH2 KO mice (Figure 22A). Unlike
in control IDH2 KO BAT, BAT of aKG-treated IDH2 KO mice
exhibited mild changes with a browning process upon cold exposure
(Figure 22B). At the mRNA level, the expression of thermogenic genes
(Ucp1, Cidea, Elovl3, and Fgf21) (Figure 23A-D) and mitochondrial
biogenesis genes (Pgc-1
a, Nrf2, Ppar
g1, Cox7a1, and Tfam) (Figure23E-I) was found to be higher in BAT of the aKG-treated IDH2 KO
mice than that in the control IDH2 KO mice. These results suggest that
aKG stimulation enhances the thermogenesis of BAT through
upregulation of the thermogenesis and mitochondrial biogenesis genes in
the IDH2 deficient BAT depots, thus, leading to increased energy
expenditure.
Figure 1. Increased fat accumulation by HFD in IDH2 KO mice. (A) Representative photograph of WT and IDH2 KO mice after 4 wk of HFD feeding. (B) CT images of mice on LFD and HFD after the 4 wk. (C) Images of gonadal fat depot. (D) Relative fat weight of WT and IDH2KO mice.
*p < 0.05 vs.
HFD WT. HFD: high fat diet; IDH2: isocitrate dehydrogenase
2; KO: knockout; LFD: low fat diet; WT: wild type.
Figure 2. HFD leads to change of body composition in IDH2 KO mice.
(A&B) Increased body weight and food consumption in each group over a period of 4 wk. (C&D) Time course of change in fat mass and lean body mass by NMR based on body composition. BW: body weight; FW: fat mass; LW: lean mass;
NMR: nuclear magnetic resonance.
Figure 3. Serum profiling analysis. Serum lipid and liver toxicity marker
profiling analysis of WT and IDH2 KO mice after 4-wk LFD
and HFD.
*p < 0.05 vs. HFD WT. HDL: high-density
lipoprotein; LDL: low-density lipoprotein; NEFA: non-esterified
fatty acids; TC: total cholesterol; TG: triglyceride.
Figure 4. Lower energy expenditure in IDH2 KO mice. Energy expenditure over 24 h period was measured. (A&B) WT and IDH2 KO mice fed with LFD and HFD for 4 wk.
*p < 0.05, vs. HFD WT. EE:
energy expenditure.
Figure 5. Lower physical activity of the IDH2 KO mice. (A&B) Physical
activity during 24 h light and dark cycles recorded at the
second day after 1-day acclimatization in WT and IDH2 KO
mice fed with LFD and HFD for 4 wk. (C&D) Average
amount of food and water intake over a 24 h. NS: not
significant.
Figure 6. Tissue survey of IDH2 gene expression level. Total RNA from the individual tissues was used for qPCR with an internal control DNA standard for quantitation. Values are presented as femtogram of RNA/mg total RNA. Data are from pooled RNA samples from WT mice. BAT: brown adipose tissue; Duod: duodenum; fg: femto gram; Gastro:
gastrocnemius muscle; gWAT: gonadal white adipose tissue;
IDH2: isocitrate dehydrogenase 2; Mix musc: mixed muscle;
rWAT: retroperitoneal white adipose tissue.
Figure 7. IDH2 deficiency induces BAT whitening. (A) Representative image showing BAT deposits. (B) Expression levels of BAT marker genes (Pgc-1
a, Prdm16, Ucp1, and Cidea) in BAT were assessed by qPCR. (C) mRNA levels of WAT related genes (Leptin and Adipoq) in BAT. Total mRNAs were collected and analyzed by qPCR with indicated primers.
**p
< 0.01 and
***p < 0.001 vs. HFD WT. Cidea: cell
death-inducing DNA fragmentation factor alpha-like effector
A; Pgc-1
a: peroxisome proliferator-activated receptor gamma
coactivator 1-alpha;
Prdm16:positive regulatory domain
containing 16; Ucp1: mitochondrial uncoupling protein 1.
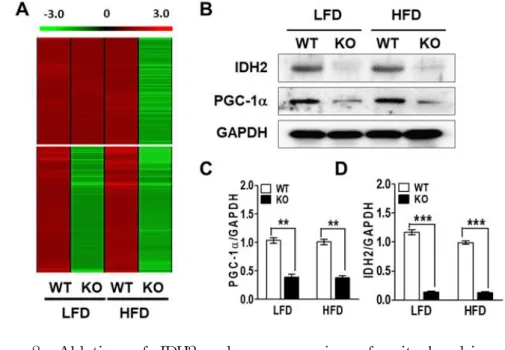
Figure 8. Ablation of IDH2 reduces expression of mitochondria-related genes in BAT. (A) Heat map representation of down regulated genes in IDH2 KO BAT of HFD sample (top) or down regulated in both LFD and HFD (bottom). (B) Western blot data of IDH2 and PGC-1a from BAT of WT and IDH2 KO mice when placed on LFD and HFD. GAPDH was used as a loading control. (C&D) Quantification of IDH2 and PGC-1a protein level.
**p < 0.01 and
***p < 0.001 vs. WT. GAPDH:
glyceraldehyde-3-phosphate dehydrogenase.
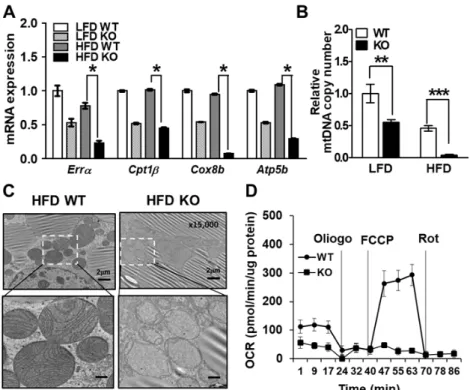
Figure 9. Deficiency of IDH2 decreases mitochondrial function in BAT.
(A) Mitochondrial biogenesis-related genes expression in BAT at WT and IDH2 KO mice. (B) Relative mtDNA content expressed as a function of total nDNA in WT and IDH2 KO BAT. (C) TEM showed multiple sphere-shaped mitochondria, which is characteristic of BAT. (D) Representative time course of OCR of primary brown adipocytes from BAT of WT and IDH2 KO mice.
*p < 0.05,
**p < 0.01 and
***p <
0.001 vs HFD WT or LFD WT.
Atp5b:ATP
synthase F1 subunit beta; Cox8b: cytochrome c oxidase subunit 8B; Cpt1
b: carnitine palmitoyltransferase 1 beta; Err
a: estrogen-related receptor alpha; FCCP: carbonyl cyanide 4-(trifluoromethoxy) phenylhydrazone; mtDNA: mitochondrial DNA; nDNA: nuclear DNA; OCR: oxigen consumption rate;
Oligo: oligomicin; Rot: rotenone.
Figure 10. Organic acid levels from metabolomics analysis. LC/MS/MS analysis was used to measure metabolites associated with mitochondrial function. (A&B) The quantification of NAD
+and NADH, NADP
+and NADPH were determined in BAT of WT and IDH2 KO mice. (C) The level of organic acids was measured in WT and IDH2 KO BAT.
*p < 0.05 vs and
**p
< 0.01 vs LFD WT or HFD WT.
*p < 0.05. NAD
+:
nicotinamide adenine dinucleotide; NADH: nicotinamide
adenine dinucleotide hydrogen; NADP
+: nicotinamide adenine
dinucleotide phosphate; NADPH: nicotinamide adenine
dinucleotide hydrogen phosphate.
Figure 11. Nicotinamide levels are decreased in BAT of IDH2 KO mice.
(A&B) mRNA expression levels of Nampt and Nadsyn1 in BAT from WT and IDH2 KO mice. (C) Western blot data of NAMPT and NADSYN1 from BAT of WT and IDH2 KO mice when placed on LFD and HFD. (D) Protein levels for SIRT1 and SIRT3 in BAT from WT and IDH2 KO mice. (E) Acetylated-lysine level of whole protein in BAT of LFD and HFD WT and IDH2 KO mice.
*p < 0.05,
**p < 0.01 and
***p < 0.001 vs. LFD WT, LFD KO or HFD WT. Nadsyn1:
nicotinamide adenine dinucleotide synthetase 1;
Nampt:nicotinamide phosphoribosyltransferase; SIRT1: sirtuin 1;
SIRT3: sirtuin 3.
Figure 12. ROS production in brown adipocytes of the WT and IDH2 KO mice. (A) Primary brown adipocytes were cultured from WT and IDH2 KO mice and treated with BSA or BSA-conjugated palmitate and stained with MitoSOX-Red followed by FACS analysis. (B) Quantification of FACS data.
*
p < 0.05, vs. BSA WT or PA WT. FACS:
fluorescence-activated cell sorting; mitoSOX: mitochondrial superoxide; PA: palmitic acid; PE: phycoerythrin; ROS:
reactive oxygen species; SSC: side scatter.
Figure 13. The effects of ROS production in the WT and IDH2 KO
BAT. (A) mRNA levels of anti-oxidant genes (Sod2, Gpx3,
Cat) in BAT of WT and IDH2 KO mice. (B) Western blotanalysis of BAT from WT and IDH2 KO mice for the
anti-oxidant genes.
*p < 0.05,
**p < 0.01 and
***p < 0.001
vs. LFD KO or HFD WT. Cat: catase; Gpx3: glutathione
peroxidase 3; Sod2: superoxide dismutase 2.
Figure 14. Body weight and body composition in response to BHA
treatment in WT and IDH2 KO mice. (A) Increased body
weight data of WT and IDH2 KO mice at control or
BHA-treated LFD and HFD for 4 wk. (B) Food consumption in
each group over a period of 4 wk. (C&D) Fat mass and lean
mass determined by NMR based on body composition of WT
and IDH2 KO mice at control or BHA supplemented LFD
and HFD for 4 wk. BHA: butylated hydroxyanisole.
Figure 15. Effect of anti-oxidant reagent against diet-induced obesity.
(A) Primary brown adipocytes from WT and IDH2 KO mice were treated with BSA or BSA-conjugated palmitate and stained with MitoSOX Red followed by FACS analysis. (B) Quantification of stained area from FACS data. (C) Energy expenditure data over 24 h period of WT and IDH2 KO mice at control or BHA supplemented LFD and HFD. (D) Relative mtDNA content expressed as a function of nDNA in BAT from control or BHA-treated HFD-IDH2 KO mice.
*p <
0.05 and
***p < 0.001 vs. PA KO or HFD KO.
Figure 16. RNA-sequencing data by BHA in BAT of HFD-fed IDH2 KO mice. WT and IDH2 KO mice were fed with BHA-treated LFD and HFD for 4 wk. (A&B) Scatterplot of the gene expression ratio in control versus HFD WT or BHA-treated HFD-IDH2 KO mice. Fold change was cutted off by 1.5. (C) Heatmap representation of gene expression differences between control and BHA-treated HFD KO mice as determined by RNA-sequencing of BAT. Acsm3: acyl-CoA synthetase medium chain family member 3; Btc: betacellulin; Cfd: complement factor D; Cntfr:
ciliary neurotrophic factor receptor; Cyp2e1: cytochrome p450
family 2 subfamily E member 1; Eif3j1: eukaryotic translation
initiation factor 3; Fam13a: family with sequence similarity 13
member A; FC: fold change; Hbb-bs: hemoglobin, beta adult s
chain synonyms beta s; Sco2: Sco cytochrome c oxidase
assembly protein 2; Sgk2: serum/glucocorticoid regulated kinase
2; Slc25a34: solute carrier family 25 member 34; Slc27a2: solute
carrier family 27 member 2; Slc4a4: solute carrier family 4
member 4; Xrcc6: x-ray repair cross complementing 6.
Figure 17. Anti-oxidant reagent recovers genes expression in BAT of IDH2 KO mice. Four-wk-old male WT and IDH2 KO mice were fed HFD and where indicated supplemented with BHA for 4 wk. (A-H) Genes expression levels by qPCR analysis.
*
p < 0.05,
**p < 0.01 and
***p < 0.001 vs. HFD KO.
Figure 18. Anti-oxidant restores mitochondrial function in IDH2 KO
mice. (A) BAT samples of WT and IDH2 KO mice were
analyzed for the indicated proteins. (B) Total acetylated
lysine level was measured by Western blot.
Figure 19. Measurement of body temperature in WT and IDH2 KO mice after cold exposure. (A) Basal rectal temperature of 8-wk-old WT and IDH2 KO mice measured in an ambient temperature of 25 ℃. (B) Body temperature curve of WT and IDH2 KO mice exposed to 4 ℃. (C) Representative photographs showing BAT deposits from WT and IDH2 KO mice.
*p <
0.05 and
**p < 0.01 vs. WT. AT: ambient temperature
Figure 20. Thermogenic genes expression in BAT of WT and IDH2 KO
mice. BAT was harvested from IDH2 KO and WT mice
exposed at 25 ℃ or 4 ℃ for 3 h. The mRNA expression
levels of the thermogenic marker genes (Ucp1,
Cidea,Prdm16, Elovl3, and Fgf21) (A) and mitochondrial marker
genes (Pgc-1
a, Nrf2, Ppar
g1, Cox8b, Cox7a1, Atp5b, and Tfam) (B) in BAT of WT and IDH2 KO mice as determinedby qPCR analysis. All genes were normalized by L32. (C) Western blot analysis of BAT from WT and IDH2 KO mice for the thermogenic and mitochondrial marker proteins.
**p
< 0.01 and
***p < 0.001 vs. Cold WT. Cox7a1: cytochrome c oxidase subunit 7a1; Elovl3: elongation of very long chain fatty acids protein 3; Fgf21: fibroblast growth factor 21;
Nrf2: nuclear factor erythroid 2-related factor 2; Pparg1:
peroxisome proliferator-activated receptor gamma 1; Tfam:
transcription factor A mitochondrial.
Figure 21. Mitochondrial OXPHOS levels of BAT in WT and IDH2 KO mice induced by ambient temperature or cold exposure.
Levels of mitochondrial complex proteins. Western blot images of mitochondrial OXPHOS respiratory complex protein levels using the total OXPHOS antibody cocktail. HSP60 and GAPDH used as a loading control. ATP5A: ATP synthase, H
+transporting, mitochondrial F1 complex, alpha subunit;
HSP60: 60 kDa heat shock protein; MTCO1: mitochondrially encoded cytochrome c oxidase I; NDUFB8: NADH dehydrogenase (ubiquinone) 1 beta subcomplex subunit 8;
OXPHOS: oxidative phosphorylation; SDHB: succinate dehydrogenase complex iron sulfur subunit B; UQCRC2:
ubiquinol-cytochrome c reductase core protein 2.
Figure 22. Recovered body temperature in IDH2 KO mice by supplement
of aKG. aKG were supplemented via drinking water for 4
wk. (A) Change in rectal temperatures of WT and IDH2 KO
mice after control (Con) or aKG supplementation at 4 ℃. (B)
Photograph of representative BAT depots dissected from WT
and IDH2 KO mice after cold exposure of control or aKG
treatment.
*p < 0.05 vs. Con KO. aKG: alpha-ketoglutarate
Figure 23. Genes expression by aKG in BAT of WT and IDH2 KO mice. qPCR analysis of genes expression in BAT in mice housed at cold-acclimated of control or aKG treatment. (A-I) Expression levels of Ucp1, Cidea, Elovl3, Fgf21, Pgc-1
a,
Pparg1, Cox7a1, Tfam, and Nrf2 genes were measured byqPCR. All data are shown as the mean ± SEM.
*p < 0.05,
**