• 검색 결과가 없습니다.

Thermal Infrared Remote Sensing Data Utilization for Urban Heat Island and Urban Planning Studies

N/A
N/A
Protected

Academic year: 2021

Share "Thermal Infrared Remote Sensing Data Utilization for Urban Heat Island and Urban Planning Studies"

Copied!
8
0
0

로드 중.... (전체 텍스트 보기)

전체 글

(1)

Thermal Infrared Remote Sensing Data Utilization for Urban Heat Island and Urban Planning Studies

이혜경

1)

Lee, Hye Kyung

1)

Received May 27, 2017; Received June 8, 2017 / Accepted June 19, 2017

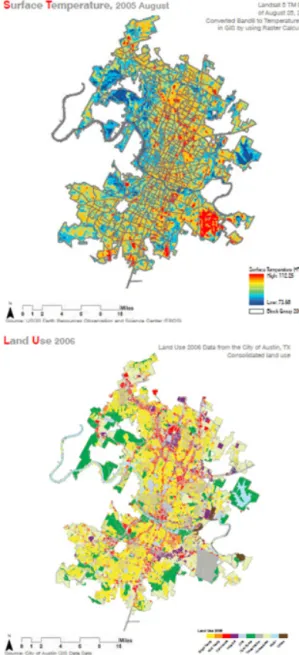
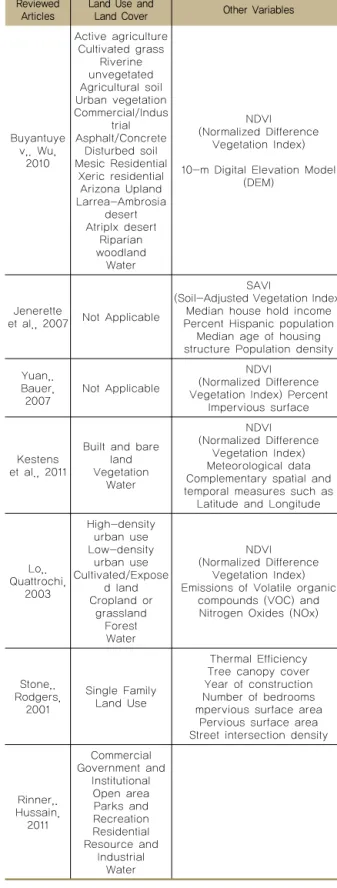
ABSTRACT: Population growth and rapid urbanization has been converting large amounts of rural vegetation into urbanized areas. This human induced change has increased temperature in urban areas in comparison to adjacent rural regions. Various studies regarding to urban heat island have been conducted in different disciplines in order to analyze the environmental issue. Especially, different types of thermal infrared remote sensing data are applied to urban heat island research. This article reviews research focusing on thermal infrared remote sensing for urban heat island and urban planning studies. Seven studies of analyses for the relationships between urban heat island and other dependent indicators in urban planning discipline are reviewed. Despite of different types of thermal infrared remote sensing data, units of analysis, land use and land cover, and other dependent variable, each study results in meaningful outputs which can be implemented in urban planning strategies. As the application of thermal infrared remote sensing data is critical to measure urban heat island, it is important to understand its advantages and disadvantages for better analyses of urban heat island based on this review.

Despite of its limitations – spatial resolution, overpass time, and revisiting cycle, it is meaningful to conduct future research on urban heat island with thermal infrared remote sensing data as well as its application to urban planning disciplines. Based on the results from this review, future research with remotely sensed data of urban heat island and urban planning could be modified and better results and mitigation strategies could be developed.

KEYWORDS: Urban Heat Island, Remote Sensing Data, Land Use, Land Cover 키워드: 도시열섬현상, 원격탐사 데이터, 토지이용, 토지피복

1)정회원, 단국대학교 초고층빌딩 글로벌 R&BD 센터 연구교수 ([email protected]) (교신저자)

DOI: https://doi.org/10.13161/kibim.2017.7.2.036

1. Introduction

According to the United Nations World Urbanization Prospects Revision Report (2014), 66% of the world’s population will live in urban areas by the year 2050.

Population growth and rapid urbanization has been converting large amounts of rural vegetation into urbanized areas. This human induced change has increased temperature in urban areas in comparison to adjacent rural regions. Increased temperature in urban areas results in detrimental impacts on both human and ecosystems (Golden, 2004). Increases in regional temperatures have multiple consequences for ecological and social processes. Direct localized effects of increased temperature include increases in heat stress, and atmospheric pollutants as well as altered hydrologic cycles, population distributions and community interactions for both human and ecosystems (Jenerette et al., 2007). Various

studies regarding to urban heat island have been conducted in different disciplines in order to analyze the environmental issue. Especially, different types of thermal infrared remote sensing are applied to urban heat island research. This article reviews research focusing on thermal infrared remote sensing data for urban heat island and urban planning studies.

2. Urban Heat Island (UHI)

Voogt and Oke (2003) define the urban heat island (UHI)

as the phenomenon of higher atmospheric and surface

temperatures occurring in urban areas than in the sur-

rounding rural areas due to urbanization. Land cover

transformations by replacing natural vegetation and ag-

ricultural lands by impervious surface such as concrete,

asphalt, and roof tops occurs urban heat island (Buyantuyev

(2)

and Wu, 2010). This phenomenon is explained by the low values of albedo, vegetative cover, and moisture contents as well as the presence of high levels of anthropogenic heating in urban areas (Lo and Quattrochi, 2003). Due to the rapid urbanization and population growth, cities grow and impervious surface such as parking lots and trans- portation infrastructure made of concrete and asphalt result in increase of heat absorption and heat capacity. These impervious surfaces release heat more slowly at night than natural ground covers. Other sources of human induced heat such as vehicles, air conditioners, and industry exhaust heat into the air and produce emissions with contaminants that trap heat close to the ground (Grossman-Clarke et al., 2005). These combination processes produce higher nighttime temperatures and generally higher but more variable daytime temperatures in cities than in nearby suburban and rural areas (Harlan et al., 2008).

2.1 Urban Canopy Layer UHI, Urban Boundary Layer UHI Before analyzing urban heat island, it is important to understand different types of terms in relation to urban heat island. Lo and Quattrochi (2003) mention that there are two types of urban heat islands which are urban canopy layer (UCL) and urban boundary layer (UBL). They describe that the UCL is located beneath the roof, whereas the UBL is located above the roofline. Yuan and Bauer (2007) also state that heat islands can be divided in to three categories – canopy layer heat island (CLHI), boundary layer heat island (BLHI), and surface urban heat island (SUHI). They explain that the CLHI and the BLHI are atmospheric heat islands because they represent increase in urban atmosphere.

Meanwhile, the SUHI represents the relative temperature increase of urban surfaces compared to surrounding rural areas. They state that the surface UHI is typically representation of land surface temperature through the use of airborne or satellite thermal infrared remote sensing, whereas ambient urban heat is measured by in-situ weather stations (Yuan and Bauer, 2007).

3. Objectives of Research on Urban Heat Island

This paper examines different types of thermal infrared

remote sensing and its application on urban planning discipline. Although all of the reviewed articles have the same goal of analysis of urban heat island, different research patterns could be noted depending on its objectives.

One of the objectives of a study by Buyantuyev and Wu (2010) is to quantify diurnal and seasonal surface temperature of Phoenix metropolitan area in Arizona at two spatial scales.

Another objective is to study relationships between bio- physical and socioeconomic factors and surface temperature variation. Jenerette et al. (2007) similarly conduct research with an objective to examine the correlations between climate, vegetation, and human settlement patterns in Phoenix metropolitan region. These two articles not only focus on urban heat island in rapidly urbanizing Phoenix metropolitan area, but also integrate biophysical and socioec- onomic factors into urban heat island for better implementations in urban planning discipline.

An article by Lo and Quattrochi (2003) examines the impact of land-use and land cover change in the City of Atlanta, Georgia on urban heat island development and environmental quality for last three decades. Moreover, this article focuses on the health implication of urban heat island in the study area. Kestens et al. (2011) also conduct research with an aim for developing a land-use regression of local surface temperatures using land cover, meteorological, and locational and temporal predictors in Quebec Province, Canada. They integrate this regression model into heat-related population health outcomes over the study area. These two articles examine urban heat island with thermal infrared remote sensing data, as well as they consider health implication for urban heat island research for better im- plementation in urban planning discipline.

Objectives of an article by Stone and Rodgers (2001) are

to quantify the influence of residential development on the

surface heat island in Atlanta metropolitan region and to

determine distinct design attributes such as parcel size,

percentage of impervious and vegetative surface, which

influence urban heat island and thermal efficiency. An article

about Toronto’s urban heat island by Rinner and Hussain (2011)

has objectives to identify relationship between land use and

surface temperature as well as to suggest targeted mitigation

strategies for planning and public health agencies. These two

(3)

articles focus on research about relationships between urban heat island and urban form as well as land use.

Yuan and Bauer (2007) examine the relationships between surface temperature, the normalized difference vegetation index (NDVI), and percent impervious surface in the Twin Cities metropolitan area, Minnesota using thermal infrared remote sensing data acquired from four different seasons.

This study compares impervious surface area and normalized difference vegetation index as indicators of surface urban heat island. Therefore, this article examines better indicator of analyzing the relationship with urban heat island.

4. Advantages of Thermal Infrared Remote Sensing

Most of reviewed articles for this study consider ad- vantages of using thermal infrared remote sensing data compared to in-site meteorological station temperature data. Weng et al. (2011) state that permanent meteorological station data and moving observations using air temperatures cannot provide a synchronized view of temperature over urban areas. First of all, weather stations for in-situ data collection are located usually in airports and parks. Hence, this partial ambient temperature does not represent het- erogeneous urban, suburban and rural landscapes (Kestens et al., 2011). Since temperature data from limited weather stations could result in misleading measures of analysis of urban heat island, it is recommended to use thermal infrared remote sensing data. Compared to the in-situ weather station data, remotely sensed thermal infrared (TIR) data can provide a continuous and simultaneous view of a study area so as to enable detailed analysis of urban heat island in urban planning studies (Weng et al., 2011). On the other hand, thermal infrared remote sensing has several limitations.

Because of limited revisiting cycle prevents direct relation between urban heat island and other related dependent variables (Kestens et al., 2011). Also, TIR data does not provide accurate information of surfaces below tree canopies or shadows of building structures, due to the viewing angle of the sensor (Voogt and Oke, 2003).

4.1 Types of Thermal Infrared Remote Sensing

Along with the above mentioned advantages of thermal

infrared remote sensing, various satellites or airborne sensors such as Advanced Very High Resolution Radiometer (AVHRR), Moderate Resolution Imaging Spectroradiometer (MODIS), and Landsat Thematic Mapper (TM) and Enhanced Thematic Mapper Plus (ETM+) are used for thermal data detection.

Because of spatial resolution, revisiting cycle, and data availability, different satellites or airborne sensors are used for each research. Kestens et al. (2011) use 15 Landsat multispectral images including eight Landsat 7 ETM+ images taken between 1999 and 2000 as well as seven Landsat 5TM images taken between 1987 and 1999 for their research on land surface temperature as determinant of risk of heat-related health events. Lo and Quattrochi (2003) use eight Landsat Multispectral Scanner System(MSS) scenes obtained 1973, 1979, 1983, 1987, 1988, and 1992 as well as three Landsat TM scenes taken in 1987, 1997, and 1998 for their research on land use and land cover change, urban heat island phenomenon, and health implications. Jenerette et al. (2005) use data obtained from Landsat 7 ETM+

instruments in 2000 for their research on regional rela- tionships between surface temperature, vegetation, and human settlement. Buyantuyev and Wu (2010) use the Advanced Spaceborne Thermal Emission and Reflection Radiometer (ASTER) acquired in 2003 for their research on urban heat islands and landscape heterogeneity. Yuan and Bauer (2007) use two Landsat 5 TM images obtained in 2002 and 2000, and two Landsat 7 ETM+ images obtained on 2001 and 2002 for their research on comparison of impervious surface area and normalized difference vegetation index as indicators of surface urban heat island.

Stone and Rodgers (2001) use high resolution thermal images collected by National Aeronautical and Space Admin- istration (NASA) in 1997 for their research on urban form and thermal efficiency. Rinner and Hussain (2011) use Landsat 5 TM images acquired in 2008 for their research on the relationship between land use and surface temperature.

Table 1 explains descriptive information about thermal infrared

remote sensing of each article for this review. For a better

understanding, Figure 1 describes how thermal infrared data

can be utilized for urban planning studies. This shows

surface temperature distribution based on Landsat 5 TM

data for Austin, TX and land use distribution for the same

study area (Lee, 2011).

(4)

Table 1. Descriptive characteristics of the satellite data used for this review

Reviewed

Articles Study Areas Data Spatial

Resolution Date

Buyantuyev,.

Wu, 2010 Phoenix,

AZ ASTER 90m

06/21/2003 06/24/2003 10/20/2003 10/21/2003 Jenerette et

al., 2007 Phoenix,

AZ Landsat 7

ETM+ 60m 05/21/2000

Yuan,.

Bauer, 2007 Twin Cities Metropolit

an Area, MN

Landsat 5 Landsat 7 TM

ETM+

TM 120m ETM+ 60m

07/16/2002 09/12/2000 02/27/2001 05/21/2002

Kestens et al., 2011

Quebec Province,

Canada

Landsat Landsat 5 TM 7 ETM+

TM 120m ETM+ 60m Resampled

to 30m resolution

06/17/1987 07/27/1990 08/07/1994 08/07/1995 07/11/1996 08/02/1998 07/20/1999 06/08/2001 06/15/2001 06/20/2002 06/29/2002 08/27/2000 08/22/1999 06/20/2002 06/22/2002

Lo,.

Quattrochi, 2003

Atlanta, GA

Landsat Landsat MSS

TM

Resampled to a spatial resolution

of 25 meters (TM)

and 57 meters (MSS)

04/13/1973 06/11/1979 05/09/1983 06/29/1987 05/14/1988 04/23/1992 07/29/1997 01/02/1998 Stone,.

Rodgers, 2001

Atlanta,

GA Project

ATLANTA 10m May/1997

Rinner,.

Hussain, 2011

Toronto,

Canada Landsat

TM 60m 09/03/2008

Figure 1. Surface temperature and land use 4.2 Multi-temporal Thermal Infrared Remote Sensing

Data

Some studies consider multi-temporal thermal data, whereas others analyze data only for a specific time frame. For instance, Jenerette et al. examine thermal data of May 21 2000, and Rinner and Hussain use Landsat TM of September 2008. Buyantuyev and Wu study diurnal and seasonal characteristics – two day-night pairs of ASTER thermal infrared remote sensing images from the summer and the autumn - of the surface urban heat island in relation to land cover properties. Lo and Quattrochi also use Landsat MSS and TM images of a period of 25 years. Each of these studies have meaningful results related to urban heat island, however, in order to find out detailed urban heat island

patterns, to generalize it, and to apply its results in other study areas, it is better to analyze multi-temporal thermal infrared remote sensing data.

5. Applied Unit of Analysis

Besides different types of applied thermal infrared remote

sensing data, another noted difference among these articles

is various scales of unit of analysis for each research. As

Jenerette et al. consider social characteristics to analyze

the relationship with urban heat island, they use census

tract as a unit of analysis in order to implement the United

States Census data in to census tract level. By using census

(5)

Table 2. Indicators of urban heat island Reviewed

Articles Land Use and

Land Cover Other Variables

Buyantuye v,. Wu,

2010

Active agriculture Cultivated grass

Riverine unvegetated Agricultural soil Urban vegetation Commercial/Indus

trial Asphalt/Concrete

Disturbed soil Mesic Residential

Xeric residential Arizona Upland Larrea-Ambrosia

desert Atriplx desert

Riparian woodland

Water

(Normalized Difference NDVI Vegetation Index) 10-m Digital Elevation Model

(DEM)

Jenerette

et al., 2007 Not Applicable

(Soil-Adjusted Vegetation Index) SAVI Median house hold income Percent Hispanic population

Median age of housing structure Population density Yuan,.

Bauer,

2007 Not Applicable

(Normalized Difference NDVI Vegetation Index) Percent

Impervious surface

Kestens et al., 2011

Built and bare Vegetation land

Water

(Normalized Difference NDVI Vegetation Index) Meteorological data Complementary spatial and temporal measures such as

Latitude and Longitude

Lo,.

Quattrochi, 2003

High-density urban use Low-density

urban use Cultivated/Expose

d land Cropland or

grassland Forest Water

(Normalized Difference NDVI Vegetation Index) Emissions of Volatile organic

compounds (VOC) and Nitrogen Oxides (NOx)

Stone,.

Rodgers, 2001

Single Family Land Use

Thermal Efficiency Tree canopy cover Year of construction Number of bedrooms mpervious surface area

Pervious surface area Street intersection density

Rinner,.

Hussain, 2011

Commercial Government and

Institutional Open area Parks and Recreation Residential Resource and

Industrial Water

tract as a unit of analysis, they employ US census data for analyzing urban heat island and socioeconomic factors. As Buyantuyev and Wu also implement socio-economic data for their analysis of urban heat islands and landscape heterogeneity, they consider census block group as a unit of analysis. Compared to the research by Jenerette et al., Buyantuyev and Wu use a smaller unit of analysis which is subdivision of the census tract.

Lo and Quattrochi use 13 urban counties in Atlanta metropolitan area for their unit of analysis. Like Lo and Quattrochi, Yuan and Bauer employ 5 counties boundaries of twin cities metropolitan area in Minnesota. Kestens et al.

also consider urban areas boundary of Quebec Province for their unit of analysis. Considering the fact that Canada and the United States have slightly different categories for urban area delineation, the unit of analysis in the study by Kestens et al. could be considered as counties boundaries. Depending on the research goals and objectives, a suitable unit of analysis should be different. In the reviewed articles in this paper, different patterns of a unit of analysis could be noted.

However, there is some potential to be able to develop Lo and Quattrochi’s research by changing its unit of analysis to census tract, which is a finer unit of analysis, to analyze better relationship between public health issues and urban heat island.

6. Indicators of Urban Heat Island Research

6.1 Urban Heat Island and Land Use and Land Cover Classification

Most of reviewed studies in this article consider land use and land cover as a determinant component of urban heat island. Although, the studies employ land use and land cover data for their research, the extent and classification of the land use and land cover differ. Kestens et al. define three land cover categories, including built and bare land, vegetation, and water. Lo and Quattrochi adopt six-class land use and land cover classification. It includes high- density urban use, low-density urban use, cultivated/exposed land, cropland or grassland, forest, and water. Beyantuyev and Wu employed more detailed land use and land cover category scheme for their research. The detailed category includes 15 different types of land use and land cover.

As Stone and Rodgers focus on the relationship between single family housing urban formation and thermal efficiency, they consider only single family land use for their research.

Like Stone and Rodgers, Rinner and Hussain also conduct

(6)

research on urban heat island in urban planning approach considering land use categories from parcel based data instead of land cover data that derived from remote sensing which is conducted for other articles. Table 2 describes different land use and land cover categories applied to the reviewed articles.

6.2 Vegetation Abundance, Impervious Surface and Urban Heat Island

In addition to land use and land cover data, in reviewed articles, vegetation abundance and impervious surface are considered as important variables relating to increase urban heat island in urban areas. Kenstens et al. consider the Normalized Differential Vegetation Index (NDVI) as a predictor of calculated surface temperature. They calculated the NDVI based on Landsat bands 3(Red) and 4(Near-infrared). Lo and Quattrochi also consider the NDVI as a dependent variable in relation to urban heat island. Buyantuyev and Wu use the NDVI as an indicator of affecting urban heat island. They use band 3 and band 2 for near-infrared band and red band, respectively. Instead of using NDVI, Jenerette et al. employ Soil-Adjusted Vegetation Index (SAVI). Stone and Rodgers employ tree canopy cover as a source of each parcel design variable. Specifically, in their study NDVI is calculated as a measure of tree canopy cover. Throughout the article, significant relation between vegetation abundance and urban heat island in urban area is analyzed. The vegetation abundance has significantly negative correlation with urban heat island.

Yuan and Bauer’s study compares the normalized difference vegetation index (NDVI) and percent impervious surface as indicators of surface urban heat island by investigating the relationships between the land surface temperature. As rapid urbanization and population growth increase percent impervious surface in urban areas, analysis of relationship between urban heat island and percent impervious surface in urban areas could be an alternative indicator to analyze urbanization and urban heat island (Yuan and Bauer, 2007).

Compared to the NDVI with seasonal variation, the percent impervious surface is a better indicator and it is less affected by seasonal changes. Above mentioned Table 2 also explains different types of indicator which are used for analysis of urban heat island research and urban planning discipline.

7. Conclusion

This article reviews seven studies which are related to analyses of relationships between urban heat island and other dependent indicators in urban planning discipline. As the rapid urbanization and population growth result in severe urban heat island in urban areas, it is critical to conduct research to analyze its patterns and mitigation strategies which shall be implemented in urban planning discipline.

Despite of different types of thermal infrared remote sensing data, units of analysis, land use and land cover, and other dependent variable, each study results in meaningful outputs which can be implemented in urban planning strategies.

Buyantuyev and Wu (2010) find out that the regression analyses confirm that vegetation acts as an important role in daytime whereas pavements does a critical role in nighttime in explaining spatio-temporal variation of surface temperatures. They explain well established relationship between NDVI and surface temperature and their regression analyses confirm that vegetation and pavements appear as dominant drivers of surface temperature and both are effectively mediated by human. This study has good aspects compared to other studies. One of them is that they use the advanced ASTER instrument so as to conduct analyses at the finer scale to explain temperature patterns. Also, they consider seasonal and diurnal differences in surface tem- perature in Phoenix. This study also suggests that nighttime surface temperatures are less controlled by the socioeconomic variables and it has more correlation with the areas of pavements (Buyantuyev and Wu, 2010). Jenerette et al. (2007) find substantial surface temperature differences within Phoenix metropolitan area and the differences correlate with an index of vegetation cover which is calculated by SAVI.

They also conclude that there heterogeneous patterns vary depending on the social characteristics such as median income and population density. The surface temperature has negative correlation with median incomes within the unit of analysis. This study is meaningful in terms of implementation socioeconomic factors to analyze urban heat island in urban areas.

Kestens et al. (2011) examine a statistical model of surface

temperatures by using basic meteorological, land cover,

and time predictors. This model allows local estimates of

(7)

surface temperature that can be applied public health issues and optimizes the spatial and temporal estimation of surface temperatures. Using epidemiological models provide a way to identify high risk areas with public health issues with low vegetation indexes and to implement urban planning strategies to mitigation urban heat island. Lo and Quattrochi conclude that there has been a great increase in low-density urban use and high-density urban use, whereas there has been a great decrease in forest and cropland. They also mention that there is a negative relationship between NDVI and surface temperature. They suggest that it is recommended to consider other factors such as demographic, socioeconomic, and life style factors to implement public health issues to urban heat island. These two studies provide insights of application of thermal infrared remote sensing to urban planning discipline especially focusing on public health issues. Although both articles have limitations for their analysis, it is still worthwhile to consider remote sensing data for environmental health research. It is obvious to analyze the urban heat island pattern by using thermal infrared remote sensing data. However, it is also critical to implement remote sensing methodology to urban planning discipline which develops regulation and mitigation strategies in urban area with urban heat island issues.

Stone and Rodgers (2001) find out that lower density patterns of residential development create more radiant heat energy to surface temperature formation than higher density development patterns. Rinner and Hussain conclude that there is statistically significant positive correlation between high average temperatures and commercial and resource/

industrial land use, and significant negative correlation between low average temperatures and parks and recreational land and water bodies. This interdisciplinary study of thermal infrared remote sensing and urban planning also suggests that urban planners should analyze existing land use and its impacts on urban heat island to develop regulation and mitigation strategies for urban areas. Results from Yuan and Bauer’s study indicate that percent impervious surface is an accurate determinant of surface UHI with surface temperature’s strong linear relationship with percent impervious surface.

This also indicates that percent impervious surface can be applied as an alternative metric substituting NDVI for analyzing urban heat island over the seasons.

Urban heat island is one of the major environmental issues in urban areas due to rapid urbanization and population growth. As the application of thermal infrared remote sensing data is critical to measure urban heat island, it is important to understand its advantages and disadvantages for better analyses of urban heat island based on this review. As remote sensing technologies is advancing and the importance of big data for better urban environment gets attention, remote sensing data for urban planning discipline should be im- plemented further. Especially, as concern about recent environmental issues such as extreme high temperature of big cities in South Korea has increased, there should be future research on mitigating strategy of urban heat through urban planning using thermal infrared remote sensing. Korea Aerospace Research Institute (KARI) has launched diverse satellites and some of them include high-resolution infrared sensor. This remote sensing data is useful for better analysis of urban heat island effect.

Despite of several limitations of thermal infrared data – spatial resolution, overpass time, revisiting cycle, and viewing angle of remote sensor, it is meaningful to conduct future research on urban heat island with thermal infrared remote sensing data as well as its application to urban planning disciplines. With the different research methods and results from this review, future research with remotely sensed data of urban heat island and urban planning could be modified and better results and mitigation strategies could be developed.

References

Buyantuyev, A. and Wu, J. (2010). Urban Heat Islands and Landscape Heterogeneity: Linking Spatiotemporal Variations in Surface Temperatures to Land-cover and Socioeconomic Patterns. Landscape Ecology, 25, pp. 17-33.

Golden, J. (2004). The Built Environment Induced Urban Heat Island Effect in Rapidly Urbanizing Arid Regions – a Sustainable Urban Engineering Complexity. Environmental Sciences, 1(4), pp. 321-349.

Grossman-Clarke, S., Zehnder, Zehnder, J. A., Stefanov, W. L., Liu, Y., Zoldak, M. A. (2005). Urban Modifications in a Mesoscale Meteorological Model and the Effects on Near-Surface Variables in an Arid Metropolitan Region.

Journal of Applied Meteorology, 44(9), pp. 281-297.

(8)

Harlan, S., Brazel, A., Jenerette, G., Jones, N., Larsen, L., Prashad, L., Stefanov, W. (2008). In the Shade of Affluence:

the Inequitable Distribution of the Urban Heat Island.

Research in Social Problems and Public Policy, 15, pp.

173-202.

Jenerette, G. D., Harlan, S. L., Brazel, A., Jones. N., Larsen, L., Stefanov, W. L. (2007). Regional Relationships between Surface Temperature, Vegetation, and Human Settlement in a Rapidly Urbanizing Ecosystem. Landscape Ecology, 22, pp. 353-365.

Kestens, Y., Brand, A., Fournier, M., Goudreau, S., Kosatsky, T., Maloley, M., Smargiass, A. (2011). Modeling the Variation of Land Surface Temperature as Determinant of RIsk of Heat-related Health Events. International Journal of Health Geographics, 10, pp. 7.

Lee, H. K. (2011). Regional Relationships between Surface Temperature and Population, Land Use Pattern Changes in the City of Dallas and the City of Austin, Texas. Poster session presented at the Association of Collegiate Schools of Planning Annual Conference , October, Salt Lake, UT.

Lo, C. P. and Quattrochi, D. A. (2003). Land-Use and Land- Cover Change, Urban Heat Island Phenomenon, and Health Implications: a Remote Sensing Approach. Photogrammetric Engineering & Remote Sensing, 69(9), pp. 1053-1063.

Rinner, C. and Hussain, M. (2011). Toronto’s Urban Heat Island:

Exploring the Relationship between Land Use and Surface Temperature. Remote Sensing, 3, pp. 1251-1265.

Stone, B. and Rodgers. M. O. (2001). Urban Form and Thermal Efficiency: How the Design of Cities Influences the Urban Heat Island Effect. Journal of the American Planning Association, 67(2), pp. 186-198.

United Nations (2014). World Urbanization Prospects: The 2014 Revision. Department of Economic and Social Affairs, Population Division, New York.

Voogt, J. A. and Oke, T. R. (2003). Thermal Remote Sensing of Urban Climates. Remote Sensing of Environment, 86, pp.

370–384.

Weng, Q., Rajasekar, U., Hu. X. (2011). Modeling Urban Heat Islands and Their Relationship with Impervious Surface and Vegetation Abundance by Using ASTER Images. IEEE Transactions on Geoscience and Remote Sensing, 49(10), pp. 4080-4089.

Yuan, F., Bauer. M. E. (2007). Comparison of Impervious Surface

Area and Normalized Difference Vegetation Index as

Indicators of Surface Urban Heat Island Effects in Landsat

Imagery. Remote Sensing of Environment, 106, pp. 375-386.

수치

Table 1. Descriptive characteristics of the satellite data used  for this review
Table 2.  Indicators of urban heat island Reviewed

참조

관련 문서

This study is based on the fact that demand for housing has been under the influence of change of population structure... people live in

Korea has achieved a high economic progress since 1960s when the rapid industrialization and urbanization were accelerated. This brought many changes in

This maturing market has been typified by a very rapid sales growth, an increased preference for and availability of quality products, continued entry of

In the line of this, in what ways does Design Control in planning policy and the development of Urban Design Code can improve the quality of urban space.. In your opinion, what

Thornley, 2005, Planning World Cities: Globalization and Urban Politics,

The University of Seoul was founded in 1918 and has provided higher education opportunities for the intelligent, motivated, and creative scholars. As a public

The Japanese government and urban planners of the Chinese democratic government adopted a modern urban planning theory (composition of residential areas and green belts,

“There has been a consideration about getting a third vaccine into the supply chain and the ministerial advisory committee on vaccines has looked at this and has looked