• 검색 결과가 없습니다.

IEG 환경지질연구정보센터

N/A
N/A
Protected

Academic year: 2021

Share "IEG 환경지질연구정보센터"

Copied!
4
0
0

로드 중.... (전체 텍스트 보기)

전체 글

(1)

EVALUATION OF SPATIAL SOIL LOSS USING THE LAND USE INFORMATION OF QUICKBIRD SATELLITE IMAGERY

Mi Seon Lee

Doctoral Candidate, Dept. of Rural Engineering, Konkuk University, [email protected]

Jong Yoon Park

Master Candidate, Dept. of Civil and Environmental System Engineering, Konkuk University, [email protected]

In Kyun Jung

Doctoral Candidate, Dept. of Civil and Environmental System Engineering, Konkuk University, [email protected]

Seong Joon Kim

Professor, Dept. of Civil and Environmental System Engineering, Konkuk University, [email protected] ABSTRACT: This study is to estimate the spatial distribution of soil loss using the land use data produced from QuickBird satellite imagery. For a small agricultural watershed (1.16 km

2

) located in the upstream of Gyeongan-cheon watershed, a precise agricultural land use map were prepared using QuickBird satellite image of April 5 of 2003.

RUSLE (Revised Universal Soil Loss Equation) was adopted for soil loss estimation. The data (DEM, soil and land use) for the RUSLE were prepared for 5 m and 30 m spatial resolution. The results were compared with each other and the result of 30 m Landsat land use data.

KEY WORDS: Spatial Soil Loss, Land Use Information, QuickBird Satellite Imagery, RUSLE

1. INTRODUCTION

Soil loss is caused on the topsoil. Thus the reduction of soil productivity can be originated by the occurrence. It loses soil contained organic matter and nutrient eventually causing water pollution as they move into a stream.

Therefore, the prediction of soil loss from a watershed is important. RUSLE (Revised Universal Soil Loss Equation), improved from USLE (USDA, 1997), is the well known and generalized soil loss prediction tool of a watershed. It considers land cover-management and the practice. To calculate and predict soil loss accurately of a watershed, a precise land use that is classified as USGS (United States Geological Survey) Level IV (0.25 - 1.0 m spatial resolution) will become a critical spatial data for improving spatially distributed soil loss and the amount.

KOMPSAT (KOrea Multi-Purpose SATellite)-3 that will have spatial resolutions of 0.8 m panchromatic and 2.8 m multi-spectral images is scheduled to launch in 2008. KOMPSAT-3 image can produce USGS Level IV land use data. This data can be used to identify detail hydrological cycle, soil erosion process, sediment and pollutant transport mechanism (Kim et al., 2007).

This study is to estimate the spatial distribution of soil loss using the land use data produced from QuickBird satellite imagery which is resemble with the spatial resolution and spectral characteristics of KOMPSAT-3.

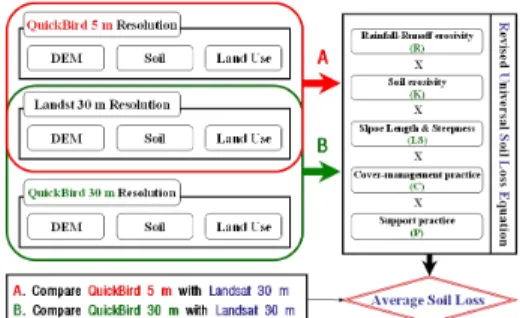
and compare the result with the result of 30 m Landsat land use data. Figure 1 shows the flow chart of this study.

Figure 1. Flow chart of this study.

2. MATERIAL AND METHODS 2.1 The Study Watershed

A small agricultural watershed (1.16 km

2

) located in the upstream of Gyeongan-cheon watershed which is located in Haegok-Dong, Yongin-Si, of Gyeonggi-Do Province in

South Korea.

(Figure 2). The Gyeongan- Cheon is the main tributary of Han river basin which is directly linked to the Paldang lake.

Figure 2. The Study Watershed

(2)

2.2 Land Use Data Preparation Using QuickBird Satellite Image

KOMPSAT-3 has similar spectral characteristics with QuickBird image. QuickBird-2 satellite data can get the image of the spatial resolution of 0.61 m at perpendicular, 0.73 m at angle of 30 degrees in the case of panchromatic, and 2.44 m at perpendicular, 2.9 m at angle of 30 degrees in the case of multispectrum.

In this study, 1st May 2006 QuickBird image was used.

It lies between the coordinates of latitude N 37° 11' 5" to N 37° 12' 0" and longitude E 127° 15' 46" to E 127° 16' 36". The mean spatial resolution of two images is each by 0.635 m in panchromatic, and 2.538 m in multispectrum.

The image was ortho-rectified and geometrically corrected using 2 m DEM (Digital Elevation Model) from NGIS (National Geographic Information System) 1:5,000 digital map and 30 GCPs (Ground Control Points) acquired from SOKKIA GPS (Global Positioning System) equipment. The land use was produced by on- screen digitizing method with GPS field investigation data. The land use was classified with more than 23 categories.

2.3 The Revised Universal Soil Loss Equation

RUSLE (Revised Universal Soil Loss Equation) model was adopted to estimate soil loss of the watershed. The RUSLE can be expressed as Equation 1 (Renard et al., 1997). The RUSLE was integrated within a GIS framework to calculate soil loss spatially. In this module, algorithms and procedures were developed to derive the slope length factor (L) and steepness factor (S) from a DEM (Digital Elevation Model), then integrated with the R, K, C, and P factors to develop homogeneous patches within each field or river basin (FU et. al., 2005).

A = 2.24 R × K × LS × C × P (1) where A = estimated average soil loss (kg/m

2

/year), R = rainfall-runoff erosivity factor(10

7

J/ha·mm/ha), K = soil erodibility factor (kg/m

2

/R), L = slope length factor (dimensionless), S = slope steepness factor (dimensionless), C = cover-management factor (dimensionless), P = support practice factor (dimensionless), Every data was calculated by GIS.

2.4 GIS Data Preparation

Two kinds of spatial resolution (5 m and 30 m) for elevation, land use and detailed soil map were prepared using 1:5,000, 1:25,000 scale of NGIS digital map respectively.

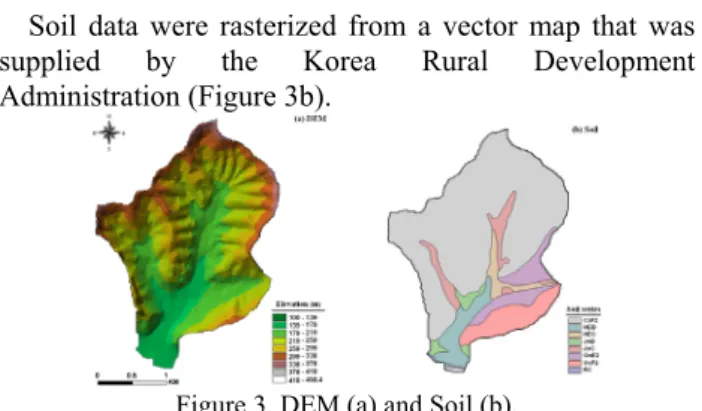
DEM (Digital Elevation Model) for the study area were prepared as input data. Two spatial resolution (5 m and 30 m) of DEM were produced through TIN (Triangular Irregular Network) and lattice transformation process using the 1:5,000 NGIS (National Geographic Information System) digital map. Figure 3a shows the 5 m resolution DEM.

Soil data were rasterized from a vector map that was supplied by the Korea Rural Development Administration (Figure 3b).

Figure 3. DEM (a) and Soil (b).

Land use from QuickBird image was produced by on- screen digitizing method with GPS field investigation data (Figure 4b). Land use data of 30 m resolution were generated from Landsat TM (Thematic Mapper) satellite imageries of 3 June 2004 (Figure 4a). Land cover analyses were achieved through a maximum likelihood classification with average overall accuracy of 95.7 %.

(a) Landsat Land use (b) QuickBird Land use Figure 4. Land Use.

3. RESULTS AND DISCUSSION

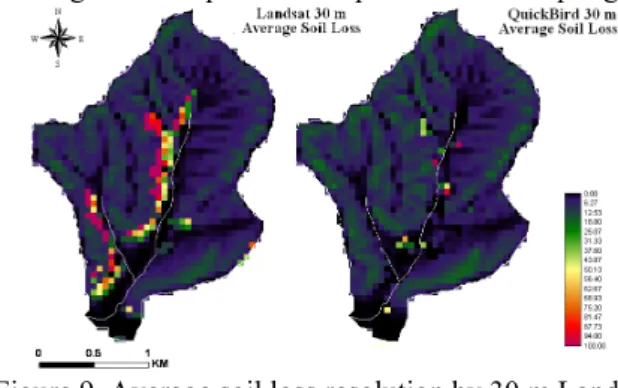
3.1 RUSLE Spatial Soil Loss Using the QuickBird and Landsat Land Use Information

The R factor is the rainfall-runoff erosivity factor. It is the average annual summation (EI) values in a normal year's rain. The R factor according to 30-yr frequency and 24-hr duration is applied (Equation 2).

100

R = ∑ EI

30

(2) where R is rainfall-runoff erosivity factor, E is total rainfall energy (kg·m/m

3

·mm), I

30

is maximum 30-minute rainfall intensity (mm/hr). However, it is difficult to apply Equation 2 where long term rainfall such as 30-yr frequency is hard to be calculated. Therefore, R value was calculated by Equation 3 (Toxopeus, 1998). P is the average annual rainfall (mm/year).

P 35 . 0 85 . 3

R = + × (3)

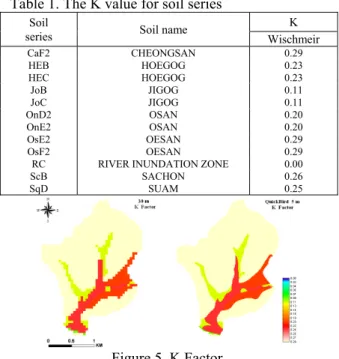
The K factor is soil erodibility factor which represents

both susceptibility of soil to erosion and the rate of runoff,

as measured under the standard unit plot condition. Table

1 shows the soil series and K factor for each soil series in

the study area. Figure 5 shows the K factor calculated

using a detailed soil map (1:25,000) and rasterized as 30

m and 5 m spatial resolution respectively.

(3)

Table 1. The K value for soil series

Soil

series Soil name K

Wischmeir

CaF2 CHEONGSAN 0.29 HEB HOEGOG 0.23 HEC HOEGOG 0.23 JoB JIGOG 0.11 JoC JIGOG 0.11 OnD2 OSAN 0.20 OnE2 OSAN 0.20 OsE2 OESAN 0.29 OsF2 OESAN 0.29

RC RIVER INUNDATION ZONE 0.00

ScB SACHON 0.26 SqD SUAM 0.25

Figure 5. K Factor.

L is the slope length factor, representing the effect of slope length on erosion. S is the slope steepness which represents the effect of slope steepness on erosion. LS values were calculated for each resolution of DEM using Equation 4 (Wischmeier, 1974).

⎟⎟ ⎠

⎜⎜ ⎝

⎛ +

+ +

⎟ +

⎜ ⎞

= ⎛ 0 . 065

10000 S

S 6 . 4 10000 S

S 4 . 65 13 . 22 LS L

2 2 2

m 2

(4) where L is slope length (m), S is slope steepness (%), m is S > 5 % : 0.5, 3.5 < S < 4.5 % : 0.4, 1 < S < 3 % : 0.3, S < 1 % : 0.2. C is the cover-management factor. The C- factor is used to reflect the effect of cropping and management practices on erosion rates. It is the factor used most often to compare the relative impacts of management options on conservation plans. To calculate C value for each resolution, C value of Table 2 according to each land use type was adopted from Park (2003) (Figure 6).

Table 2. The C value for each Land Use type

Item QuickBird Landsat

Land use type C Land use type C 1110 Consolidated paddy 0.300 Paddy 0.300 1210 Specialized crop 0.400

Upland 0.400 1211 Red pepper 0.320

1212 Sesame 0.280 1213 Corn 0.470 1414 Bean 0.760 1220 Pumpkin 0.400 1221 Potato 0.750 1222 Sweet potato 0.340

2110 Grassland 0.050 Grass 0.050 2120 Nature grassland 0.050

2210 Coniferous forest 0.009

Forest 0.009 2220 Broad leaved forest 0.004

2230 Mixed forest 0.007

2320 Graveyard 0.050 Grass 0.050 3140 Bare field 1.000 Bare 1.000 3150 Residential area 0.000

Urban 0.000 3210 Road 0.000

3211 Farm road 0.000 3310 Industrial facility 0.000 3320 Industrial area 1.000 3330 Mining area 0.000

3441 Temple 0.000 3550 Apiary 0.000 3560 Factory 0.000

4210 Stream 0.000 Water 0.000

Figure 6. C Factor.

P is the support practice factor. The RUSLE P-factor reflects the impact of support practices the average annual erosion rate. It is the ratio of soil loss with contouring and/or strip-cropping to that with straight row farming up-and-down slope.

The P factor was decided according to land use type and slope. The land use types are contour, strip cropping and terrace. The P factor values were adopted from NIDP (National Institute for Disaster Prevention) (1998).

Table 3. P value

Slope (%) Contour Strip cropping Terrace

1-3 0.6 0.30 0.12 3-9 0.5 0.25 0.10 9-13 0.6 0.30 0.12 13-17 0.7 0.35 0.14 17-21 0.8 0.40 0.16 21-25 0.9 0.45 0.18

The spatial result of soil loss calculated by RUSLE is shown in Figure 7. At a glance, it shows a big difference of spatial distribution of soil loss. It is caused by the different spatial resolution, different land use categories and different topographic characteristics. The average soil losses for 5 m QuickBird land use and 30 m Landsat land use were 2.93 kg/m

2

/year and 12.34 kg/m

2

/year respectively. The coarse and large areal distribution of land use type of high potential soil loss such as grass and upland in Landsat land use caused the increase of total soil loss in the watershed.

Figure 7. Average soil loss by each resolution.

3.2 Comparison of Average Soil Loss by the 30 m Resampled QuickBird Land Use and Landsat Land Use Condition

To compare the soil loss with the condition of same

spatial resolution by QuickBird land use and Landsat

land use, the 30 m QuickBird land use was prepared by

resampling the 5 m QuickBird land use (Figure 8). Table

(4)

4 summarizes the result of land use area for 30 m resolution of QuickBird land use and Landsat land use.

Figure 8. 30 m resolution of land use (a) Landsat, (b) QuickBird.

Table 4. The result of land use area for 30 m resolution of QuickBird land use and Landsat land use

Item

Land use (km

2

)

Landsat QuickBird Area Ratio (%) Area Ratio (%)

Water 0.00 0.0 0.01 0.7 Forest 1.00 83.2 1.05 87.0

Paddy 0.04 3.2 0.05 4.4

Upland 0.07 6.0 0.02 1.3

Urban 0.04 3.1 0.04 3.0

Grass 0.05 4.5 0.03 2.5

Bare 0.00 0.0 0.01 1.0

To calculate the soil loss for 30 m resolution of QuickBird land use, the RUSLE factors were re- calculated. Figure 9 shows the result of soil loss. The average soil loss for 30 m QuickBird land use was 7.75 kg/m

2

/year. The increase of soil loss came from the reclassification of precise land use type of 5 m QuickBird land use and the increase of high potential soil loss area such as grass and upland in the process of resampling.

Figure 9. Average soil loss resolution by 30 m Landsat land and 30 m QuickBird land use

4. CONCLUSIONS

In this study, a comparison of spatial distribution of soil loss using the land use data acquired from QuickBird and Landsat satellite images was accomplished.

Two cases of spatial soil loss were estimated using RUSLE method. In comparing the result by using 5 m QuickBird land use and 30 m land use, a big difference of spatial distribution was detected by the different spatial resolution, different land use categories and different topographic characteristics. The coarse and large areal distribution of land use type of high potential soil loss such as grass and upland in Landsat land use caused the increase of total soil loss in the watershed. In

comparing the result by using 30 m resampled QuickBird land use and 30 m Landsat land use, the total average soil loss by 30 m QuickBird land use increased comparing with 5 m QuickBird land use. It was caused by the reclassification of precise land use type of 5 m QuickBird land use and the increase of high potential soil loss area such as grass and upland in the process of resampling.

4.1 References

National Institute for Disaster Prevention, 1998. Study on the Sediment Yield Estimation due to Land Development (I). pp. 313.

Cho, H. L., Jeoung, J. C., 2005. Estimating Soil Loss in Alpine Farmland with RUSLE and SEDD. Geographic Information Systems Association of Korea, Vol. 13(1), pp.

79-90.

Lim, K. J., Sangong, M., Bernard A. Engel, Zhenxu Tang, Choi, J. D., Kim, K. S., 2005. GIS-based sediment assessment tool. Catena, Vol. 64, pp. 61-80.

Park, G. F., 2003. Soil erorion risk assessment of the Geumho river watershed using GIS and RUSLE methods.

The Korean Association of Geographic Information Studied, Vol. 6(4), pp. 24-36.

Renard, K. G., Foster, G. R., Weesies, G. A., McCool, D.

K., Yoder, D. C., 1997. Predicting soil erosion by water a guide to conservation planning with the Revised Universal Soil Loss Equation (RUSLE). United States Department of Agriculture, Agricultural Research Service (USDA-ARS) Handbook No. 703, United States Government Printing Office: Washington, DC.

USDA, 1997. Predicting soil erosion by water: A Guide to conservation planning with the RUSLE. Agriculture Handbook, No. 703.

Wischmeier, W. H. and Smith, D. D., 1978. Predicting Rainfall Erosion Losses - A Guide to Conservation Planning, USDA, Agriculture Handbook, No. 537.

Yin, Z., Walcott S., Kaplan, B., Cao, J., Lin, W., Chen, M., Liu, D. and Y, 2005. An analysis of the relationship between spatial patterns of water quality and urban development in Shanghai, China. Computer, Environment and urban systems, Vol. 29, pp. 197-221.

4.2 Acknowledgements

This study was funded by the research project

“Development of Information extraction and Analysis

Technique for Precision Agriculture and Forestry

(M104DA010004-06D0101-00412)” of remote sensing

technology development program by Ministry of Science

and Technology .

수치

Figure 1. Flow chart of this study.
Figure 3. DEM (a) and Soil (b).
Table 1. The K value for soil series
Figure 9. Average soil loss resolution by 30 m Landsat  land and 30 m QuickBird land use

참조

관련 문서

Comparison of Forest Carbon Stocks Estimation Methods Using Forest Type Map and Landsat TM Satellite Imagery* Kyoung-Min Kim**, Jung-Bin Lee***† and Jaehoon Jung****.. **Division

Fifth, the future groundwater recharge quantity affected by climate change was calculated by overlaying the land properties by land properties built by using spatial

Then MODIS satellite images which have been corrected by radiation and geometry in conjunction with the in-situ surface meteorological measurement are used to estimate the surface

Therefore, for the generation of impervious surface map using high resolution satellite image which has various spectral characteristics, this study attempted new classification

In this study the forest type classification methodology is developed and its distribution map was constructed by applying high resolution satellite image, KOMPSAT-MSC, based

So we have developed technology to process multi-resolution imagery, such as IKONOS, SPOT, KOMPSAT, which are used mainly to generate topographic information in KOREA.

This study was carried out to investigate the possibility of biotop mapping using high resolution satellite remote sensing data together with field data and eventually,

This study focuses on automatic road extraction using high-resolution remotely sensed imagery for the aspect of conversion of data into information and for the further