IEG 환경지질연구정보센터
4
0
0
전체 글
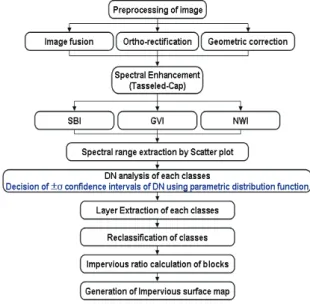
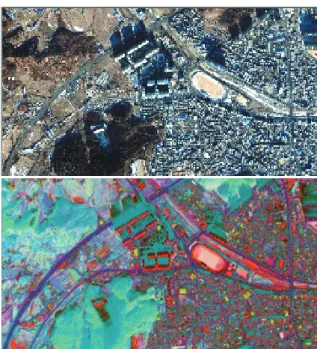
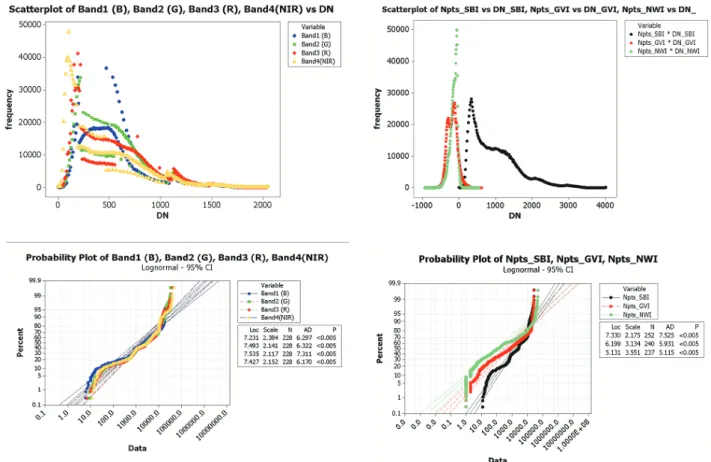
(2) Ikonos and Formosat images that have simultaneous acquisition of the pan and MS, with all 4 MS bands present, and a ratio between the MS and pan image pixels sizes of approximately 4:1. Then, ortho-rectification was carried out by provided RPC(Rational Polynomial Coefficient) data from KOMPSAT-2 and then, Geometric correction also carried out by using 1:5,000 digital reference data. Result of geometric correction, X axial and Y axial and overall root mean squared error(RMSe) were indicated 1.48119 and 1.7218 and 2.2717, respectively. Therefore, this preprocess result of image was permitted to use to this study. In this study, secondly, spectral enhancement method was used for the generation of impervious surface map. Three changed indexes such as Soil Brightness Index(SBI), Green Vegetation Index(GVI), None-such Wetness Index(NWI) were constructed through the tasseled-cap transformation which a spectral enhancement methods. These are operated and converted by 4 bands of IKONOS on basis of 6 bands from the former LandsatTM data(James H. Horne, 2003).. Figure 2. Original image(above) and Tasseled-cap transformed image(below) Also, characteristics of each index in tasseled-cap transformed image in case of probability plot obviously indicated 3.2 Decision of each class’s μ±σ confidence intervals. In the above equations, B1, B2, B3, B4 refer to Blue, Green, Red, NIR band, respectively, from the image. Transformed 3 indexes were created as a new image has peculiar DN value established three bands. Based on this new tasseled-cap transformed image, each class's DN values were extracted using region growing in scatter plot. Then, confidence intervals of extracted DN values are selected through statistic analysis of each class. And then, including DN values in calculated confidence intervals are spread to the each layer. Classified layers through this process are combined to the one image, and obtained image was reclassified with 7 classes. Finally, an impervious surface map was generated by separated blocks in area. Overall process of this study is shown as figure 1.. Suitable range of DN distribution is defined by changing control coefficient(α) of non-exceedance probability(Ha & Bae., 2007). Figure 3 shows an example of non-exceedance probability calculation. DN Ranges of each class are as follows table 1. As a result of defined DN range, error was indicated the smallest when α is 1. So, DN values of each class were extracted by defined ranges through this process.. 3. RESULTS OF STUDY 3.1 Comparison DN histogram and non-exceedance probability between original image and tasselled-cap indexes. The original study area image and the result of tasseled-cap transformed image are as figure 2, and the result of comparing characteristics between original image and Tasseled-cap transformed image is as fig 3. In case of original image, frequencies of each band in the histogram analysis are different, but DN values distribution characteristic of each band is overlaid with other bands. On the other hand, enhanced pixels of SBI by tasseled-cap transformation have very different pattern with GVI and NWI in case of distribution.. Figure 3. An example of non-exceedence probability calculation.
(3) Figure 4. Comparing histograms(above) and probability plots(below) between original image bands(left) and tasseled-cap transformed image(right) 3.3 Generation of land-cover map and impervious surface map. Obtained 14 layers through above process were reclassified to 7 classes with grouping. Reclassified image is as follows fig 5, and area distribution of result is table 2. Especially, classified shadow was removed through visual classifying. Finally, Impervious map generated and impervious ratio calculated by block-size of area for the analyzing impervious surface distribution based on geometric information map of study area. A generated impervious map is as fig 6.. Figure 5. Reclassified land-cover map. 4. CONCLUSION. This study attempted to generate an impervious surface map by applying a stepwise extraction technique through the tasseledcap spectral enhancement methods to the KOMPSAT-2 image. Three Indexes such as SBI, GVI, NWI are constructed by tasseled-cap transformation, and these indexes indicated different DN distribution.. Figure 6. Impervious surface map of study area In part of determining confidence intervals of each class's DN, control coefficient was decided α=1. DN values of each class are extracted by defined ranges based on this control coefficient.. Table 2. Area distribution of reclassified image class. agricultural field. barren. building. forest. road. shadow. vinyl. total. area (㎡). 290,442. 44,454. 211,727. 317,251. 210,492. 306,953. 66,022. 1,447,341.
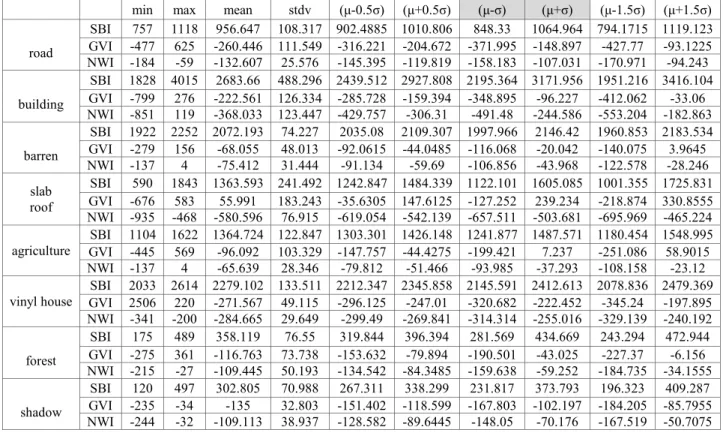
(4) Table 1. μ± α σ confidence intervals of each class. road. building. barren slab roof agriculture. vinyl house. forest. shadow. SBI GVI NWI SBI GVI NWI SBI GVI NWI SBI GVI NWI SBI GVI NWI SBI GVI NWI SBI GVI NWI SBI GVI NWI. min 757 -477 -184 1828 -799 -851 1922 -279 -137 590 -676 -935 1104 -445 -137 2033 2506 -341 175 -275 -215 120 -235 -244. max 1118 625 -59 4015 276 119 2252 156 4 1843 583 -468 1622 569 4 2614 220 -200 489 361 -27 497 -34 -32. mean 956.647 -260.446 -132.607 2683.66 -222.561 -368.033 2072.193 -68.055 -75.412 1363.593 55.991 -580.596 1364.724 -96.092 -65.639 2279.102 -271.567 -284.665 358.119 -116.763 -109.445 302.805 -135 -109.113. stdv 108.317 111.549 25.576 488.296 126.334 123.447 74.227 48.013 31.444 241.492 183.243 76.915 122.847 103.329 28.346 133.511 49.115 29.649 76.55 73.738 50.193 70.988 32.803 38.937. (μ-0.5σ) 902.4885 -316.221 -145.395 2439.512 -285.728 -429.757 2035.08 -92.0615 -91.134 1242.847 -35.6305 -619.054 1303.301 -147.757 -79.812 2212.347 -296.125 -299.49 319.844 -153.632 -134.542 267.311 -151.402 -128.582. Obtained 14 layers through above process are reclassified to 7 classes with grouping. And then Impervious map was generated and impervious ratio was calculated by block-size of area. Overall impervious ratio of study area was 50.38%.. REFERENCE Honglae. Cho., Jongchul. Jeong., 2005. Estimating Impervious Surface Fraction of Tanchon Watershed Using Spectral Mixture Analysis, Korea Journal of Remote Sensing, 21(6), pp.457-468. James H. Horne., 2003. A Tasseled Cap Transformation for IKONOS Images, ASPRS 2003 Annual Conference Proceedings Jiyoung Choi., 2004. Effects of Imperviousness on river water quality, Seoul urban investigation. 5(2), pp.45-58. Sungryong. Ha., Myoungsun. Bae., 2005. Gis-based Influence Analysis of Geomorphological Properties on Pollutant Wash-off in Agricultural area. Water science and Technology. 51(3), pp.301-307. ACKNOWLEGEMENT. Authors would like to thank Korea Aerospace research Institute(KARI) for its financial support(Grant no. ).. (μ+0.5σ) 1010.806 -204.672 -119.819 2927.808 -159.394 -306.31 2109.307 -44.0485 -59.69 1484.339 147.6125 -542.139 1426.148 -44.4275 -51.466 2345.858 -247.01 -269.841 396.394 -79.894 -84.3485 338.299 -118.599 -89.6445. (μ-σ) 848.33 -371.995 -158.183 2195.364 -348.895 -491.48 1997.966 -116.068 -106.856 1122.101 -127.252 -657.511 1241.877 -199.421 -93.985 2145.591 -320.682 -314.314 281.569 -190.501 -159.638 231.817 -167.803 -148.05. (μ+σ) 1064.964 -148.897 -107.031 3171.956 -96.227 -244.586 2146.42 -20.042 -43.968 1605.085 239.234 -503.681 1487.571 7.237 -37.293 2412.613 -222.452 -255.016 434.669 -43.025 -59.252 373.793 -102.197 -70.176. (μ-1.5σ) 794.1715 -427.77 -170.971 1951.216 -412.062 -553.204 1960.853 -140.075 -122.578 1001.355 -218.874 -695.969 1180.454 -251.086 -108.158 2078.836 -345.24 -329.139 243.294 -227.37 -184.735 196.323 -184.205 -167.519. (μ+1.5σ) 1119.123 -93.1225 -94.243 3416.104 -33.06 -182.863 2183.534 3.9645 -28.246 1725.831 330.8555 -465.224 1548.995 58.9015 -23.12 2479.369 -197.895 -240.192 472.944 -6.156 -34.1555 409.287 -85.7955 -50.7075.
(5)
수치
관련 문서
The method was analyzed in terms of appearance, music, and method of map, with six types of ultra-high quality textbooks published over the past five
Therefore this study is to examine various characteristics of Doseon, extract the truth of tale inherent in the tale and show the aspects of Doseon tale
In this study the various modification of configurations of piston crown and spray impingement was attempted to attain a geometry that realize the two
The purpose of this study was to evaluate the curvature of Vertucci's type II mesial canals of mandibular molar using new method; The radius and angle
Among the various methods, plasma electrolytic oxidation (PEO) is a method for surface processing in which a biocompatible oxide film is formed using a number of ions..
In this study, therefore, the method for measuring residual stresses using ESPI technique that is one of the laser applied measurement technique excellent in the view
In this study, paper purposes to evaluate characteristics of machined surface using Atomic Force Microscope in the precision cutting of aluminum( Al 6061 )
For the purpose, this study examined characteristics of surface precision shown on the surface during machining brass(HBsC3C) till 500km of cutting distance
