USING MODIS DATA TO ESTIMATE THE SURFACE HEAT FLUXES OVER TAIWAN’S CHIAYI PLAIN
Han-Chieh Ho
1, Yuei-An Liou
2, Chuan-Sheng Wang
31 PhD student, Institute of Space Sciences, National Central University, TAIWAN [email protected]
2 Professor, Center for Space and Remote Sensing Research and Institute of Space Sciences National Central University, TAIWAN, [email protected]
3 PhD student, Institute of Space Sciences, National Central University, TAIWAN
ABSTRACT ... Traditionally, it is measured by using basin or empirical formula with meteorology data, while it does not represent the evaportransporation over a regional area. With the advent of improved remote sensing technology, it becomes feasible to assess the ET over a regional scale. Firstly, the IMAGINE ATCOR atmospheric module is used to preprocess for the MODIS imagery. Then MODIS satellite images which have been corrected by radiation and geometry in conjunction with the in-situ surface meteorological measurement are used to estimate the surface heat fluxes such as soil heat flux, sensible heat flux, and latent heat flux. In addition, the correlation coefficient between the derived latent heat and the in-situ measurement is found to be over 0.76. In the future, we will continue to monitor the surface heat fluxes of paddy rice field in Chiayi area.
KEY WORDS: surface heat fluxes, Remote sensing, Taiwan’s Chiayi Plain
1 INTRODUCTION
Evapotranspiration is one of the influential factors in hydrological cycle that affects the local and regional water balance. For example, in the semi-arid zone, the evapotranspiration is almost equal to the precipitation and the regional evapotranspiration is more than half of the total precipitation (Engman and Gurney, 1991). However, it is difficult to estimate area evapotranspiration, which is often ignored because of the diverse land cover and temporal change of landscape (USGS, 2006). In Taiwan, the irrigation water for rice cultivation is mostly lost via evapotranspiration and infiltration (Chiang and Huang, 2004). Historical records showed that the amount of irrigation water for rice cultivation in Taiwan should be at least 180-300 mm/month in order to obtain a good yield.
As the rice cultivation is the primary agriculture of Taiwan, the regional evapotranspiration over rice paddy becomes an important issue for water resources management. We used the Simplified Surface Energy Balance Index (S-SEBI) (Roerink et al., 2000) to estimate the evapotranspiration over rice paddy in Taiwan, but did not yield a satisfactory result on the evapotranspiration retrieval (Liou et al., 2002). In this study, the MODIS multispectral image is used to develop a retrieval algorithm for the estimation of the evapotranspiration over rice paddy. We will continue to evaluate the feasibility of long-term monitoring of the evapotranspiration over rice paddy by the MODIS data.
2 PROCEDURE DESCRIPTION 2.1 Methodology
The terminology used in this study to retrieve the surface heat fluxes from remotely sensed data is based on the theory of surface energy and radiation balance. Under steady atmospheric condition, the net radiation can be considered as a balance between incident and outgoing radiations:
4
0 0
(1 )
n s L
R = −
α
R↓+R↓−ε σ
T (1) where Rn = the net radiation (W/m2)Rs↓ = the incident short-wave radiation (W/m2) RL↓
= the incident long-wave radiation (W/m2) α = the surface albedo
ε0 = the surface emissivity of TIR band σ = the Stefan-Boltzmann constant (W/m2K4) T0 = the surface temperature (K)
Furthermore, the surface energy balance at the land-air line can be written as:
0
R
n= G + + H λ E
(2) where Rn = the net radiation (W/m2)G0 = the soil heat flux (W/m2) H = the sensible heat flux (W/m2)
λ E = the latent heat flux (W/m2).
The soil heat flux (G0) can be derived from the method developed by Kustas et al. (1990) and Bastiaanssen et al.
(1998), which is a function of surface albedo, surface
temperature, and normalized difference vegetation index (NDVI):
0
4 0(0.0032 0.0062 )(1 0.987 ) G Rn
T
α
NDVI= Γ ×
Γ = + − (3)
Hence, the sensible heat flux and the latent heat flux then can be determined by using surface radiation and energy balance in conjunction with short/long-wave radiations, and soil heat flux that are derived from remote sensing data.
4
0 0
(1 ) s L
LH = −
α
R↓+R↓−εσ
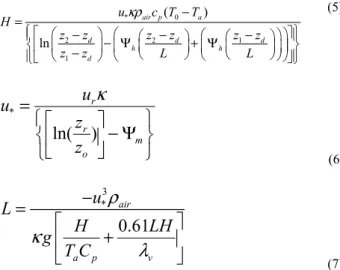
T −G −H (4) where α is the surface albedo, ε is the surface emissivity of TIR band, σ is the Stefan-Boltzmann constant (Wm- 2K-4), T0 is the surface temperature (K)The sensible heat flux is the convergent result of an iterative process. The initialization of the iteration is assumed that the scene is in wet condition and defines the stability condition of the atmosphere by the Monin- Obukhov length convergence. The values of the stability corrections for momentum and heat transport are computed by using the formulations by Dyer (1974).
* 0
2 2 1
1
( )
ln
air p a
d d d
h h
d
u c T T
H z z z z z z
z z L L
κρ −
=⎧⎪⎨⎪⎩⎡⎢⎣ ⎛⎜⎝ −− ⎞⎟⎠ ⎝− Ψ⎛⎜ ⎛⎜⎝ − ⎞⎟⎠+ Ψ⎛⎜⎝ ⎛⎜⎝ − ⎞⎟⎠⎞⎟⎠⎞⎟⎠⎤⎥⎦⎫⎪⎬⎪⎭ (5)
⎭ ⎬
⎫
⎩ ⎨
⎧ ⎥ − Ψ
⎦
⎢ ⎤
⎣
= ⎡
m o
r r
z z u u
) ln(
*
κ
(6)
3
*
0.61
air
a p v
L u
H LH
g T C ρ
κ λ
= −
⎡ ⎤
⎢ + ⎥
⎣ ⎦
(7) where κ is the von Karman’s constant, u* is the frictionvelocity (ms-2), ρair is the density of air (kgm-3), Cp is the air specific heat, L is the Monin-Obukhov length, g is the gravitational constant, z0 is the aerodynamic resistance (m), ur is the wind speed at height zr (ms-2), zd is the displacement height (m),Ψh is the stability correction for heat transport, Ψm is the stability correction for momentum transport, Ta is the air temperature (K)
After the iterative process, the left side of (4) can be estimated and it means the potential latent heat flux.
However, remote sensing data usually include a large number of pixels or area such as very dry regions, and thus heat fluxes in some regions are often underestimated.
Therefore, The fraction factor of evpotranspiration (Λ)
was derived from the scattering plot of surface albedo versus temperature (Fig.1).
Figure 1. The schematic representation of the relation between surface albedo and temperature.
Finally, the actual latent heat flux,
LH
f, from the imagery can be derived as follow,
LH
f= Λ × LH
(9)2.2 Data Collection 2.2.1 In-situ data:
Three micro-meteorological stations were constructed over Chaiyi Plain since late 2005, which include an eddy covariance system (Chaiyi Girl’s Senior High School, 23o28’23.72”N, 120o26’58.99”E) and two Bowen ratio systems (Niaoxiu Station, 23o29’27.78”N, 120o24’26.20”E, and Guogou Station, 23o29’58.33”N, 120o20’06.02”E). The eddy covariance system is located in urban area with concrete surface, and the two Bowen ratio systems are set up on the crop fields. These stations acquire surface meteorological data and incoming/
outgoing radiance in minute- interval, which are used as a reference for data analysis.
2.2.2 Satellite data:
Thirty MODIS images acquired in 2006 were used to estimate the surface heat fluxes over Taiwan’s Chaiyi Plain. Four MODIS bands were used in this study. Band 1 and band 2 were used to estimate the surface albedo and NDVI, and band 31 and band 32 were used to retrieve surface temperature. Table1 shows MODIS bands used in this study.
Table 1. The Bands of MODIS are used in this study
MODIS Spatial Resolution: 1km
Band Bandwidth (µm) Spectral Region 1 0.620-0.670 Red 2 0.841-0.876 Near Infrared (NIR)
31 10.78-11.28 Thermal Infrared (TIR)
32 11.77-12.27 Thermal Infrared
(TIR)
3 RESULTS
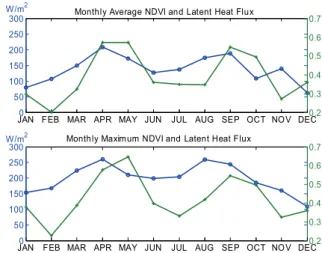
To evaluate the feasibility of long-term monitoring for the evapotranspiration over rice paddy using the relative low-resolution satellite images such as the MODIS images. Thirty MODIS images were used to estimate the surface heat fluxes over rice paddy. Figure 2 shows the monthly average and maximum NDVI, and latent heat flux. Comparison with the monthly average latent heat flux and NDVI, the signatures of the two derived variables presented the characteristics of the typical twice rice rotation in Chiayi area. In addition, the relationship between monthly maximum NDVI and latent heat flux is better than that between monthly average NDVI and latent heat flux. Due to the instrument failure, just 6 data points were used to compare with the in situ data. The correlation coefficient of latent heat flux and sensible heat flux with corresponding in situ observations are 0.76 and 0.45, respectively. Table 2 shows the results.
0 50 100 150 200 250 300
JAN FEB MAR APR MAY JUN JUL AUG SEP OCT NOV DEC0.2 0.3 0.4 0.5 0.6 0.7
0 50 100 150 200 250 300
JAN FEB MAR APR MAY JUN JUL AUG SEP OCT NOV DEC0.2 0.3 0.4 0.5 0.6 0.7 W/m2 Monthly Average NDVI and Latent Heat Flux
Monthly Maximum NDVI and Latent Heat Flux W/m2
Figure 2. Monthly average / maximum NDVI and latent heat flux
Table 2. The heat flux between in-situ and satellite data
0.7618 0.4472
0.4808 0.2119
R
152.4 283.0 130.8 294.1
29.9 86.3 313.1 663.4
356
183.4 248.2 107.6 232.6
41.9 99.0 332.9 580.6
315
271.8 368.2 130.5 150.9
52.1 100.6 454.5 619.7
271
411.9 484.1 108.2 138.9
43.1 108.0 563.2 631.1
242
284.5 297.6 152.0 267.0
76.1 110.0 512.5 675.5
168
In-situ Sat 180.0 379.5 In-situ Sat
168.5 241.7 In-situ Sat
96.2 100.9 In-situ Sat
444.6 722.1
148
LH SH
Go
DOY Rn
4 CONCLUSIONS
This study compares two different methods to estimate/retrieve surface heat fluxes, which includes traditional ground measurement and satellite based remote sensing. The result indicates that using the remote sensing technique to evaluate surface hear/energy has achieved a practical level. For the MODIS images, the correlation coefficient of latent heat flux with corresponding in situ observations is about 0.76. The monthly average latent heat flux in 2006 obviously presented the twice rice rotation over Chiayi Plain and showed a good relationship with NDVI. However, using MODIS data to retrieve heat fluxes still has headroom to improve. For example, the geometry and radiometry can be further improved by careful calculation or geospatial technique, and the ground truth data can be improved and increased. In the future, our method will be continuously improved to retrieve the better evapotranspiration from MODIS data and will be used to monitor long-term evapotranspiration over rice paddy in Taiwan.
REFERENCES
Bastiaanssen, W.G.M., Menenti, M., Feddes, R.A., and Holtslag, A.A.M., 1998. A remote sensing surface energy balance algorithm for land (SEBAL) 1.Formulation.
Journal of Hydrology, 212, pp.198-212.
Chiang J. K. and S. C. Huang. 2004. Studies on the Effects of Direct-seeding and Water Saving Culture on the Water Requirement, Yield and Quality of Rice, Research Bulletin of Tainan District Agricultural Improvement Station ,Vol. 44, pp.43-58. (in Chinese)
Dyer A.J. 1974. A review of flux– profile relationships, Boundary-Layer Meteorol.,Vol.3. pp363-372.
Engman E. T. and R. J. Gurney. 1991. Remote Sensing in Hydrology, Chapman and Hall, London.
Liou Y.-A., Y.-C. Chuang, T. Lee. 2002. Estimate of evapotranspiration over rice fields using high resolution DMSV imagery data, Cross-Strait Symp. on the Remote Sensing and Agricultural Biotechnology, Taiwan,
Roerink G. J., Z. Su., and M. Meneti. 2000. S-SEBI: A simple Remote Sensing Algorithm to Estimate the Surface Balance, Adv. Space Res., Vol. 25, No. 2, pp.147-157.