• 검색 결과가 없습니다.

IEG 환경지질연구정보센터

N/A
N/A
Protected

Academic year: 2021

Share "IEG 환경지질연구정보센터"

Copied!
8
0
0

로드 중.... (전체 텍스트 보기)

전체 글

(1)

1. Introduction

Forest cover mapping using satellite remote sensing is well established as it provides an opportunity to monitor and understand spatial patterns of vegetation and to inform the understanding of biotic and abiotic processes related to those patterns. There are many studies in which the physical and spectral properties associated with vegetation cover and surface morphologic structures observed by remote sensing are being continuously refined (Bradley & Mustard, 2005; Okin & Painter,

2004; Okin et al., 2001; Weeks et al., 1996) especially with the incorporation of spatial patterns of vegetation (Caylor et al., 2004; Okin & Gillette, 2001; Privette et al., 2004; Scholes et al., 2004). In recent times, the technical advances in remote sensing sensor provides high spatial resolution, which enables direct imaging of plant individuals that are at least the size of the ground resolution of the remote sensing image (Schlesinger and Gramenopoulos 1996; Phinn et al. 1996; Okin and Gillette 2001).

The classification of remote sensing data by various procedures is so far based on the radiometric

Object-oriented Classification and QuickBird Multi-spectral Imagery in Forest Density Mapping

S. Jayakumar*, A. Ramachandran**, Jung Bin Lee*

, and Joon Heo*

*School of Civil and Environmental Engineering, Yonsei University, Seoul, Korea

**Tamil nadu Forest Department, Chennai, India

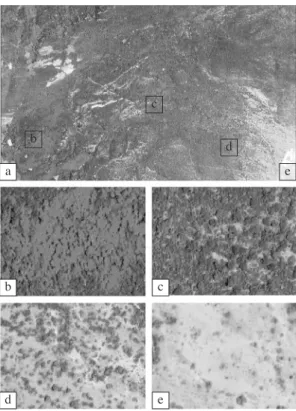
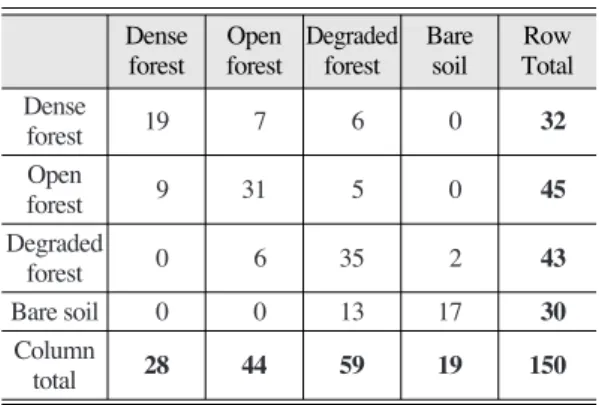
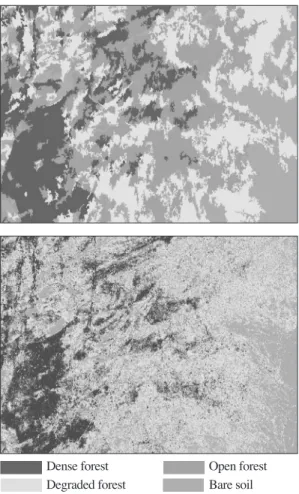
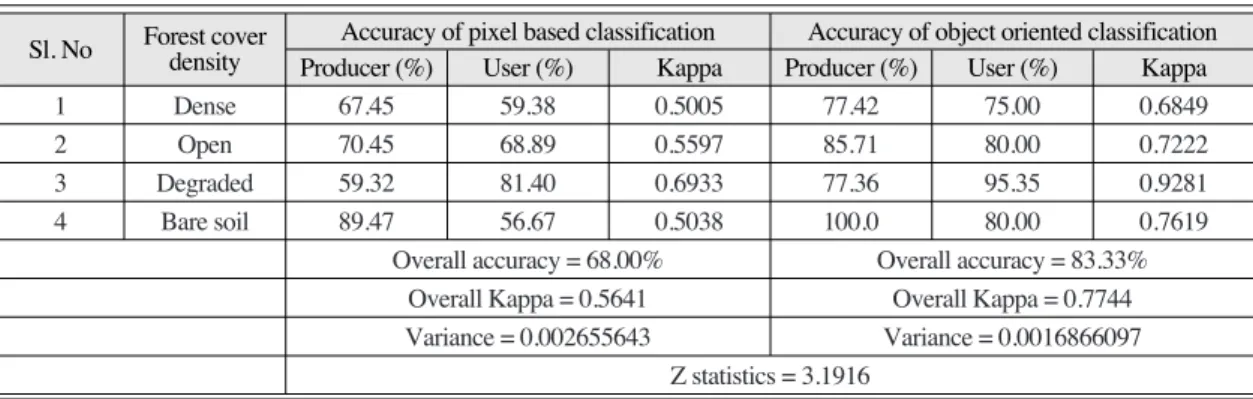
Abstract : Forest cover density studies using high resolution satellite data and object oriented classification are limited in India. This article focuses on the potential use of QuickBird satellite data and object oriented classification in forest density mapping. In this study, the high-resolution satellite data was classified based on NDVI/pixel based and object oriented classification methods and results were compared.

The QuickBird satellite data was found to be suitable in forest density mapping. Object oriented classification was superior than the NDVI/pixel based classification. The Object oriented classification method classified all the density classes of forest (dense, open, degraded and bare soil) with higher producer and user accuracies and with more kappa statistics value compared to pixel based method. The overall classification accuracy and Kappa statistics values of the object oriented classification were 83.33% and 0.77 respectively, which were higher than the pixel based classification (68%, 0.56 respectively). According to the Z statistics, the results of these two classifications were significantly different at 95% confidence level.

Key Words : Object oriented classification, NDVI, Forest density, Eastern Ghats, High-resolution data

Received 28 May 2007; Accepted 4 June 2007.

Corresponding Author: Jung Bin Lee ([email protected])

(2)

information in the image bands. Ideally pixels are expected to be, to a degree, more or less grouped in the multi-spectral space in clusters corresponding to different land cover types (Price, 1994). Classic classification approaches classify an image pixel by pixel and one pixel can only be classified into one class, thus produces a hard classification. This approach performs well but the ability for resolving inter-class confusion is limited. The land cover may be misclassified if they are spectrally similar but compositionally different. Similarly, the spectral heterogeneity of the land cover can lead to rogue pixels appearing within classes creating a ‘salt and pepper’ effect (Whiteside, 2000). In addition to this, the increased application of higher resolution imagery is problematic as it is difficult to classify accurately using traditional pixel-based methods. The increased amount of spatial information often leads to an inconsistent classification of pixels, as a result, in recent years, and following advances in computer technology, alternative strategies have been proposed, particularly the use of artificial neural networks, decision trees, methods derived from fuzzy set theory, and the incorporation of secondary information such as texture, context and terrain features (Tso and Mather, 2001).

The object-oriented classification is a new method, in which new image-analysis tools are introduced.

Here, in contrast to methods used until now, group of pixels called objects, not the individual pixels of the image themselves are examined during the classification process. The object-oriented classification methods suitable for medium to high resolution satellite imagery provide a valid alternative to

‘traditional’ pixel-based methods (Baatz et al., 2004;

Benz et al., 2004). With object oriented image analysis approach, not only the spectral information in the image will be used as classification information, the texture and context information in

the image will be combined into classification as well (Baatz et al., 2004). Most studies claim that object based classification has greater potential for classifying higher resolution imagery than pixel- based methods (Willhauck et al., 2000; Mansor et al., 2002; Oruc et al., 2004). Neimeyer and Canty (2003) claimed that object-oriented classification has greater possibilities for detecting change in higher resolution imagery and Manakos et al. (2000) found that the ancillary data utilized within object-oriented classification is advantageous in improving the classification.

In India, the Forest survey of India (FSI) estimates the forest cover of India once in two years using medium resolution satellite data such as Landsat MSS, TM, IRS 1B LISS II and IRS 1C/1D LISS III data from 1983 onwards. Till 1999 FSI adopted visual classification technique on 1: 250,000 scale and from 2001 onwards it adopted the NDVI based digital classification technique on 1:50,000 scale.

Apart from FSI, there are number of forest cover density studies carried out in India using medium resolution data following the traditional pixel based classification method, but object oriented classification using medium or high-resolution satellite data is very much limited. Therefore in the present study, pixel and object oriented classification methods were tested for forest density classification in a forest region, in the Eastern Ghats of Tamil nadu, India using QuickBird multi-spectral data (2.4 m spatial resolution).

2. Study Area

A forest region covering 601 ha has been selected for the present study, which is situated the Easter Ghats of Tamil Nadu, India (Fig. 1).

The Geographical coordinates of the area range

(3)

between 78˚ 25′37″to 78˚ 27′26″E and 11˚ 18′

10″to 11˚ 19′08″N. The altitude is ranging from 200 to 1100 m above MSL. Geologically, it is occupied by acid charnockite. The study area comprises plateau, valley and foothill. In the forest region patches of semi-evergreen, deciduous, southern thorn and scrub forests are present. The mean annual rainfall is 1318 mm and mean maximum and minimum temperature is 35˚ and 18˚C respectively.

3. Materials and Methods

QuickBird satellite data of July, 2006 (Fig. 2 a-e), Leica GS 20 PDM global positioning system (GPS), Erdas Image processing software 9.1, Definiens Professional -5 eCognition software were used.

ERDAS Imagine was used for pixel based classification and the Definiens’ software product, eCognition was used for object oriented classification.

4. Object-oriented Classification

The process can be split into two steps, segmentation and classification. The object-oriented

approach first involved the segmentation of image data into objects on the defined scale level. The subset images were segmented into object primitives or segments using eCognition. The segmentation of the images into object primitives is influenced by three parameters: scale, colour and form (Willhauck et al., 2000).

The scale parameter set by the operator is influenced by the heterogeneity of the pixels. The colour parameter balances the homogeneity of a segment’s colour with the homogeneity of its shape. The form parameter is a balance between the smoothness of a segment’s border and its compactness. The weighting of these parameters establishes the homogeneity criterion for the object primitives (Definiens, 2006). A visual inspection of the objects resulting from variations in the weightings was used to determine the overall values for the parameter weighting at each scale Fig. 1. Location map of the study area.

Tamil nadu India

Study area

Fig. 2. a. QuickBird satellite data of the study area, b. Dense forest, c. Open forest, d. Degraded forest, e. Bare soil.

a

b

d e

c

e b

c

d

(4)

level (Table 1).

Samples for each class were selected from the image objects to act as training areas for the classification. Objects were assigned class rules using spectral signatures, shape and contextual relationships.

The rules were then used as a basis for the fuzzy classification of the data with the most probable/likely class being assigned to each object.

5. Pixel-based (NDVI) Classification

The pixel-based classification was undertaken using ERDAS Imagine v9.1 image processing software. A normalized difference vegetation index (NDVI) (Jensen, 1996; Lillesand and Kiefer, 2000) was generated from the QuickBird satellite data. An interactive method of display was used to assign threshold values for each density class viz., dense (>40% crown cover), open (10-40%) and degraded (<10%), on the basis of field knowledge (Rawat et al., 2003), and a density map of the forests was prepared. Majority filter (3 ×3) was run on the classified map to remove salt and pepper effect.

Further, sieve and clump functions were also used to remove group of pixels less than four. As the pixel size of QuickBird multispectral data is 2.4 m a group of 2×2 pixels (23 m

2

) was set to be the minimum mapping unit.

6. Accuracy Assessment

The classified forest cover density map of

pixel/NDVI based and object oriented were printed on 1:5,000 scale using an HP plotter. Accuracy check was carried out in 150 points in each map (Table 2 and 3) using a GPS to estimate the accuracy of classification (Congalton, 1991).

The accuracy sample points were distributed randomly in the classified map in proportion to the area of each class. The latitude and longitude values of the accuracy check points were noted, and in the field, the location of each point was identified with the help of the GPS. Given that the GPS accuracy was found to be less than 5 meters in all places, the location of each point was judged to have been identified accurately. Once all of the points were checked, the producer and user accuracy of the individual class as well as the overall accuracy of the Table 1. Segmentation parameters for object oriented

classification of forest density classification.

Classifi Scale Color Shape Compact Smooth cation parameter factor ness ness

Forest 60 0.9 0.1 0.5 0.5

Classifi Scale

Color Shape Compact Smooth cation parameter factor ness ness

Table 3. Accuracy assessment table for object oriented classification of forest density.

Dense Open Degraded Bare Row forest forest forest soil Total Dense

24 4 4 0 32

forest Open

7 36 2 0 45

forest Degraded

0 2 41 0 43

forest

Bare soil 006 24 30

Column

31 42 53 24 150

total

Dense Open Degraded Bare Row forest forest forest soil Total Table 2. Accuracy assessment table for pixel based

classification of forest density.

Dense Open Degraded Bare Row forest forest forest soil Total Dense

19 7 6 0 32

forest Open

9 31 5 0 45

forest Degraded

0 6 35 2 43

forest

Bare soil 00 13 17 30

Column

28 44 59 19 150

total

Dense Open Degraded Bare Row

forest forest forest soil Total

(5)

classification were calculated. The Kappa statistics for each and every individual class were also calculated. The variance of Kappa and Z statistics were computed with 95% confidence level for both classifications (Congalton and Green, 1999).

7. Results and Discussion

The study area comprised of 601 ha (Table 4).

There were semi-evergreen, deciduous, southern thorn and southern thorn scrub forest types. The results of density classification of pixel based and object oriented are discussed below. The visual observation of results of two classifications showed wide variations.

The result of pixel based density classification had salt and pepper effect all through the area (Fig. 3).

The dense forest occupied 92.36 ha in pixel based classification whereas it occupied 113.39 ha in object oriented classification. Accuracy point of view the producer and user accuracy of the dense forest class based on object oriented method were high (77.42 and 75.00 % respectively) when compared to pixel based method (67.45 and 59.38% respectively) (Table 5). In the case of open forest, the area occupied under pixel based and object oriented classifications were 155.0 and 203.9 ha respectively (Table 4). The producer, user and kappa statistics were also higher in the object oriented classification

compared to pixel based methods (Table 5).

The degraded forest class of pixel based classification occupied more area (124.98 ha) when compared to object oriented method (99.12 ha). But accuracy point of view, the object oriented classification had more producer (77.36%) and user (95.35%) accuracies when compared to the pixel based classification. The kappa statistics value also was higher in object oriented classification (0.92) than pixel based classification (0.69) (Table 5). The bare soil class occupied 124.98 ha and 99.12 ha in pixel based and object oriented classification respectively. The overall classification accuracy and overall kappa statistics were 68.0 % and 0.56 in pixel based classification, Table 4. Forest cover density and areal extent of each class in

the study area.

Sl. No. Forest cover Area in hectare density Pixel based Object oriented

1 Dense 92.36 113.39

2 Open 155.33 203.90

3 Degraded 228.74 185.0

4 Bare soil 124.98 99.12

601.41 601.41

Sl. No. Forest cover Area in hectare density Pixel based Object oriented

Fig. 3. a. Forest density classification by object oriented methods, b. Forest density classification by pixel based method.

Dense forest

Degraded forest Bare soil

Open forest

(6)

whereas it was 83.33 % 0.77 in the object oriented classification respectively. The Z-statistics calculated at 95% confidence level proved that these two classifications were significantly different as the value (3.1916) is more than 1.96 (Table 5).

Among the four classes, the bare soil was classified with 100% producer accuracy and the degraded forest was classified with 95.3 % user accuracy in the object oriented classification. In the case of dense and open forest categories, the pixel based classification occupied lesser area when compared to object oriented classification. This is due to the classification methods. The object oriented classification considers group of pixels based on the scale factor rather than single pixel during classification but the pixel based approach considers only individual pixels. Therefore, the salt and pepper effect was totally avoided in object oriented method. Apart from these, the pixel based classification results in a model of the terrain that does not match with the representation of geographical objects, such as parcels and water bodies (Fisher 1997, Stein et al. 1999). As a consequence, the output maps need to be extensively edited before they can be stored into GIS databases.

Object-oriented classification techniques based on image segmentation overcame this inconvenience and generated geo-information that could be immediately usable (Crosset et al., 1988, Franklin and Wilson,

1991, Johnsson, 1994).

8. Conclusion

The use of QuickBird multi-spectral high- resolution image and object-oriented classification technique were highly suitable for forest density studies. Compared to the more traditional NDVI based (pixel based) density classification technique, object-oriented method proved to be significantly different. The object oriented method produced vector maps ready to be integrated and analyzed in a GIS database. In future, forest cover density mapping with object oriented classification method using QuickBird satellite data can be tried for entire India, so that not only the accuracy of classification can be improved, but also the limitations related to spatial resolution of satellite data can be overcome.

Acknowledgements

The first author thanks the Department of Science and Technology, New Delhi, India for supporting this study through SERC Young Scientist Fellowship. We also thank the Tamil Nadu Forest Department for their help.

Table 5. Accuracy assessment values for object oriented and pixel/NDVI based classification methods.

Sl. No Forest cover density Accuracy of pixel based classification Accuracy of object oriented classification Producer (%) User (%) Kappa Producer (%) User (%) Kappa

1 Dense 67.45 59.38 0.5005 77.42 75.00 0.6849

2 Open 70.45 68.89 0.5597 85.71 80.00 0.7222

3 Degraded 59.32 81.40 0.6933 77.36 95.35 0.9281

4 Bare soil 89.47 56.67 0.5038 100.0 80.00 0.7619

Overall accuracy = 68.00% Overall accuracy = 83.33%

Overall Kappa = 0.5641 Overall Kappa = 0.7744 Variance = 0.002655643 Variance = 0.0016866097

Z statistics = 3.1916

Sl. No Forest cover Accuracy of pixel based classification Accuracy of object oriented classification

density Producer (%) User (%) Kappa Producer (%) User (%) Kappa

(7)

References

Baatz, M., Benz, U., Dehghani, S., Heynen, M., Höltje, A., Hofmann, P., Lingenfelder, I., Mimler, M., Sohlbach, M., Weber, M., and Willhauck, G., 2004. eCognition Professional: User guide 4.;

Munich: Definiens-Imaging.

Benz, U., Hofmann, P., Willhauck, G., Lingenfelder, I., and Heynen, M., 2004. “Multi-resolution, object-oriented fuzzy analysis of remote sensing data for GIS-ready information”.

ISPRS Journal of Photogrammetry and Remote Sensing, 58: 239-258.

Bradley, B. A. and Mustard, J. F., 2005. Identifying land cover variability distinct from land cover change: Cheatgrass in the Great Basin.

Remote Sensing of Environment, 94: 204-213.

Caylor, K. K., Dowty, P. R., Shugart, H. H., and Ringrose, S., 2004. Relationship between small-scale structural variability and simulated vegetation productivity across a regional moisture gradient in southern Africa.

Global Change Biology, 10: 374-382.

Congalton, R. G., 1991. “A review of assessing the accuracy of classifications of remotely sensed data”. Remote Sensing of Environment, 37:

35-46.

Congalton, R. G. and Green, J., 1999. Assessing the accuracy of remotely sensed data: principles and practice. New York: Lewis Publishers.

Cross, A. M., Mason, D. C., and Drury, S. J., 1988.

Segmentation of remotely sensed images by a split-and-merge process. International Journal of Remote Sensing, 9: 1329-1345.

Definiens, 2006. Definiens professional user guide, Definiens AG Trappentreustr 1, Germany.

Fisher, P., 1997. The pixel: a snare and a delusion.

International Journal of Remote Sensing, 18:

679-685.

Franklin, S. E. and Wilson, B. A., 1991. Spatial and spectral classification for remote-sensing imagery. Computers and Geosciences, 17:

1151-1172.

Jensen, J. R., 1996. Introductory digital image processing: a remote sensing perspective. 2nd ed.; Upper Saddle River, New Jersey:

Prentice Hall.

Johnsson, K., 1994. Segment-based land-use classification from SPOT satellite data.

Photogrammetric Engineering and Remote Sensing, 60: 47-53.

Lillesand, T. M. and Kiefer, R. W., 2000. Remote sensing and image interpretation. 4th ed.;

New York ; Chichester: Wiley.

Manakos, I., Schneider, T., and Ammer, U., 2000. A comparison betwen the ISODATA and the eCognition classification on basis of field data. Proceedings of XIX ISPRS Congress, 16-22 July, Amsterdam.

Mansor, S., Hong, W. T., and Shariff, A. R. M., 2002.

Object oriented classification for land cover mapping. Proceedings of Map Asia 2002, 7-9 August, Bangkok: GISDevelopment.

Niemeyer, I. and Canty, M. J., 2003. Pixel-Based and Object-Oriented Change Detection Analysis Using High-Resolution Imagery. Proceedings of 25th Symposium on Safeguards and Nuclear Material Managment, 13-15 May, Stockholm.

Okin, G. S. and Gillette, D. A., 2001. Distribution of vegetation in winddominated landscapes:

Implications for wind erosion modeling and landscape processes. Journal of Geophysical Research, [Atmospheres], 106: 9673-9683.

Okin, G. S. and Painter, T. H., 2004. Effect of grain

size on remotely sensed spectral reflectance

of sandy desert surfaces. Remote Sensing of

Environment, 89: 272-280.

(8)

Okin, G. S., Roberts, D. A., Murray, B., and Okin,W.

J., 2001. Practical limits on hyperspectral vegetation discrimination in arid and semiarid environments. Remote Sensing of Environ- ment, 77: 212-225.

Oruc, M., Marangoz, A. M., and Buyuksalih, G., 2004. Comparison of pixel-based and object- oriented classification approaches using Landsat-7 ETM spectral bands. Proceedings of ISPRS Conference, 19-23 July, Istanbul.

Oru

Ç

, M., Marangoz, A. M., and Büyüksalih, G., 2004. Comparison of Pixel-based and Object- oriented Classification Approaches Using LANDSAT-7 ETM Spectral Bands, ISPRS XXth Congress, Istanbul.

Phinn, S., Franklin, J., Hope, A., Stow, D., and Huenneke, L., 1996. Biomass distribution mapping using airborne digital video imagery and spatial statistics in a semi-arid environment. Journal of Environmental Management, 47: 139-164.

Price, J. C., 1994. How unique are spectral signature?

Remote Sensing of Environment, 49: 181-186.

Privette, J. L., Tian, Y., Roberts, G., Scholes, R.

J.,Wang, Y., and Caylor, K. K., et al., 2004.

Vegetation structure characteristics and relationships of Kalahari woodlands and savannas. Global Change Biology, 10: 281-291.

Rawat, J. K., Saxena, A., and Gupta, S., 2003. Remote sensing satellite based forest cover mapping:

Some recent developments. Indian Cartographer 195-198.

Schlesinger, W. H. and Gramenopoulos, N., 1996.

Archival photographs show no climate- induced changes in woody vegetation in the Sudan, 1943-1994. Global Change Biology, 2: 137-141.

Scholes, R. J., Frost, P. G. H., and Tian, Y. H., 2004.

Canopy structure in savannas along a moisture gradient on Kalahari sands. Global Change Biology, 10: 292-302.

Stein, A., Van der Meer, F., and Gorte, B. G. H.

(eds), 1999. Spatial Statistics for Remote Sensing (Dordrecht: Kluwer Academic).

Tso, B. and Mather, P. M., 2001. Classification Methods for Remotely sensed data, Taylor and Francis Inc, ISBN: 0-415-25909-6.

Weeks, R. J., Smith, M., Pak, K., Li, W. H., Gillespie, A., and Gustafson, B., 1996. Surface roughness, radar backscatter, and visible and near-infrared reflectance in Death Valley, California. Journal of Geophysical Research, [Planets], 101: 23077-23090.

Whiteside, T., 2000. Multi temporal land cover change in the Humpty Doo region NT, 1990-1997, Master of Natural Resources Management thesis, University of Adelaide, Adelaide.

Willhauck, G., Schneider, T., De Kok, R., and

Ammer, U., 2000. Comparison of object-

oriented classification techniques and standard

image analysis for the use of change detection

betweeen SPOT multispectral satellite images

and aerial photos. Proceedings of XIX ISPRS

Congress, 16-22 July, Amsterdam.

수치

Fig. 2.  a. QuickBird satellite data of the study area,  b. Dense forest, c. Open forest, d
Table 3.  Accuracy assessment table for object oriented classification of forest density.
Fig. 3.  a. Forest density classification by object oriented methods, b. Forest density classification by pixel based method.
Table 5.  Accuracy assessment values for object oriented and pixel/NDVI based classification methods.

참조

관련 문서

In setting future goals, social-oriented future goals that contribute to the spirit of service and society and family-oriented future goals that emerge

Step 2 can be repeated as many times as necessary to produce the desired level of accuracy, that 

In this paper, it is implemented the image retrieval method based on interest point of the object by using the histogram of feature vectors to be rearranged.. Following steps

After analyzing their behavior and attitude before and after the program, it can be claimed that the group art therapy not only provides the elderly with

In this context, this study would plan and realize ‘Object Method Projection Mapping’ by visualizing the reinterpreted objects’ meaning and project not on

Thus, future films focusing on Zainichi Koreans should work to apparently represent those Koreans’ future-oriented identity with which they keep in mind

Because the microorganisms on the media are resistant to washing off, a long biological retention time can be achieved with short HRT, so the anaerobic filter can be used

In order to create jobs for women, the quality as well as quantity of social childcare services should be increased so that women can be relieved of childcare burden