Effects of soybean isoflavone extract on the plasma lipid profiles and antioxidant enzyme activity in streptozotocin-induced diabetic rats
Jee-youn Shim, Yoo Jung Kim and Hye-Sung Lee §
Department of Food Science and Nutrition, Kyungpook National University, 1370 Sankyuk-dong, Puk-ku, Daegu 702-701, Korea
Received October 10, 2008, Revised November 3, 2008, Accepted November 13, 2008
Abstract
The present study evaluated the effects of various dosages of soybean isoflavone extract on lipid profiles, lipid peroxidation and antioxidant activities in streptozotocin-induced diabetic rats. The one normal control group was fed an AIN-76-based experimental diet and four diabetic groups were fed the same diet, supplemented with four different levels of soybean isoflavone extract for seven weeks. The daily dosages of pure isoflavone for four diabetic groups were set to be 0 mg (diabetic control), 0.5 mg (ISO-I), 3.0 mg (ISO-II) and 30.0 mg (ISO-III) per kilogram of body weight, respectively. The plasma total cholesterol levels and the TBA-reactive substances contents in the liver and kidney were significantly lowered in ISO-II and ISO-III groups compared to those in the diabetic control group. The levels of plasma HDL-cholesterol, plasma vitamin A and hepatic superoxide dismutase were significantly increased in those two groups compared with the diabetic control group. The present study demonstrated the possibility that the diets supplemented with 3.0 mg and 30.0 mg of soybean isoflavone extract may have beneficial effects on the plasma lipids, tissue lipid peroxidation and partly on antioxidant system in diabetic animals and there were no significant differences between the ISO-II and ISO-III groups. The results suggest that the effective daily dosage level of isoflavone for improving lipid metabolism in diabetic rats may be above 3.0 mg per kilogram body weight.
Key Words: Soybean isoflavone extract, diabetic rat, lipid profiles, antioxidant
Introduction 5)
Isoflavones, one of the phytoestrogens have structural and functional similarity to human estrogen with affinity to the estrogen receptor (Kudou et al., 1991). They contain three main compounds, in four chemical forms; aglycones (daidzein, genistein and glycitein), glucosides (daidzin, genistin and glycitin), their malonyl-glycoside and acetyl-glycoside forms (Ohta et al., 1980).
Recent epidemiological evidences and experimental data from animal studies strongly support the beneficial effects of isoflavones in preventing various chronic diseases (Anderson et al., 1999;
Setchell & Cassidy, 1999). The most abundant food sources of isoflavones are soybeans and their products (Wang & Murphy, 1994). Soybeans contain 12 types of isoflavones (Anderson et al., 1998; Kuiper et al., 1997) and the contents of soy isoflavones can vary from 50 to 300 mg/100 g (Eldridge & Kwolek, 1983).
Soy isoflavones have been reported to attenuate bone loss from the lumbar spine in perimenopausal women (Alekel et al., 2000), to lower blood cholesterol levels (Jenkins et al., 2002; Kirk et al., 1998; Raines & Ross, 1995), and to have antioxidant properties in vivo and in vitro experiments (Wei et al., 1993;
Wei et al., 1996). Due to these abilities of soybean isoflavones, they have shown the beneficial effects on prevention and
attenuation in chronic diseases including cancers (Zhang et al., 2004), cardiovascular diseases (Teede, 2001), osteoporosis (Arjmandi et al., 1996) and menopausal symptoms (Somekawa et al., 2001).
Recently, it has been reported that soy isoflavones may also have favorable effects on diabetes mellitus in animals and humans. Genistein was reported to increase glucose-stimulated insulin secretion in both insulin-secreting cell lines and mouse pancreatic islets (Liu et al., 2006) and effectively prevent the glucose autoxidation mediated LDL oxidation which results in atherosclerosis (Exner et al., 2001). Jayagopal et al. (2002) demonstrated that supplementation with phytoestrogens had the beneficial effects on insulin resistance, glycemic control and lipid profiles in postmenopausal women with type 2 diabetes. Ali et al. (2005) showed that isoflavones had hypoglycemic and hypolipidemic effects in lean SHR/N-cp rats but not in obese rats. Lee (2002) exhibited that soybean isoflavone extract had positive effects on the elevation of plasma vitamin A and vitamin E in diabetic animals.
However, to our knowledge, the studies investigating the effects of soybean isoflavone supplementation on lipid metabolism associated with diabetes mellitus are in short. Also, recently, inconsistent results have been reported for the effects of isoflavones in diabetic rats. Lee (2006) investigated the effects
§
Corresponding Author: Hye-Sung Lee, Tel. 82-53-950-6231, Fax. 82-53-950-6229, Email. [email protected]
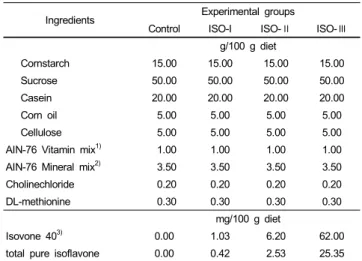
Table 1. The composition of the experimental diets
Ingredients Experimental groups
Control ISO-I ISO-Ⅱ ISO-Ⅲ
g/100 g diet
Cornstarch 15.00 15.00 15.00 15.00
Sucrose 50.00 50.00 50.00 50.00
Casein 20.00 20.00 20.00 20.00
Corn oil 5.00 5.00 5.00 5.00
Cellulose 5.00 5.00 5.00 5.00
AIN-76 Vitamin mix
1)1.00 1.00 1.00 1.00
AIN-76 Mineral mix
2)3.50 3.50 3.50 3.50
Cholinechloride 0.20 0.20 0.20 0.20
DL-methionine 0.30 0.30 0.30 0.30
mg/100 g diet
Isovone 40
3)0.00 1.03 6.20 62.00
total pure isoflavone 0.00 0.42 2.53 25.35
1)
AIN-76 vitamin mix (g/kg mix) : thiamin HCl 0.6, riboflavin 0.6, pyridoxine HCl 0.7, nicotinic acid 3, D-calcium pantothenate 1.6, folic acid 0.2, cyanocobalamin 0.001, retinyl palmitate 0.8 (500,000 IU/g), DL-α-tocopherol acetate 20 (2501 IU/g), cholecalciferol 0.0025, menaquinone 0.005, sucrose to make 1 kg
2)
AIN-76 mineral mix (g/kg mix) : calcium phosphate dibasic 500, sodium chloride 74, potassium citrate monohydrate 220, potassium sulfate 52, magnesiumoxide 24, manganous carbohydrate 3.5, ferric citrate 6, zinc carbonate 1.6, cupric carbonate 0.3, potassium iodate 0.01, sodium selenite 0.01, chromium potassium sulfate 0.55, sucrose to make 1 kg
3)
Isovone 40 (Product No. HF-2002-038, Bioland Inc. Seoul, Korea) contains 40.9%
of total pure isoflavone which consists of 36.9% total aglycone type (22% daidzein, 11.7% glycitein, 6.39% genistein) and 4% total glycoside type
of genistein (60 mg/100 g diet) and soy protein (20 g/100 g diet)-supplemented diets administered to streptozotocin-induced diabetic rats for three weeks and reported the beneficial effects on the levels of lipids in the serum and liver as well as the activities of antioxidant enzymes in the liver. On the other hand, Hsu et al. (2003) found no favorable effect on the plasma lipid levels and the antioxidant enzyme activities in diabetic rats fed a diet supplemented with isoflavones (240-1920 mg/100 g diet) for 24 days. Additionally, we judged that the dosages of isoflavones administered to diabetic rats in these studies were enormously high. Kim and Kwon (2001) reported that total isoflavone intake per capita in Korean population was estimated as 14.88 ± 6.26 mg/d (genistein : 7.32 ± 3.24 mg/d , daidzein 5.81 ± 2.88 mg/d, and glycitein 1.75 ± 0.52 mg/d) and Lee et al. (2000) presented that the mean intake of Korean middle-aged women was assessed to be 24.11 mg/d (0.0 mg-144.30 mg). We already reported that 2.5 mg/100 g diet of soybean isoflavone had the beneficial effects on glucose tolerance and suppression of weight loss in streptozotocin- induced diabetic rats (Shim et al., 2007).
Therefore, the purpose of this study was to examine the effects of supplementation of soybean isoflavone on the lipid profiles as well as the antioxidant activities in streptozotocin-induced diabetic rats at the lower dosage than those used in the previous studies (Hsu et al., 2003; Lee, 2006). Additionally, we investigated the adequate level of supplementation of soybean isoflavone extract which may exhibit the beneficial effects on the lipid profiles and antioxidant system in diabetic animal.
Materials and Methods
Experimental animals and diet
We used the same experimental animals and diets as described in our previous paper (Shim et al., 2007). Briefly, eighty weanling male Sprague-Dawley rats (Biogenomics Co., Korea) were divided into five groups; normal control group, diabetic control group, and three diabetic experimental groups supplemented with three different levels of isoflavone; ISO-I (0.5 mg/kg BW/day; 0.4 mg/100 g diet), ISO-II (3.0 mg/kg BW/day; 2.5 mg/100 g diet) and ISO-III (30.0 mg/kg BW/day; 25.4 mg/100 g diet). The amounts of isoflavone were calculated based on approximate average daily feed intake (30 g) of mature rats and the initial mean body weight (257 g) of experimental rats. All diets contained an identical concentration of energy and nutrients (Table 1) and the animals were fed experimental diets for seven weeks.
Induction of diabetes
The method of diabetes induction was described in our previous paper (Shim et al., 2007). Briefly, diabetes was induced by an injection of streptozotocin (Sigma Chemical, St Louis, MO,
USA) at a dose of 50 mg/kg BW. The rats were considered to be diabetic only if their fasting blood glucose levels exceeded 180 mg/dL. The maintenance of the diabetic state was confirmed by measuring the fasting blood glucose level at the 5
thweek of the experimental period.
Blood and tissue preparation
The blood and tissue preparations were described in our previous paper (Shim et al., 2007). Briefly, after fasting for 12 hours, the blood was drawn from the inferior vena cava of the rats with a syringe treated with heparin (100 units/mL). The plasma was separated by centrifuging at 3,000 rpm for 20 minutes and stored frozen at -70℃. The liver, kidney and heart tissues were excised, rinsed, weighed and stored in a liquid nitrogen tank.
Assessment of concentrations of plasma and tissue lipids The concentrations of triglyceride (Bucolo & David, 1973), total cholesterol (Allain et al., 1974) and HDL-cholesterol (Finley et al., 1978) in the plasma were measured using enzymatic analysis kits (Asan pharmaceuticals, Hwasung, Korea). Total lipids in liver tissue were extracted by the Folch method (Folch et al., 1957), and then triglyceride (Sidney &
Bernard, 1973) and total cholesterol (Sale et al., 1984)
concentrations were measured using commercial enzymatic kits
(Asan Pharmaceuticals).
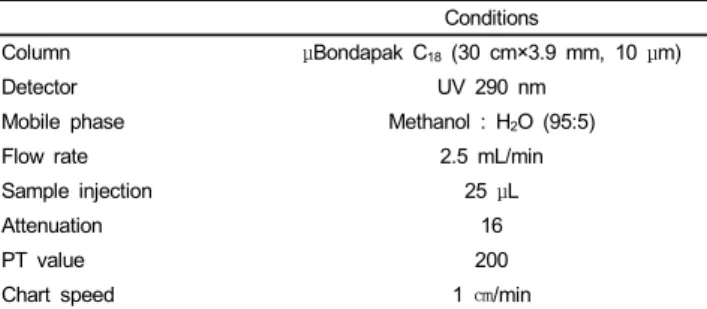
Table 2. HPLC conditions for the determination of plasma vitamin A and E Conditions
Column μBondapak C
18(30 cm×3.9 mm, 10 μm)
Detector UV 290 nm
Mobile phase Methanol : H
2O (95:5)
Flow rate 2.5 mL/min
Sample injection 25 μL
Attenuation 16
PT value 200
Chart speed 1 ㎝/min
Assessment of lipid peroxides in plasma and urine
We assessed the lipid peroxides as thiobarbituric acid-reactive substances (TBARS) by measuring malondialdehyde (MDA) levels in the plasma and tissues. TBARS in the plasma and urine were measured according to the Taladgis method (Taladgis et al., 1964). An aliquot (0.5 mL) of plasma or urine sample was mixed with 3 mL of 5% trichloroacetic acid and 1 mL of 0.06 M TBA, then incubated in 80℃ water bath for 90 minutes. The mixtures were cooled to room temperature, centrifuged at 2,000 rpm for 15 minutes and the absorbance of the supernatants was then measured at 535 nm. Nelson et al. (1993) have reported that TBARS in urine presented in association with the amount of creatinine excreted are statistically more significant; we presented the data as nmol MDA/µmoles creatinine. Creatinine in urine was measured according to the Jaffé reaction method (The Korean Society of Food Science and Nutrition, 2000) by using a kit (Asan pharmaceuticals).
Assessment of lipid peroxides in tissues
TBARS in the liver, kidney and heart tissues were measured according to the Uchiyama and Mihara method (Uchiyama &
Mihara, 1978). After mixing 0.5 g of tissue and 9 times volume of 0.01 M sodium phosphate buffer (pH 7.0), the mixture (0.5 mL) was homogenized and added to the solution composed of 3 mL of 1% phosphoric acid and 1 mL of 0.06 M TBA, and then boiled for 45 minutes. After cooling, the mixture was added to 4 mL of n-butanol and centrifuged at 3,000 rpm for 10 minutes.
The supernatant absorbance was measured at 520 and 535 nm, and the difference of absorbance was used to calculate the peroxide level.
Preparation of hepatic antioxidant enzymes source
A total of 2 g of liver tissue was homogenized with 5 times volume of 0.25 M sucrose solution at 4℃ using a glass teflon homogenizer (Glascol, 099C K44, USD). In order to discard cell debris, the homogenates were centrifuged at 600 ×g for 10 minutes. Then, 3 mL of the supernatant was centrifuged at 10,000
×g for 20 minutes at 4℃ to obtain the mitochondria supernatant and then 5 mL of the supernatant was centrifuged at 105,000
×g for 1 hour at 4℃ using an ultracentrifuge (Beckman, Optima TLX-120) to obtain the cytosol supernatant. The protein contents in the cytosolic fraction were determined by the Bradford method (Bradford, 1976) with bovine serum albumin as the standard.
Assay of catalase activity
The activity of catalase was measured by the Abei method (Abei, 1974). A total of 0.1 mL of 30 mM H
2O
2was added to 2.89 mL of 50 mM potassium phosphate buffer (KH
2PO
4: NaH
2PO4, 1:1.5, pH 7.0). The mixture was incubated for 5
minutes at 25℃ and then the absorbance was measured at 240 nm. Then, 10 ㎕ of liver tissue preparations was added to the mixture and incubated for 5 minutes at 25℃. The absorbance was then measured at 240 nm for 5 minutes. The H
2O
2decomposition rate was calculated and the activity was expressed as H
2O
2μ mol/min/mg protein.
Assay of glutathione peroxidase activity
Glutathione peroxidase (GPx) was determined by the Paglia and Valentine method (Paglia & Valentine, 1967). One tenth mL of 30 mM glutathione reductase, 0.1 mL of 6 mM NADPH and 0.1 mL of 25 µM H
2O
2were subsequently added to 2.6 mL of 0.1 M Tris-HCl buffer (pH 7.2) and incubated for 5 minutes at 25℃. Then, 0.1 mL of liver tissue preparations was added to this mixture and incubated at 25℃ for 5 minutes. The absorbance was then measured at 340 nm. A molar extinction coefficient of 6.22 mM
-1cm
-1was used and the activity was expressed as oxidized NADPH nmol/min/mg protein.
Assay of superoxide dismutase activity
Superoxide dismutase (SOD) was assayed by the Marklund and Marklund method (Marklund & Marklund, 1974). SOD was detected based on its ability to inhibit the superoxide-mediated reduction. One tenth mL of liver tissue preparations and 0.1 mL of 15 mM pyrogallol were added to 2.8 mL of 50 mM Tris-HCl buffer (pH 8.6) containing 10 mM EDTA. After incubation for 10 minutes at 25℃, the reaction was terminated by adding 0.1 mL of 1 N HCl and the absorbance was then measured at 420 nm. The enzyme unit was defined as the amount inhibiting the autoxidation of pyrogallol by 50%.
Assessment of antioxidant nutrients (vitamin A & E) concentration in plasma
The concentrations of vitamin A and vitamin E in the plasma were measured using the Bieri HPLC method (Bieri et al., 1979).
Table 2 shows the HPLC conditions for the determination of
vitamin A and E. One hundred ㎕ of α -tocopheryl acetate and
100 ㎕ of retinyl acetate were added to 200 ㎕ of plasma as
an internal standard and the solutions were mixed. A total of
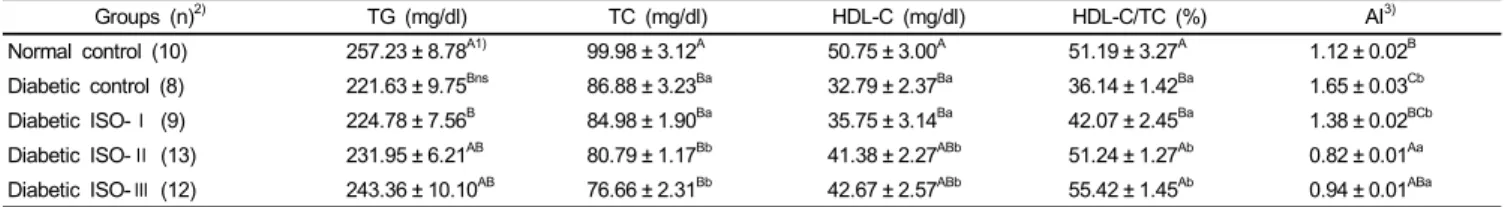
Table 3. Effects of soybean isoflavones extract supplementation on plasma lipids concentrations and atherogenic index in STZ-induced diabetic rats
Groups (n)
2)TG (mg/dl) TC (mg/dl) HDL-C (mg/dl) HDL-C/TC (%) AI
3)Normal control (10) 257.23 ± 8.78
A1)99.98 ± 3.12
A50.75 ± 3.00
A51.19 ± 3.27
A1.12 ± 0.02
BDiabetic control (8) 221.63 ± 9.75
Bns86.88 ± 3.23
Ba32.79 ± 2.37
Ba36.14 ± 1.42
Ba1.65 ± 0.03
CbDiabetic ISO-Ⅰ (9) 224.78 ± 7.56
B84.98 ± 1.90
Ba35.75 ± 3.14
Ba42.07 ± 2.45
Ba1.38 ± 0.02
BCbDiabetic ISO-Ⅱ (13) 231.95 ± 6.21
AB80.79 ± 1.17
Bb41.38 ± 2.27
ABb51.24 ± 1.27
Ab0.82 ± 0.01
AaDiabetic ISO-Ⅲ (12) 243.36 ± 10.10
AB76.66 ± 2.31
Bb42.67 ± 2.57
ABb55.42 ± 1.45
Ab0.94 ± 0.01
ABaISO: soybean isoflavone extract, STZ: streptozotocin, TG: triglyceride, TC: total cholesterol, HDL: high density lipoprotein, C: cholesterol, AI=atherogenic index
1)
Mean ± S.E.
2)
Number of animals
3)
AI=(TC-HDL-C)/HDL-C
Different capital superscripts in the same column indicate significant difference (p<0.05) among 5 groups by Duncan's multiple comparison test.
Different small superscripts in the same column indicate significant difference (p<0.05) among 4 diabetic groups by Duncan's multiple comparison test.
ns
Not significantly different among 4 diabetic groups (p<0.05)
Table 4. Effects of soybean isoflavone extract supplementation on hepatic lipid concentrations in STZ-induced diabetic rats
Groups (n)
2)Triglyceride Total cholesterol
(mg/g tissue)
Normal control (10) 35.61 ± 3.04
A1)19.69 ± 0.53
NSDiabetic control (8) 26.34 ± 1.15
Bns21.26 ± 0.71
nsDiabetic ISO-Ⅰ (9) 27.96 ± 2.89
B22.77 ± 0.89
Diabetic ISO-Ⅱ (13) 24.85 ± 2.24
B22.78 ± 0.83
Diabetic ISO-Ⅲ (12) 25.72 ± 1.41
B23.32 ± 0.53
ISO : soybean isoflavone extract, STZ : streptozotocin
1)
Mean ± S.E.
2)
Number of animals
Different capital superscripts in the same column indicate significant difference (p<0.05) among 5 groups by Duncan's multiple comparison test.
Different small superscripts in the same column indicate significant difference (p<0.05) among 4 diabetic groups by Duncan's multiple comparison test.
NS
Not significantly different among 5 groups (p<0.05)
ns
Not significantly different among 4 diabetic groups (p<0.05)
200 ㎕ of heptane for HPLC analysis was added to the solution and the mixture was centrifuged at 1500 rpm for 5 minutes. The supernatant was then collected in a brown vial of interception light. This supernatant was filtered using a 0.45 µM membrane filter (Millipore Corporation, Bedford, MA 01730) and dried under N
2gas. This extract was dissolved in a diethyl ether:
methanol (1:3, v/v) solution and was then analyzed by HPLC (Waters 500).
Statistical analysis
Data were presented as means and standard errors of the mean.
Group means were compared by an Analysis of Variance using Duncan’s multiple range test and differences were considered to be statistically significant at p value of less than 0.05. All statistical tests were performed by using the Windows SPSS program (SPSS, Chicago, IL, USA: Version 10.0).
Results
Effect on plasma and hepatic lipids
The plasma triglyceride and total cholesterol levels in the diabetic control group were significantly lower (p<0.05) than those in the normal control group (Table 3). Among diabetic rats, there were no significant differences (p<0.05) in the triglyceride levels. However, the levels of plasma total cholesterol in ISO-II and ISO-III groups were significantly lower (p<0.05) than those in the diabetic control and ISO-I groups. The HDL-cholesterol level and the ratio of HDL-cholesterol/total cholesterol in the diabetic control group were significantly lower (p<0.05) than those in the normal control group. Among diabetic groups, the ISO-II and ISO-III groups showed significantly higher (p<0.05) HDL-cholesterol levels and ratios of HDL- cholesterol/total cholesterol than diabetic control and ISO-I groups. The atherogenic index (AI) of the diabetic control group was significantly higher (p<0.05) than that of the normal control group. Among the diabetic groups, the ISO-II and ISO-III groups exhibited significantly lower (p<0.05) AI than the diabetic control
and ISO-I groups.
The hepatic triglyceride level in the diabetic control group was significantly lower (p<0.05) than that in the normal control group and there were no significant differences among the diabetic groups (Table 4). There were no significant differences (p<0.05) in the level of hepatic total cholesterol among all groups including the normal control, diabetic control and three isoflavone-supplemented groups.
Effect on the lipid peroxides levels in plasma, urine and tissues
We expressed the lipid peroxides as TBARS by measuring the
MDA levels in plasma, urine and tissues. MDA is the final
product of the degradation of lipid peroxides, which has been
used as a biochemical index of lipid peroxide-mediated tissue
damages in vivo (Pierro et al., 1992). The plasma TBARS levels
showed no significant differences (p<0.05) in all groups,
including normal control, diabetic control and three isoflavone-
supplemented groups (Table 5). When the TBARS content in
the urine was calculated per 100 g body weight per day, it was
found that the levels of all of the diabetic groups were
significantly higher (p<0.05) than that of the normal control
group. However, based on the amount of creatinine excreted, the
urinary TBARS levels in all of the diabetic groups were
Table 5. Effects of soybean isoflavone extract supplementation on the levels of TBA-reactive substances in plasma and urine of STZ-induced diabetic rats
Groups (n)
2)Plasma Urine Urine
(nmol/mL) (nmol/100 g BW/d)
(nmol/µmol creatinine) Normal control (10) 8.37 ± 0.49
NS1)48.39 ± 5.30
A15.78 ± 0.37
ADiabetic control (8) 8.25 ± 0.55
ns107.97 ± 5.38
Bns8.06 ± 0.88
BnsDiabetic ISO-Ⅰ (9) 8.03 ± 1.07 118.53 ± 10.20
B8.07 ± 0.39
BDiabetic ISO-Ⅱ (13) 7.62 ± 0.48 119.94 ± 7.68
B8.32 ± 0.71
BDiabetic ISO-Ⅲ (12) 7.77 ± 0.42 114.95 ± 11.81
B8.40 ± 0.58
BISO: soybean isoflavone extract, STZ: streptozotocin
1)
Mean ± S.E.
2)
Number of animals
Different capital superscripts in the same column indicate significant difference (p<0.05) among 5 groups by Duncan's multiple comparison test.
Different small superscripts in the same column indicate significant difference (p<0.05) among 4 diabetic groups by Duncan's multiple comparison test.
NS
Not significantly different among 5 groups (p<0.05)
ns
Not significantly different among 4 diabetic groups (p<0.05)
Table 6. Effects of soybean isoflavone extract supplementation on the levels of TBA-reactive substances in liver, kidney and heart tissues of STZ-induced diabetic rats
Groups (n)
2)Liver Kidney Heart
(mmol/g tissue)
Normal control (10) 15.28 ± 0.51
A1)50.48 ± 4.69
A29.04 ± 1.64
NSDiabetic control (8) 20.10 ± 0.78
Cc65.72 ± 7.26
Ba25.52 ± 1.03
nsDiabetic ISO-Ⅰ (9) 17.77 ± 0.83
Bb63.82 ± 3.08
Ba25.56 ± 1.52 Diabetic ISO-Ⅱ (13) 14.38 ± 0.56
Aa49.67 ± 4.27
Ab26.72 ± 1.95 Diabetic ISO-Ⅲ (12) 14.45 ± 0.39
Aa52.58 ± 4.16
Ab29.00 ± 0.86 ISO: soybean isoflavone extract, TBA: thiobarbituricacid, STZ: streptozotocin
1)
Mean ± S.E.
2)
Number of animals
Different capital superscripts in the same column indicate significant difference (p<0.05) among 5 groups by Duncan's multiple comparison test.
Different small superscripts in the same column indicate significant difference (p<0.05) among 4 diabetic groups by Duncan's multiple comparison test.
NS
Not significantly different among 5 groups (p<0.05)
ns
Not significantly different among 4 diabetic groups (p<0.05)
Table 7. Effects of soybean isoflavone extract supplementation on hepatic antioxidant enzyme activities in STZ-induced diabetic rats
Groups (n)
2)CAT GPx SOD
(umol/min/
mg protein)
(nmol/min/
mg protein) (unit/mg protein) Normal control (10) 2.46 ± 0.13
A1)5.29 ± 0.32
NS11.52 ± 0.14
ADiabetic control (8) 1.73 ± 0.08
Bns4.96 ± 0.17
ns9.01 ± 0.38
CaDiabetic ISO-Ⅰ (9) 1.77 ± 0.13
B5.18 ± 0.10 9.80 ± 0.08
BbDiabetic ISO-Ⅱ (13) 1.81 ± 0.07
B5.24 ± 0.12 10.03 ± 0.12
BbDiabetic ISO-Ⅲ (12) 1.80 ± 0.05
B4.97 ± 0.17 10.05 ± 0.21
BbISO: soybean isoflavone extract, STZ: streptozotocin, GPx: glutathione peroxidase, SOD: superoxide dismutase
1)
Mean ± S.E.
2)
Number of animals
Different capital superscripts in the same column indicate significant difference (p<0.05) among 5 groups by Duncan's multiple comparison test.
Different small superscripts in the same column indicate significant difference (p<0.05) among 4 diabetic groups by Duncan's multiple comparison test.
NS
Not significantly different among 5 groups (p<0.05)
ns
Not significantly different among 4 diabetic groups (p<0.05)
Table 8. Effects of soybean isoflavone extract supplementation on plasma levels of vitamin A and E in STZ-induced diabetic rats
Groups (n)
2)Vitamin A Vitamin E
(mmol/L)
Normal Control (10) 5.27 ± 0.10
A1)331.00 ± 11.97
NSDiabetic control (8) 4.50 ± 0.25
Ba324.29 ± 13.93
nsDiabetic ISO-Ⅰ (9) 4.69 ± 0.08
ABa318.33 ± 11.35 Diabetic ISO-Ⅱ (13) 5.26 ± 0.20
Ab311.28 ± 5.71 Diabetic ISO-Ⅲ (12) 5.06 ± 0.30
ABb319.17 ± 9.29 ISO : soybean isoflavone extract, STZ : streptozotocin
1)
Mean ± S.E.
2)
Number of animals
Different capital superscripts in the same column indicate significant difference (p<0.05) among 5 groups by Duncan's multiple comparison test.
Different small superscripts in the same column indicate significant difference (p<0.05) among 4 diabetic groups by Duncan's multiple comparison test.
NS
Not significantly different among 5 groups (p<0.05)
ns