Assessment of the Urban Heat Island Effects with LANDSAT and KOMPSAT-2 Data in Cheongju
Sang Il Na1, Jong Hwa Park2*
1Department of Agriculture and Rural Engineering, Chungbuk National University, Cheongju 361-763, Korea
2Department of Agriculture and Rural Engineering, Chungbuk National University, Cheongju 361-763, Korea
LANDSAT과 KOMPSAT-2 데이터를 이용한 청주지역 도시열섬효과의 평가
나상일1ㆍ박종화2*
1충북대학교 지역건설공학과, 2충북대학교 지역건설공학과
Received on 3 February 2012, revised on 15 February 2012, accepted on 23 March 2012
Abstract : Land surface temperature (LST) is an important factor in human health, thermal environment, heat balance, global change studies, and as control for climate change. The objective of this study was to assess the influence of Urban Heat Island (UHI) Effects on the LST and NDVI in Cheongju, Korea. The aim was to evaluate the effect of urban thermal environment for LST comparison of satellite-derived and in situ measured temperature. In this study, LANDSAT TM and KOMPSAT scene were used. The results indicated that the minimum LST is observed over dense forest as about 21~25℃ and maximum LST is observed over industrial area of about 28~32℃. The estimated LST showed that industrial area, bare soils and built-up areas exhibit higher surface temperatures, while forest, water bodies, agricultural croplands, and dense vegetations have lower surface temperatures during the summer daytime. Result corroborates the fact that LST over land use/land cover (LULC) types are greatly influenced by the amount of vegetation and water bodies present.
The LST of industrial area and urban center is higher than that of suburban area, so it is clearly proved that there are obvious UHIE in Cheongju.
Key words : Urban heat island (UHI), KOMPSAT, LANDSAT, NDVI, Land surface temperatures (LST)
*Corresponding author: Tel: +82-43-261-2577 E-mail address: [email protected]
I. Introduction
Many aspects of the outdoor environment, including air & water quality, can adversely affect living things and human health in general. But outdoor air & water quality may be the most influential factor, among others, in affecting thermal environment. The Urban Heat Island (UHI) is a phenomenon whereby temperatures in urban areas are warmer than the surrounding rural countryside, often by several degrees. Heat-waves that are caused by the UHI effect influence human health, the quality of life of urban residents, energy
consumption, and other adverse climate effects, such as air pollution. As a result, impervious surfaces collect solar heat in their dense mass (Bauer et al., 2004). When the heat is released, it raises air tem- peratures, producing UHI, and increasing energy consumption in black & white infrastructures. Seoul temperatures have risen the past 50 years 1.6℃. The main reason has been pointed out the impact of urbanization (Kim & Baik, 2005). The IPCC's fourth assessment of global temperature during the 21st century that is certain to rise further (1.1~6.4℃) (IPCC, 2007). A number of studies have examined that remotely sensed data can be used in analysis of urban heat islands (Oke, 1973; Owen et al., 1998;
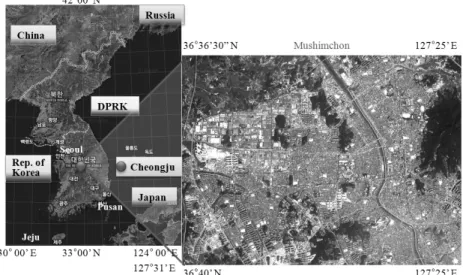
Fig. 1. Locations of study area.
Dousset & Gourmelon, 2003; Voogt & Oke, 2003).
One approach to investigating these relationships is to collect land use/land cover (LULC) data coin- cidentally with land surface temperature (LST) so that the LULC data can directly support analysis of LST outcomes (Weng et al., 2004: Na & Park, 2010a).
As studies of this type are costly, they are typically conducted over relatively confined areas with small sample sizes. An alternate approach is to use remote sensing. Unfortunately, most remote sensing data especially KOMPSAT (Korea multi-Purpose SATellite) imagery for general environment surveys do not have detailed environmental and/or air & water quality information.
The objectives of this paper are to (1) review the KOMPSAT and LANDSAT imagery assessment of the UHI effect and (2) provide potential prospects for future use of KOMPSAT imagery data to evaluate and monitor the UHI effect.
II. Study area and methodology
1. Study area
The study area is located between 36°36’30”N to 36°40’N latitudes and 127°25’E to 127°31’E longitudes (Fig. 1). The city of Cheongju is situated 132 km from
Seoul, the capital of Seoul, Rep. of Korea. There are mountains to the east and the north of the city.
Cheongju has an area of approximately 120 km2. Popu- lation of Cheongju was 6.5 million people (Korea NSO of Census, 2010). Cheongju has undergone a period of significant growth in the last three decade, in- cluding a 62% increase in inhabitants from the 1980 population of 4.0 million (Korea NSO of Census, 1980). Cheongju is a typical plain-city that main part has been formed and developed in lowland. Cheongju has distinct seasons, with a hot and humid summer as well as a cold and dry winter. The relative humidity (1970-2010) is about 69.2% of the annual average value. and about 74.6% in summer, during which approximately 56% of the annual average precipitation occurs. In the winter and spring, the humidity are 68.4% and 61.3%, respectively. Approximately 3 percent of the relative humidity was reduced in 10 years. For a better planning of future urban development and infrastructure planning, municipal authorities need to know urban heat phenomenon of Cheongju, its distribution and where the heat island effect is observed.
2. Methodology
The satellite imagery data from both KOMPSAT-2
and LANDSAT 5 systems were utilized to assess urban area thermal characteristics. Thematic Mapper (TM) data, sensor on board the LANDSAT 5 satellite, is one of the most used for environmental studies. KOMPSAT -2 image is acquired on August 31, 2008 which is used to obtain a detailed LULC classification achieved by high spatial resolution. TM image is acquired on August 5th, 2006 and used to investigate urban surface thermal distribution and patterns. The satellite track in path and row is 115/35. KOMPSAT-2 has spatial resolutions of 80cm panchromatic and 2.8 m multi- spectral images.
Understanding the thermal characteristics requires LU change analyses and LC pattern identification.
ERDAS (Leica) IMAGINE 9.2 image processing software and ArcGIS software (ESRI) have been used to gen- erate various thematic layers and other available maps. The standard image processing techniques, such as image extraction, rectification, restoration, and classification have been used for the analysis of two satellite images (2006 and 2008). ERDAS imagine software has been used for image analysis. First of all, atmospheric correction has been applied using improved dark object subtraction method to bring all the images at common reference spectral charac- teristics. Classification accuracy of all the outputs has been assessed using a reference dataset of more than 200 randomly selected pixels. Seven separable land use classes have been identified, industrial, residential, arable, forest, barren, water and shadow area. Initially, supervised classification using MLC algorithm and digital cadastral map have been per- formed for the classification of images. To enhance the classification accuracy, knowledge-based expert system was used for post-classification refinement of initially classified outputs. The algorithm was trained by super- vised training process, after collection of parametric and non-parametric signatures (training samples).
Using supervised classification, 3 methods tested for the study area, include maximum likelihood method,
minimum distance-to-mean and parallelepiped methods.
Signatures are refined, deleted, renamed and merged after evaluation to ensure the uni-modality of their histograms, statistical parameters, contingency matrix and TD values. After evaluating the seperability, spectral band combination with good seperability (with highest TD value) have been selected for the final classification. The classified map generated based on the highest overall accuracy and Kappa coefficient among all the methods of classifications. Accuracy report and Kappa Coefficient have been generated using the ERDAS Imagine's accuracy assessment utility (Na etal. 2010b).
3. Calculation of LST and NDVI
The LANDSAT TM thermal infrared band (10.4–.12.5 μm) data were utilized to derive the LST. The following equation was used to convert the digital numbers (DN) to space reaching radiance measured by the instrument (Chander & Markham, 2003):
max min
m axm in
minm in (1)
where Lλ is space reaching or Top of Atmospheric (TOA) radiance at the sensor's aperture in W/(m2·sr·μ m), QCalmax(=255) and QCalmin(=0) are the highest and the lowest points respectively of the range of rescaled radiance in DN, Lmin and Lmax are the space reaching radiances that are scaled to QCalmax and QCalmin in W/(m2·sr·μm), respectively.
The spectral radiance Lλ is computed, the brightness temperature at the satellite level can be calculated by using the following approximation formula:
ln
(2)
where Tb is the effective at-satellite brightness tem-
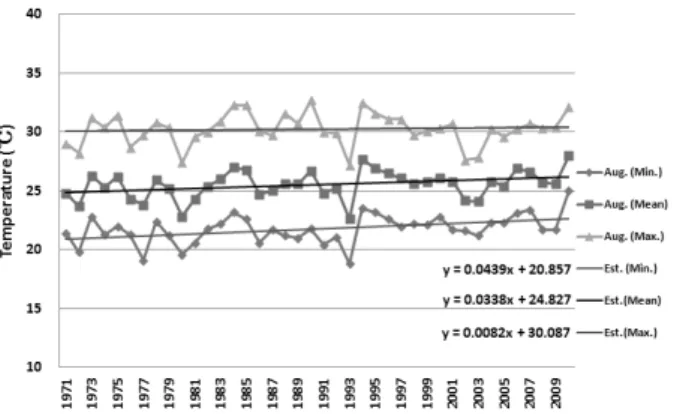
Fig. 2. Temporal variations of minimum, mean, and maximum temperature (august) from 1970 to 2010.
Fig. 3. Seasonal variations of minimum, mean, and maximum temperature from 1970 to 2010.
perature of TM 6 in K, K1 and K2 are pre-launch calibration constants. For LANDSAT 5, which we will use in the study, K1 is 607.76W/(m2·sr·μm) and K2 is 1260.56 K, respectively (Schneider and Mauser 1996).
The LST was computed following equation;
ln ×
(3)
where LST is the land surface temperature in Celsius (℃), ε is emissivity, λ is wavelength of emitted radiance in µm, ρ is 1.438×10⁻² mK.
The LANDSAT image was resampled using the nearest neighbor algorithm and ordinary kriging (OK) interpolation method with a pixel size of 30 by 30 m for all bands including the thermal band (Park & Na 2010).
Normalized difference vegetation index (NDVI) for KOMPSAT was calculated as the ratio between measured reflectance in the red and near infrared (NIR) band based on following formula:
(4)
where is the Normalized difference vegetation index for KOMPSAT, MS3 is the surface red re- flectance for KOMPSAT band 3, MS4 is the surface near infrared reflectance for KOMPSAT band 4.
The field measurements that we conducted in Cheongju on August 5th,2006 were mainly for the validation of the satellite LST. We use a TJ-200 which measure’s 64 points (8×8) and measure the temperature range 0℃ to 55℃ and measure the wave- length 8um to 16um spectral region in the fields.
III. Results and analysis
1. Analysis of air temperature variation Fig. 2 and 3 illustrate the temporal and seasonal
variations of minimum, mean, and maximum tempera- ture from 1970 to 2010 for Cheongju city. There are slight variations in temperature until a steady rise commencing in 1971. Cheongju weather station indicate that mean surface air temperature warmed by about 0.4-0.6℃/decade during 1970 to 2010's all season.
The average august's temperature in Chengju has risen by 1.1 degrees since 1971, while the globally averaged temperature risen 0.6℃. The warming trend is spatially widespread and is consistent with the reduction in vegetation, the accelerated rate of raise of population. Temperature variations are noticeable in the winter. Also, the seasonal minimum temperature shows a big change. Climate change may directly affect human health through increases in average temperature. Such increases may lead to more extreme heat waves during the summer while producing less extreme cold spells during the winter. Rising average temperatures are predicted to increase the incidence of heat waves and hot extremes. This was interpreted
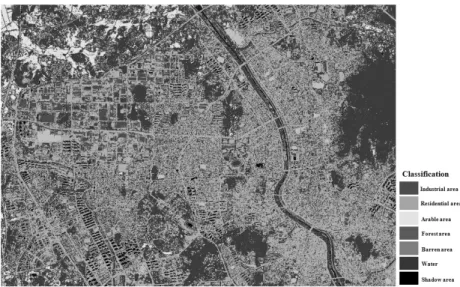
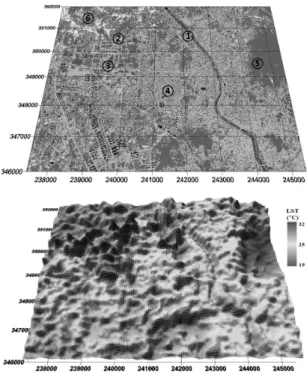
Fig. 4. Classification map of KOMPSAT data merged with digital cadastral map.
Fig. 5. Spatial and geographical distribution of NDVI.
as evidence of global warming, but it was actually evidence of the UHI effects.
2. Land cover classification of KOMPSAT imagery
By using ERDAS IMAGINE software, LULC distribution and pattern were mapped by supervised classification with the maximum likelihood algorithm (Na et al.
2010b). Seven land cover classes were classified in the KOMPSAT images MS 3 and 4. The classes include:
industrial, residential, arable, forest, barren, water and shadow area. Fig. 4 shows the classification image of KOMPSAT data merge with digital cadastral map.
Analysis results suggest that spatial variation of
NDVI is not only subject to the influence of vegetation amount, but also to aspect, slope, topography (DEM), and other factors. These NDVI values strongly cor- related with land coverage materials where concrete and pavements percent is usually associated with lower NDVI. Higher NDVI values typically indicate a larger fraction of vegetation in a pixel. The amount of vegetation determines LST by the latent heat flux from the surface to atmosphere via evapotranspiration.
The difference in the NDVI between urban and rural regions appears to be an indicator of the difference in surface properties (evaporation and heat storage capacity) between the two environments that are responsible for differences in urban and rural minimum temperatures. Spatially, the maximum response of
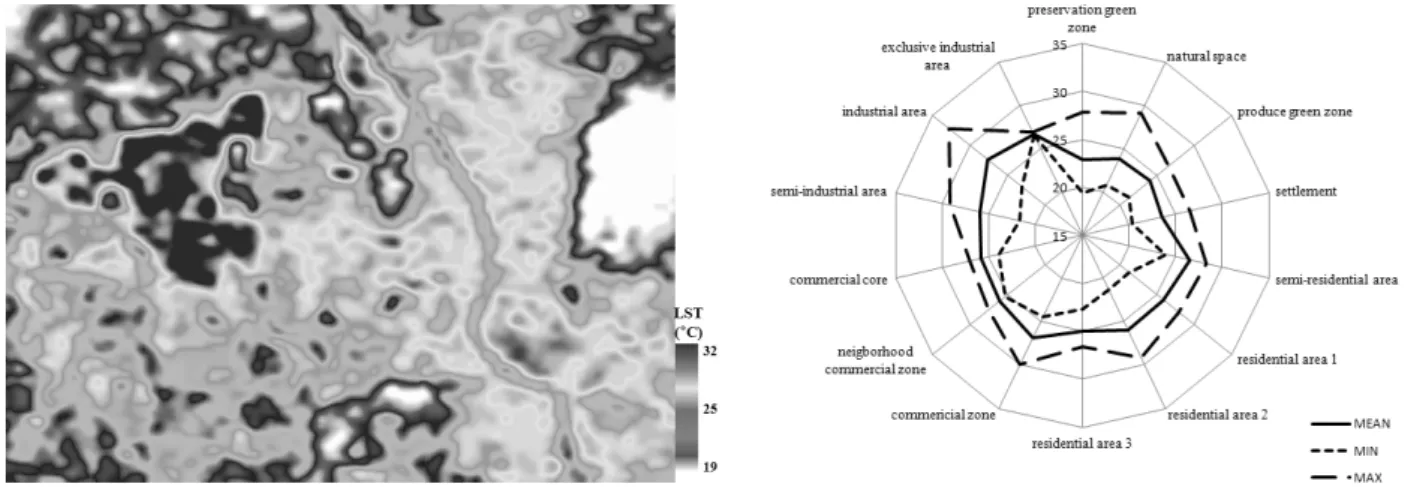
Fig. 6. Land surface temperatures (LST) map and distribution chart.
vegetation NDVI in the northern-east and west area were more pronounced than that in the central and southern areas of Chengju city. Mushim stream is located in the city and runs through the residential areas flows. Therefore, the NDVI is very low near the Mushim stream. The NDVI was vary from 0.05 to 0.2 with water bodies. The industrial area, bare soils and built-up areas with pavement and concrete clearly show that the NDVI vary from 0.1 to 0.2.
3. Analysis of Land Surface Temperature
After the retrieval of LST using ERDAS IMAGINE software, the map generated using distribution color range and OK interpolation method (Park & Na, 2010).
Urban temperature measurements are determined from LST maps of the Cheongju region derived from radiation data obtained by the LANDSAT TM. The capability of LANDSAT derived LST to represent the complexities of urban thermal properties.
Fig. 6 illustrates the distribution of LST values in Chengju. The LST ranged from 19.49 to 32.88℃ with a mean temperature of 25.32℃. From Fig. 6 among the different LULC changes, urban industrial area with high density exhibited with the highest average LST from 28 to 32℃, followed by barren area (24~
27°C) and urban residential area (25~26℃). The lowest LST observed in forest area such as, natural place
from 21 to 25℃, second is arable area (22~24℃), and third is stream water bodies (22~26℃). This implies that urban development and industrialization raise LST by an average of 6℃ by replacing natural environment (forest, barren, and water). It suggests that the LST is controlled by land cover materials and land use.
4. Relationship between NDVI and LST
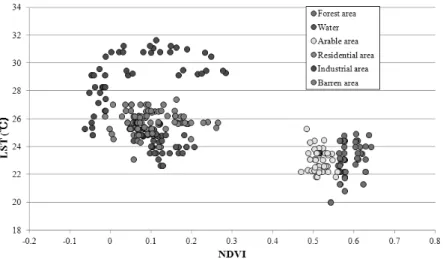
Fig. 7 and 8 shows that LST and NDVI values associated with different types of zoning and found that both variables were responsive to differences in zoning. The residential area is warmer than the eastern forest and stream but colder than the western industrial area. The city center has surface temperatures that are areas from 2 to 4℃ warmer than the surrounding rural areas. NDVI shows urban areas from 0.2 to 0.5 lower than their surrounding rural areas. The complex phenomenon that drives up temperatures is called the UHI effect. Higher LSTs usually are found in areas with low NDVI (e.g. industrial and residential area).
This negative correlation between NDVI and LST is valuable for urban thermal environment studies.
Analysis results suggest that LST characteristics can be identified through qualitatively based urban LULC, NDVI, and dark and white city infrastructure. Different LULC and NDVI characteristics can significantly alter
Fig. 7. Relationship between NDVI and LST for a classification.
Fig. 8. Relationship between NDVI and LST for six classes.
thermal conditions in urban areas. These figures suggest that it is possible to obtain reasonable agreement between urban LULC types (NDVI) and associated thermal characteristics (LST).
5. Characteristics of Land Surface Temperature
Merging the LST images and the land cover classi- fication images, the relationship between the land cover classification and the surface temperature can be clearly understood. Figure 9 shows the comparison of LST values, NDVI, DEM, aspects, and slope. The numbers in the Fig. 9 and 10 are the comparing points
of the imagery data.
Digital height temperature image of Cheongju showing temperature distribution, with blue and green showing cool temperatures, yellow warm, and hot areas appear brown. The heat pockets(③) are indicated by the red color in the land cover classification and are predom- inantly in the industrial built up spaces indicated by the dark brown spots in the LST. The blue reservoir (⑤) in the eastern center of LST are mainly concentrated forest. Summer LST of Cheongju in the stream(①) were an average of 1 to 3℃ cooler than surrounding residential and industrial areas. The increase of green and blue color shows water bodies and forest, re- spectively in the land cover classification image
Fig. 9. Results obtained through satellite image, the comparison of LST values, NDVI, DEM, aspects, and slope.
Fig. 10. Relationship between land cover classification and LST.
Fig. 11. Composite of KOMPSAT natural imagery and LANDSAT LST map.
shows deep valley and reservoir shapes in the LST map. Green and blue surfaces in the rural areas tend to warm slower than those of the urban center areas.
By virtue of their low heat capacities, forest, park, and water bodies act as a giant reservoir and valley of cool energy. These area are the so called ‘cool island’ or ‘cool spots’ compare to surrounding area.
Fig. 11 illustrated the map which was a composite of KOMPSAT natural imagery and LANDSAT LST map.
Results show the urban area of residential and industrial
area has UHI effect, whereas the forest and water bodies has cooling effect. Color and structure of surface materials determine their ability to absorb and release heat. Concrete, asphalt, and bricks absorb heat very quickly during the day while water and trees absorb more slowly. These thermal effects strongly correlated with dark & white infrastructure densities where higher dark & white infrastructure percent coverage is usually associated with higher surface temperature.
Map of differential heat island clusters means several
‘heat island’ and ‘cool spots’ combination may exist due to exposure of LU and LC pattern of exposed area.
Therefore, LULC size, thermal cover, and cluster pattern distribution are important observables in the differential heat island clusters.
IV. Conclusions
We reviewed the use of thermal remote sensing in Cheongju city around areas and the thermal environments, focusing primarily on the UHI effect. The KOMPSAT satellite derived NDVI sampled over urban and rural regions provides information related to the difference in observed urban and rural surface temperatures.
The analysis of LST shows that UHI exists in the Cheongju. Data from the KOMPSAT satellite appear useful for identifying urban and rural regions and may have potential for direct evaluation of urban and rural temperature differences. The typical temperature difference is several degrees between the center of the city and surrounding fields. The variations of LST that determine surface thermal spatial patterns and intensities are affected by the spatial distribution and regional extent of urban LULC type and dark & white infrastructure density. The use of both NDVI and KOMPSAT LST data may provide a useful quantitative measure of UHI that would be globally applicable.
Achieving low-carbon society, a relationship between forest or water bodies in the city and UHI may be of improve the quality of urban environment and interest to peoples, who could monitor water bodies and forest density in an attempt to control or mitigate the effects of the UHI.
Acknowledgement
This work was supported by the research grant of the Chungbuk National University in 2010.
REFERENCES
Bauer ME, Heinert NJ, Doyle JK, Yuan F. 2004. Impervious surface mapping and change monitoring using satellite remote sensing. Proc. Ame. Soc. of Pho. and Rem. Sen.
Annual Conference, CD ROM, 10 pp.
Chander G, Markham B. 2003. Revised Landsat-5 TM radiometric calibration procedures and postcalibration dynamic ranges.
IEEE Transactions on Geoscience and Remote Sensing 41(11): 2674-2677.
Dousset B, Gourmelon F. 2003. Satellite multi-sensor data analysis of urban surface temperatures and land cover.
ISPRS J. Photogramm. Remote Sens. 58: 43-54.
IPCC (Intergovernmental Panel on Climate Change). 2007. Climate Change 2007: The Physical Science Basis. edited by S.
Solomon et al., 989 pp., Cambridge Univ. Press.
Kim YH, Baik JJ. 2005. Spatial and temporal structure of the urban heat island in Seoul. J. Appl. Meteor. 44: 591-605.
NSO (Korea National Statistical Office). 2010. Statistical Yearbook.
Na SI, Park JH. 2010a. Quantification of the relationship between Normalized Difference Vegetation Index (NDVI) and Land Surface Temperature (LST) in arable land.
Proceedings of SPIE. 7824: 78242H.
Na SI, Park JH, Park JK. 2010b. Estimation of cabon absorption distribution by land use changes using RS/GIS method in green land. J. of the Korean Society of Agr. Eng. 52(3):
39-46. [in Korean]
Oke T. 1973. City size and the urban heat island. Atmos.
Environ. 7: 769-779.
Owen T, Carlson TN, Gillies RR. 1998. An assessment of satellite remotely sensed land cover parameters in quanti- tatively describing the climatic effect of urbanization. Int.
J. Remote Sens. 19(9): 1663-1681.
Park JH, Na SI. 2010. SST and SS changes during Saemangeum seawall construction using Landsat TM and ETM imagery.
Proc. SPIE. 7831: 78311F.
Schneider K, Mauser W. 1996. Processing and accuracy of landsat thematic mapper data for lake surface temperature measurement. Int. J. of Rem. Sen. 17: 2027-2041.
Voogt J, Oke T. 2003. Thermal remote sensing of urban climates. Remote Sensing of Environment 86(3): 370-384.
Weng Q, Lu D, Schubring J. 2004. Estimation of land surface temperature - vegetation abundance relationship for urban heat island studies. Rem. Sen. of Env. 89(4): 467-483.