1. Introduction
Previous studies have shown that the pattern of fundamental frequency (henceforth, F0) varies depending on a variety of factors, such as biological properties, sociolinguistic dimensions (Grawnder
& Winter, 2010; Loveday, 1981; Shin, 2005; Winter & Grawnder, 2012 inter alia), and the language in which a person is speaking.
Particularly with regard to the last factor, previous studies demonstrated contrasting results. In some research, it was found that F0 is determined by distinct features of each language (Andreeva et al., 2014; Graham, 2013; Lee, 2016; Shin & Lee, 2016), whereas other studies showed that the value of F0 varies depending on whether the person is speaking in his or her first language (henceforth, L1) or in his or her second language (henceforth, L2)
(Busà & Urbani, 2011; Ullakonoja, 2007; Zimmerer et al., 2014).
This study especially focused on the last factor, namely, the language in which a person is producing an utterance.
2. Literature Review
Most of the previous studies which deal with the effect of language on F0 analyzed mean F0 and F0 range. Some studies have shown that the use of F0 are related with the effect of L2, suggesting that mean F0 is higher for L2 production than for L1 production and that the F0 range produced by L2 speakers is narrower than the F0 range produced by native speakers. For example, according to Busà &
Urbani (2011), mean F0 of English produced by Italian speakers was higher than that of English spoken by native speakers of
* Yonsei University, [email protected], corresponding author
Received 24 October 2016 ; Revised 13 December 2016; Accepted 24 December 2016 ISSN 2005-8063
2016. 12. 31.
Vol.8 No.4 pp. 15-22
말소리와 음성과학
http://dx.doi.org/10.13064/KSSS.2016.8.4.015
Effect of language on fundamental frequency:
Comparison between Korean and English produced by L2 speakers and bilingual speakers
Soo Bin Lim
*· Goun Lee · Seok-Chae Rhee
Abstract
This study aims to examine whether the fundamental frequency (F0) varies depending on languages or distinguishes between L1 (first language) and L2 (second language) speech and whether the type of materials which vary in control of consonant voicing affects the use of F0—especially, mean F0. For this purpose, we compared productions of two languages produced by Korean L2 learners of English to those of Korean-English bilingual speakers. Twelve Korean L2 speakers of English and twelve Korean-English bilingual speakers participated in this study. The subjects read aloud 22 declarative sentences—balanced and unbalanced—once in English and once in Korean. Mean F0 of Korean was higher than that of English for both speaker groups, and the difference in the value of mean F0 between the Korean and English sentences was different depending on the type of materials that the participants read. With regard to F0 range, the L2 speakers had a larger F0 range in English than in Korean; however, the effect of language on F0 range was not statistically significant for the bilingual speakers. These results indicate that language-specific properties may affect the use of F0, in particular, mean F0.
Keywords: mean F0, F0 range, L2 speakers, bilingual speakers, L2 effect, language-specific features, consonant voicing
English for all sentence types: yes-no question, wh-question, statements and answers. In other words, the sentences were uttered with a higher mean F0 when the participants were speaking in their L2. They further showed that Italian speakers had a smaller F0 range than native English speakers when they spoke in English. Zimmerer et al. (2014) also found that both French and German native speakers produced a narrower F0 range for their respective L2 utterances than for the utterances produced with their respective L1.
They explained that speakers produced less native-like F0 range when speaking in their L2 because they were less confident and focused more on segmental features of words rather than suprasegmental features when they spoke in their L2. Ullakonoja (2007) also found that Finnish learners of Russian read Russian dialogues with a narrower F0 range than Russian native speakers did; she further proposed that L2 experience improved the use of F0 range, so the pattern of F0 range became more native-like as the person had more experience in the language.
In contrast to the aforementioned studies which found the effect of L2 on F0 profile, Andreeva and her colleagues (2014) suggested that F0 range is characterized by languages. To be specific, in this study, they compared two Slavic languages (i.e. Bulgarian and Polish) with two Germanic languages (i.e. German and British English); speakers of these four languages read short passages in their respective native languages. As a result of examining F0 of each participant, Andreeva et al. (2014) found that speakers of Germanic languages produced less variable F0 than speakers of Slavic languages did. They concluded that their result supports the effect of language-specific features on the use of F0. Graham’s study (2013) also supported the effect of language difference on the use of F0 by comparing mean F0 and F0 range of Japanese sentences and English sentences which were produced by Japanese-American simultaneous bilingual speakers. This study found that the speakers uttered Japanese sentences with a significantly higher mean F0 and that they had a wider F0 range when they spoke in Japanese than when they spoke in English.
Graham (2013) suggested that such results may have been brought about by the differences inherent in the two languages’ prosodic system rather than by other factors such as sociophonetic aspects.
Lee (2016) and Shin & Lee (2016) further examined the effect of proficiency on the use of F0 in order to investigate whether such vocal characteristics as mean F0 and F0 range are language-specific features or reflect L2-accented speech. To be specific, Lee (2016) included participants’ oral proficiency rated by native English speakers; these native speakers listened to the English passage produced by the participants and rated the participants’ accuracy of pronunciation and their intonation and stress. These scores were used as a factor to examine correlation between proficiency and the use of F0. Shin & Lee (2016) measured participants’ English proficiency with a Michigan test (Upshur et al., 1972) and included these scores as a factor in their analysis. However, these studies found neither a correlation between proficiency and F0 profile nor an effect of proficiency on the use of F0, suggesting that the difference found on F0 use is due to the typological difference between Korean and English.
Interestingly, however, although both Lee (2016) and Shin & Lee (2016) compared Korean native speakers’ production of Korean sentences (their L1) to that of English sentences (their L2), the opposite patterns were observed between these two studies in terms of mean F0 and F0 range. While Lee (2016) found higher mean F0
values in English (212.5 Hz for female; 115.86 Hz for male) than in Korean (210.12 Hz for female; 107.43 Hz for male), Shin & Lee (2016) found higher mean F0 in Korean (235 Hz for female; 134 Hz for male) than in English (222 Hz for female; 124 Hz for male).
Regarding F0 range, while Lee (2016) showed a broader F0 range in English than in Korean, Shin & Lee (2016) found no difference in F0 range between Korean and English sentences.
These differences may have arisen from the type of materials that the authors utilized for their experiment. In case of Lee (2016), he created the stimuli such that the features of consonant voicing and length of utterances are controlled between Korean and English sentences. In contrast, in the study of Shin & Lee (2016), such a manipulation was not conducted for the stimuli. Considering that segmental features such as voicing of consonants affect F0 (Gussenhoven, 2004), the control of materials in terms of these segmental compositions may indeed make a difference in the use of F0, because different languages have different consonant inventories. For example, while voiced and voiceless consonants are evenly present and phonemically distinctive in English, a majority of voiced consonants only appear allophonically in Korean (Kang, 2003; Major & Faudree, 1996). When such difference between the two languages is considered, the stimuli which are controlled in terms of consonant voicing may not reflect the natural difference between the two languages. Thus, we utilized both controlled version and uncontrolled version of materials in the present study to see whether the difference in the materials caused the differences in the use of F0 between the two languages (see 3.2 for more information about materials).
Another contribution of the current study is that we compared production of L2 speakers to that of late bilingual speakers (hereafter, bilingual speakers). Most of the previous studies (except for Lee, 2016; Shin & Lee, 2016) only investigated one L2 group as compared to the native group, which made it hard to tease apart the effect of language proficiency on the use of F0 characteristics. For instance, in Busà & Urbani (2011), while they compared English spoken by Italian speakers and English spoken by native English speakers, they did not include comparison between Italian spoken by English speakers and Italian utterances produced by native Italian speakers. Admittedly, Lee (2016) and Shin & Lee (2016) solved this problem by taking L2 proficiency of the participants into consideration. However, bilingual speakers are assumed to have similar level of fluency in both languages, while L2 speakers are native speakers of only one language. In other words, there is a clear difference in the level of language dominance between the two speaker groups. As a result, we can directly examine whether the use of F0 is affected by L2 by comparing productions of bilingual speakers and those of L2 speakers. For this purpose, we compared Korean and English utterances produced by L2 speakers and the same utterances produced by bilingual speakers in order to examine the effect of the L2 on the use of F0, namely, mean F0 and F0 range.
The research questions for this study are as follow:
(1) Will cross-linguistic difference between Korean and English influence the use of F0?
(2) Will the different consonant inventories between Korean and English affect the use of F0?
(3) Will bilingual speakers also show similar difference as L2
speakers?
If the use of F0 is determined by the features which are inherent in each language, we predict that speakers of both groups will produce the Korean sentences with higher mean F0 values than the English sentences as Shin & Lee found (2016), because Korean has more voiceless consonants than English does. With respect to F0 range, we predict that the range will be wider for the English sentences than for the Korean sentences regardless of the speaker groups, due to the prosodic property of English, i.e. stress-timed language. However, bilingual speakers’ F0 range for the English sentences will be wider than L2 speakers’ range for the same sentences, since bilinguals will be more fluent in English than L2 speakers.
By contrast, if the pattern of F0 is characterized as a function of L2, based on the previous studies (Busà & Urbani, 2011;
Ullakonoja, 2007; Zimmerer et al., 2014), we predict that Korean L2 learners will produce the English sentences with higher mean F0 and narrower F0 range than bilingual speakers due to lack of confidence. We also predict that no group difference will be found for the Korean sentences.
3. Method
3.1. Participants
Two groups of speakers participated in this study: the first group was comprised of twelve Korean L2 learners of English (six females; mean age = 26, SD = 3), and members of the other group were twelve Korean-English bilingual speakers (six females; mean age = 26, SD = 4). Those in the first group were native speakers of Korean. In particular, as people who speak different dialects can have different F0 patterns, participants of the first group were limited to native speakers of Seoul dialect.
We also asked the participants to fill out a background questionnaire in order to confirm whether the subjects who were recruited as bilingual speakers can be categorized as such.
Independent samples t-tests on Age of Acquisition (AOA) and Length of Residence (LOR) found a significant difference between the two groups (AOA: t (22) = 3.465, p < .01; LOR: t (22) = -6.763, p < .001). See <Table 1> for the details of the two groups.
In addition to the background questionnaire, a cloze test (Brown, 1984) was conducted to further ensure that the two speaker groups have different levels of proficiency in English. For this test, the participants were provided with a passage where some of the words are missing, and they were required to fill in the missing words based on the contextual information. The mean score and standard deviation of this test are represented in <Table 1> below. The number in parenthesis indicates standard deviation of each value.
Independent samples t-test on the cloze test scores also showed a significant difference between the two groups (t (22) = -2.866, p <
.01).
Korean L2
speakers of English Bilingual speakers
AOA 11 (4) 5 (4)
LOR 0 (1) 9 (4)
Cloze test score 31/50 (10) 41/50 (5) Table 1. Results from language background questionnaire and cloze test
3.2. Materials
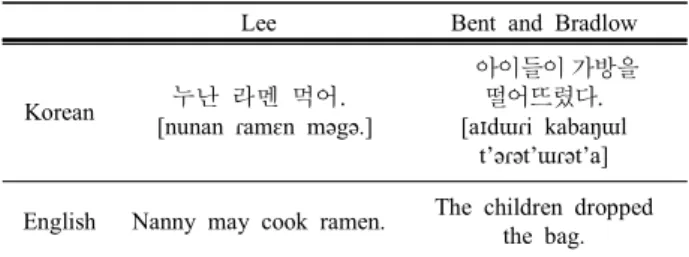
The stimuli used in the current study were comprised of two sets of 22 sentences. For half of the participants of each group, the first set was composed of Korean sentences, and the second set consisted of English sentences. For the other half of the participants of each group, English sentences appeared in the first set, and Korean sentences in the second set. In each set, the first ten sentences were adopted from Lee (2016). The remaining twelve sentences were from Bent & Bradlow (2003).
Lee’s sentences were created with consideration for various segmental features, as segmental composition can have an influence on the value of F0 (Lee, 2016: 9). In other words, Lee constructed his experiment material in a way that the Korean sentences were similar with the English sentences in terms of such dimension as consonant voicing; as he was more concerned with control of segmental features than with the meaning of the sentences, some of his sentences have different meaning between Korean and English.
For this reason, sentences from Lee (2016) are referred to as balanced material hereafter.
In case of sentences from Bent & Bradlow (2003), since these sentences were given only in English, we translated the given sentences into Korean. However, we did not take the factors that Lee controlled for his material into account in translation. For this reason, sentences from Bent & Bradlow (2003) are referred to as unbalanced material henceforth. In summary, we used both balanced material and unbalanced material in order to examine the effect of consonant voicing on mean F0. Some of the example sentences drawn from Lee (2016) and Bent & Bradlow (2003) are shown in
<Table 2> below. See Appendix 1 and Appendix 2 for the entire material that the participants read during the experiment.
Lee Bent and Bradlow
Korean 누난 라멘 먹어.
[nunan ɾamɛn məgə.]
아이들이 가방을 떨어뜨렸다.
[aɪdɯɾi kabaŋɯl t’əɾət’ɯɾət’a]
English Nanny may cook ramen. The children dropped the bag.
Table 2. Examples from Lee (2016) and Bent & Bradlow (2003)
3.3. Procedure
Prior to reading the sentences of each set, the participants were asked to perform spontaneous speaking in each language. To be specific, before reading Korean sentences, we asked the subjects to describe what they did the day before recording in Korean. In case they read English sentences, they were required to describe the city where they grew up in English. These questions were included in order to ensure that the participants are prepared to speak in each language. Another purpose of including these questions was to help the participants to adapt themselves to the recording environment.
The subjects read aloud the two sets of aforementioned sentences
with two repetitions. Thus, a total of 88 sentences were produced for
each subject (44 sentences for each language). In order to block any
confounding effect of language, we counterbalanced the order of
language that the participants read: half of the participants of each
speaker group read the English sentences first, and the other half
read the Korean sentences first. In addition, when participants read in Korean, the researcher who was in charge of recording gave instructions in Korean; when the participants read the English sentences, another researcher conducted recording and spoke in English. When participants misread any part of a sentence, they were asked to read the sentence again.
The recording was conducted with a ZOOM H6 recorder and a SHURE SM48 microphone in English Language Informatics Laboratory (ELI Lab) at Yonsei University. Each session lasted about 30 minutes. None of the participants reported that they had a hearing or speaking disorder.
3.4. Measurement
After the recording session was finished, we manually annotated the utterances by using Praat (Boersma & Weenink, 2016) and measured mean F0 and F0 range. To be specific, after recording all of the sentences, we labelled each utterance according to the numbers of the sentences. Later, Xu script (2013) was run: the script automatically divided each labelled utterance into ten points and calculated each point’s F0 value. For mean F0, the mean F0 values of each sentence were measured. For F0 range, first, we gained F0 values of 10 time windows for each sentence, and then subtracted the minimum F0 value from the maximum F0 value of these ten F0 values.
4. Results
Linear mixed-effect model was conducted in order to examine the effect of language (Korean and English), speaker group (L2 speakers and Bilingual speakers), gender (Male and Female), and the type of material (Balanced and Unbalanced) on the acoustic measurements of mean F0 and F0 range. English, Bilingual speakers, Female, and Balanced were used as baseline category.
4.1. Mean F0
For mean F0, there were main effects of language (p < .001) and gender (p < .001). The main effect of language indicates that the Korean sentences were produced with higher mean F0 values (162.8 Hz) than the English sentences (158.5 Hz). The main effect of gender suggests that the female participants produced the sentences with higher mean F0 values (207.5 Hz) than the male participants did (113.8 Hz). We also found a significant interaction between the type of material and the speaker group (p < .05).
In order to further understand this interaction, we conducted linear mixed effect model again for each speaker group. For the L2 speakers, we found main effects of language (p < .001) and gender (p < .001). The main effect of language suggests that the L2 speakers produced the Korean sentences with higher mean F0 (167 Hz) than the English sentences (163.5 Hz). The effect of gender indicates that the female L2 speakers’ mean F0 for the sentences (210.5 Hz) was higher than the male L2 speakers’ mean F0 (120 Hz). We also found a significant interaction between the language and the type of material (p < .05). This interaction indicates that the difference between mean F0 for the Korean sentences and mean F0 for the English sentences was greater from the unbalanced material than from the balanced material.
The pattern for the bilingual speakers was similar to the pattern found from the L2 speakers; in other words, for the bilingual
speakers, we also found main effects of language (p < .001) and gender (p < .001), along with an interaction between the language and the type of material used in the study (p < .001). The effect of language suggests that the bilingual speakers also produced the Korean sentences with higher mean F0 (158.5 Hz) than the English sentences (153.5 Hz). The main effect of gender indicates that the female bilingual speakers’ mean F0 (204.5 Hz) for the sentences was higher than the male bilingual speakers’s mean F0 (107.5 Hz).
The interaction means that the difference of mean F0 between the Korean and English sentences was greater from the unbalanced material than from the balanced material.
<Table 3> and <Table 4> below represent summary of the results of linear mixed effect model for the L2 speakers and bilingual speakers, respectively. The tables report only the results that were found to be statistically significant. <Figure 1> and <Figure 2>
represent mean F0 for the L2 speakers and bilingual speakers, respectively, where mean F0 for the balanced material is compared with mean F0 for the unbalanced material.
Variable Estimate SE df t-value p-value (intercept) 208.87 11.2 24.11 < .001 Language_English 8.27 1017.7 4.42 < .001 Gender_Female -88.43 10.4 -7.35 < .001 Language_English:
Material_Balanced -4.30 1017.7 -1.96 < .05 Language_English:
Gender_Female -6.97 1017.8 -2.64 < .01 Table 3. Summary of the results of linear mixed effect model on mean F0 for
the L2 speakers (SE=Standard Error; df=Degree of Freedom)
Variable Estimate SE df t-value p-value (intercept) 200.21 12.9 40.66 < .001 Language_English 10.51 1017.8 6.31 < .001 Gender_Female -95.94 11.3 -14.25 < .001 Language_English:
Material_Balanced -8.63 1018 -4.20 < .001 Table 4. Summary of the results of linear mixed effect model on mean F0 for
the bilingual speakers (SE=Standard Error; df=Degree of Freedom)
Figure 1. Mean F0 for the L2 speakers
Figure 2. Mean F0 for the bilingual speakers
4.2. F0 range
Regarding F0 range, we found a main effect of gender (p < .001) and an interaction between the language and the type of material (p
< .01). This result suggests that the female speakers produced the sentences with greater F0 range (103.8 Hz) than the male speakers did (54 Hz). <Table 5> below demonstrates summary of the results of linear mixed effect model on F0 range; the table reports only the statistically significant results.
Variable Estimate SE df t-value p-value
(intercept) 98.12 36.5 14.01 < .001
Gender_Female -57.54 26.7 -6.39 < .001 Language_English:
Material_Balanced -16.32 2055.7 -2.83 < .01 Table 5. Summary of the results of linear mixed effect model on F0 range
(SE=Standard Error; df=Degree of Freedom)
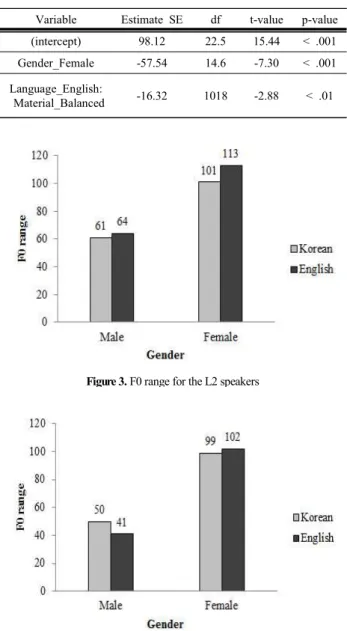
In order to further examine the interaction between the language and the type of material, we stratified the data for each speaker group and conducted two linear mixed effect models. For the L2 speakers, we found main effects of language (p < .05) and gender (p
< .001). This result indicates that the L2 speakers produced the English sentences with greater F0 range (88.5 Hz) than the Korean sentences (81 Hz) and that the female L2 speakers’ F0 range (107 Hz) was greater than the male L2 speakers’ F0 range (62.5 Hz).
In case of the bilingual speakers, we found a main effect of gender (p < .001), indicating that the female bilingual speakers’ F0 range (100.5 Hz) was greater than the male bilingual speakers’ F0 range (45.5 Hz). An interaction between the language and the type of material was also found for the bilingual speakers (p < .01). This finding implies that the difference in F0 range between Korean and English was greater from the unbalanced material than from the balanced material.
<Table 6> and <Table 7> below show summary of the results of linear mixed effect model on F0 range for the L2 speakers and bilingual speakers, respectively. These tables also report only the statistically significant results. <Figure 3> and <Figure 4> present F0 range for the L2 speakers and bilingual speakers, respectively.
Variable Estimate SE df t-value p-value
(intercept) 111.47 16.9 14.58 < .001
Language_English -8.71 1017.9 -2.21 < .05 Gender_Female -48.14 12.7 -4.81 < .001 Table 6. Summary of the results of linear mixed effect model on F0 range for
the L2 speakers (SE=Standard Error; df=Degree of Freedom)
Variable Estimate SE df t-value p-value
(intercept) 98.12 22.5 15.44 < .001
Gender_Female -57.54 14.6 -7.30 < .001 Language_English:
Material_Balanced -16.32 1018 -2.88 < .01 Table 7. Summary of the results of linear mixed effect model on F0 range for
the bilingual speakers (SE=Standard Error; df=Degree of Freedom)
Figure 3. F0 range for the L2 speakers
Figure 4. F0 range for the bilingual speakers
5. Discussion and Conclusion
In this paper, we aimed to examine whether the pattern of acoustic measurements such as mean F0 and F0 range varies depending on inherent features of each language or on the use of L2. The overall results demonstrated that the use of F0—in particular, mean F0—may be characterized by the properties inherent in each language.
To be specific, with respect to mean F0, we found higher mean
F0 values for the Korean sentences than for the English sentences.
Moreover, when the analysis was run for each speaker group, both speaker groups were found to have significantly higher mean F0 values in Korean than in English only from the unbalanced material.
The general pattern of the current study (i.e. higher mean F0 values for the Korean sentences than for the English ones) and the interaction between the language and the type of material can be explained by the fact that Korean has more voiceless consonants than English does. To elaborate, one of the features which distinguish Korean from English is that a majority of consonants in Korean are voiceless (except for nasals, liquids, and lenis in an intervocalic position). Kang (2003) and Major & Faudree (1996) also demonstrated that voiced consonants are only allophonically present in the language system of Korean. In fact, in case of the unbalanced material, 47% of the consonants were voiceless consonants in the Korean sentences, while only 31% of the consonants were voiceless consonants in the English sentences. On the other hand, the number of voiceless consonants was similar between the two languages in the balanced material where the feature of consonant voicing was controlled; in this material, 26% of the consonants in the Korean sentences were voiceless consonants, and 30% of the consonants in the English sentences were voiceless consonants. The feature of consonant voicing is related with the value of F0 in that F0 is known to have a higher value after voiceless consonants than after voiced consonants (Gussenhoven, 2004). When this cross-linguistic F0 pattern is taken into account, lack of control in terms of consonant voicing may have brought about a significantly higher mean F0 in Korean than in English, while such pattern was not observed in the balanced material. Thus, the present study proved that mean F0 may show language-specific features, contributing to the literature that different languages may have different mean F0 values (Andreeva et al., 2014; Graham, 2013; Keating & Kuo, 2012; Lee, 2016; Shin & Lee, 2016).
With regard to F0 range, one of the patterns that we found was that the female speakers produced the sentences with greater F0 range than the male participants, regardless of the language or speaker group. This finding can be explained from two aspects:
physiological differences and the degree of emotional involvement during speaking. To begin with the relationship between physiological differences and the use of F0 range, the larger size of men’s laryngeal cavities than that of women’s leads to the use of narrower F0 range by men than by women (Shin & Lee, 2016;
Stevens, 1998). In addition to the anatomical reason, another factor that leads to the use of greater F0 range by women is that women are more prone to establish interaction during communication, as Haan
& van Heuven (1999) reported. The important finding from Haan &
van Heuven (1999) is that women’s F0 range was wider than men’s range not only for various types of questions but also for declarative statements. Similarly, in the present study, the participants were asked to read the sentences naturally as well as correctly. When such previous study as Haan & van Heuven (1999) is considered, it is probable that the female participants had a greater degree of involvement than the male speakers did, which caused broader F0 range from the female speakers. Therefore, as the female participants consistently used larger F0 range than the male participants regardless of the language in this study, this result corroborates Shin & Lee’s suggestion (2016) to control the gender of the speakers between the language groups in future studies.
In addition, when the linear mixed effect model was run for each
speaker group, different patterns were observed between the L2 speakers and the bilingual speakers for F0 range, showing neither the effect of language-specific features nor the effect of L2 on the use of F0 range. To be more specific, in case of the L2 speakers, they were found to produce greater F0 range when they spoke in English than when they spoke in Korean. By contrast, the bilingual speakers did not show such similar pattern as the L2 learners, as the effect of language on F0 range was not statistically significant for the bilingual speakers. As such, because the two speaker groups displayed the opposite patterns with each other, the results of the present study cannot be explained by the difference in prosodic system of the two languages, Korean and English. At the same time, the fact that the bilingual speakers’ F0 range for the English sentences was narrower than the L2 speakers’ range for the same sentences cannot be explained by the L2 effect on F0 range. As it was shown from the language background questionnaire and cloze test scores, those who were categorized as bilingual speakers in the current study were far more fluent in English than those who participated as L2 speakers. In addition, as the data of AOA showed, the bilingual speakers of the present study can be assumed to use English as their L1. For this reason, the pattern of the bilingual speakers cannot be explained by the L2 effect that F0 range becomes narrower for L2 production due to lack of confidence when speaking in L2.
In summary, for now, the question of whether F0 range is associated with language-specific features remains unanswered. The inconsistency between Lee (2016), Shin & Lee (2016), and the present study may arise from the fact that F0 range serves various functions. In fact, F0 range is expanded or compressed due to various reasons, e.g., to mark focus items (Flemming, 2008), to express emotion (Carlson et al., 1992; Pereira & Watson, 1998), and so on. This suggests that a variety of factors are simultaneously involved to determine the pattern of F0 range.
In order to further understand the relationship between F0 range and the effect of language-specific features, however, it will be necessary to examine languages from different language families in future studies. While some previous studies (e.g. Busà & Urbani, 2011; Zimmerer et al., 2014) compared Indo-European languages (i.e. Italian and English, and French and German, respectively), the current study compared the languages which belong to different language families: Korean and English. People may react in a different way when they read languages of different language families. This discrepancy can justify why the Korean L2 speakers of English produced their L2 with greater F0 range than their L1 in the current study, in contrast to the previous studies which supported the effect of L2 on F0 range. Hence, the present study indicates a possibility that the L2 effect on F0 range may not be a universal tendency. More studies which compare languages from different language families should be conducted in order to confirm validity of this possibility.
In conclusion, the current study was able to add a piece of evidence that mean F0 can demonstrate language differences as we found that Korean was intrinsically produced with higher mean F0 than English. However, in case of F0 range, the effect of language-specific properties was not clear in that different patterns were observed for the L2 speakers and for the bilingual speakers.
Hence, future research needs to be conducted in order to find an
answer to the remaining question.
References
Andreeva, B., Demenko, G., Wolska, M., Möbius, B., Zimmerer, F., Jügler, J., Oleskowicz-Popiel, M., & Trouvain, J. (2014).
Comparison of pitch range and pitch variation in Slavic and Germanic languages. Proceedings of the 7
thInternational Conference on Speech Prosody (pp. 776-780). Dublin, Ireland.
20-23 May, 2014.
Bent, T., & Bradlow, A. R. (2003). The interlanguage speech intelligibility benefit. The Journal of the Acoustical Society of America, 114(3), 1600-1610.
Boersma, P., & Weenink, D. (2016). Praat: doing phonetics by computer. Version 6.0.08, Retrieved from
http://www.praat.org/[Computer program] on December 7, 2015.
Brown, J. D. (1984). A cloze is a cloze is a cloze? In J. Handscombe, R. A. Orem, & B. P. Taylor (Eds.), On TESOL ‘83: The question of control (pp.109-119). Washington, DC: TESOL.
Busà, M. G., & Urbani, M. (2011). A cross linguistic analysis of pitch range in English L1 and L2. Proceedings of the 17
thInternational Congress of Phonetic Sciences (ICPhS XVII), (pp. 380-383). Hong Kong, China. 17-21 August, 2011.
Carlson, R., Granström, B., & Nord, L. (1992). Experiments with emotive speech: Acted utterances and synthesized replicas.
Proceedings of the 2
ndInternational Conference on Spoken Language Processing (ICSLP 92), (pp. 671-674). Alberta, Canada.
12-16 October, 1992.
Flemming, E. (2008). The role of pitch range in focus marking. Slides from a talk given at the Workshop on Information Structure and Prosody.
Graham, C. (2013). Revisiting F0 range production in Japanese-English simultaneous bilinguals. UC Berkeley Phonology Lab Annual Report, 110-125.
Grawnder, S., & Winter, B. (2010). Acoustic correlates of politeness:
Prosodic and voice quality measures in polite and informal speech of Korean and German speakers. Proceedings of the International Conference for Speech Prosody. Chicago, IL. 11-14 May, 2010.
Gussenhoven, C. (2004). The phonology of tone and intonation.
Cambridge: Cambridge University Press.
Haan, J., & van Heuven, V. J. (1999). Male vs. Female pitch range in Dutch questions. Proceedings of the 14
thInternational Congress of Phonetic Sciences. San Francisco, CA. 1-7 August, 1999.
Kang, O. (2003). Korean phonology. Seoul: Taehaksa. (강옥미 (2003). 한국어 음운론 . 서울: 태학사.)
Keating, P., & Kuo, G. (2012). Comparison of speaking fundamental frequency in English and Mandarin. The Journal of the Acoustical Society of America, 132(2), 1050-1060.
Lee, D. (2016). Pitch variation in Korean EFL speakers’ L1-Korean and L2-English speech. M.A. Thesis, Hankuk University of Foreign Studies. (이대용 (2016). 한국인 영어학습자의 한국어
및 영어 발화에 나타난 음높이 변화에 관한 연구 . 한국외국어
대학교 석사학위논문.)
Loveday, L. (1981). Pitch, politeness and sexual role: An exploratory investigation into the pitch correlates of English and Japanese politeness formulae. Language and Speech, 24(1), 71-89.
Major, R. C., & Faudree, M. C. (1996). Markedness universals and the acquisition of voicing contrasts by Korean speakers of English.
Studies in Second Language Acquisition, 18(1), 69-90.
Pereira, C., & Watson, C. (1998). Some acoustic characteristics of emotion. Proceedings of the 5
thInternational Conference on
Spoken Language Processing. Sydney, Australia. 30 November - 4 December, 1998.
Shin, D., & Lee, G. (2016). Do Korean learners of English speak L2 differently from their L1? – F0 characteristics and intensity differences between Korean and English. Studies in Phonetics, Phonology and Morphology, 22(2), 317-334.
Shin, S. (2005). Grammaticalization of politeness: A contrastive study of German, English and Korean. Ph.D. Dissertation, University of California, Berkeley.
Stevens, K. N. (1998). Acoustic phonetics. Cambridge: MIT Press.
Ullakonoja, R. (2007). Comparison of pitch range in Finnish (L1) and Russian (L2). Proceedings of the 16
thInternational Congress of Phonetic Sciences (pp. 1701-1704). Saarbrücken, Germany.
6-10 August, 2007.
Upshur, J., Koba, H., Spaan, M., & Strowe, L. (1972). English Language Institute listening comprehension test. Ann Arbor:
University of Michigan.
Winter, B., & Grawnder, S. (2012). The phonetic profile of Korean formal and informal speech registers. Journal of Phonetics, 40(6), 808-815.
Xu, Y. (2013). ProsodyPro – A tool for large-scale systematic prosody analysis. Proceedings of Tools and Resources for the Analysis of Speech Prosody (TRASP 2013), (pp. 7-10). Aix-en-Provence, France. 30 August, 2013.
Zimmerer, F., Jügler, J., Andreeva, B., Möbius, B., & Trouvain, J.
(2014). Too cautious to vary more? A comparison of pitch variation in native and non-native productions of French and German speakers. Proceedings of the 7
thInternational Conference on Speech Prosody (pp. 1037-1041). Dublin, Ireland. 20-23 May, 2014.
● Soo Bin Lim corresponding author
Department of English Language and Literature Yonsei University
262 Seongsan-ro, Seodaemun-gu Seoul 03706, Korea
Tel: 02-2123-2300
Email: [email protected]
Fields of interest: Sociophonetics, Discourse Analysis
● Goun Lee
Department of English Language and Literature Yonsei University
262 Seongsan-ro, Seodaemun-gu Seoul 03706, Korea
Tel: 02-2123-2304 Email: [email protected]
Fields of interest: Phonetics, Phonology, Psycholinguistics
● Seok-Chae Rhee