• 검색 결과가 없습니다.

Comparison of Multiple Chronic Obstructive Pulmonary Disease (COPD) Indices in Chinese COPD Patients

N/A
N/A
Protected

Academic year: 2021

Share "Comparison of Multiple Chronic Obstructive Pulmonary Disease (COPD) Indices in Chinese COPD Patients"

Copied!
7
0
0

로드 중.... (전체 텍스트 보기)

전체 글

(1)

Comparison of Multiple Chronic Obstructive Pulmonary Disease (COPD) Indices in

Chinese COPD Patients

Jinsong Zhang, M.M.S.

1

, Anastasia Miller, Ph.D.

2

, Yongxia Li, Ph.D.

3

, Qinqin Lan, M.A.

2

, Ning Zhang, Ph.D., M.D., M.P.H.

4

, Yanling Chai, M.M.S.

3

and Bing Hai, M.M.S.

3

1

Department of Urology, Ward 3, The 2nd Affiliated Hospital of Kunming Medical University, Kunming, China,

2

Department of Public Affairs, University of Central Florida, Orlando, FL, USA,

3

Department of Respiratory Medicine, Ward 2, The 2nd Affiliated Hospital of Kunming Medical University, Kunming, China,

4

Department of Interprofessional Health Sciences and Health Administration, Seton Hall University, South Orange, NJ, USA

Background: Chronic obstructive pulmonary disease (COPD) is a serious chronic condition with a global impact.

Symptoms of COPD include progressive dyspnea, breathlessness, cough, and sputum production, which have a considerable impact on the lives of patients. In addition to the human cost of living with COPD and the resulting death, COPD entails a huge economic burden on the Chinese population, with patients spending up to one-third of the average family income on COPD management in some regions is clinically beneficial to adopt preventable measures via prudent COPD care utilization, monetary costs, and hospitalizations.

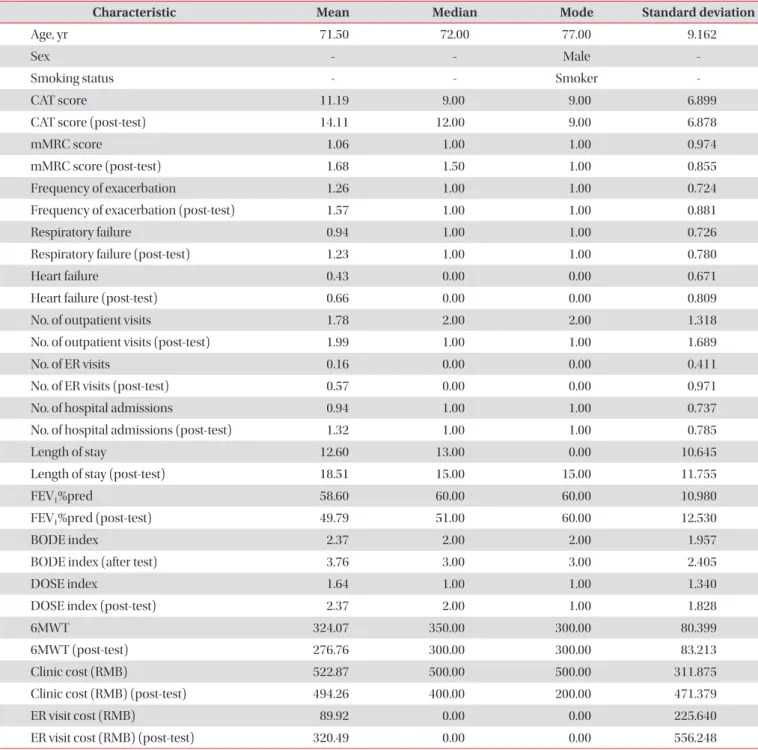
Methods: Toward this end, this study compared the relative effectiveness of six indices in predicting patient healthcare utilization, cost of care, and patient health outcome. The six assessment systems evaluated included the three multidimensional Body mass index, Obstruction, Dyspnea, Exercise capacity index, Dyspnea, Obstruction, Smoking, Exacerbation (DOSE) index, and COPD Assessment Test index, or the unidimensional measures that best predict the future of patient healthcare utilization, cost of care, and patient health outcome among Chinese COPD patients.

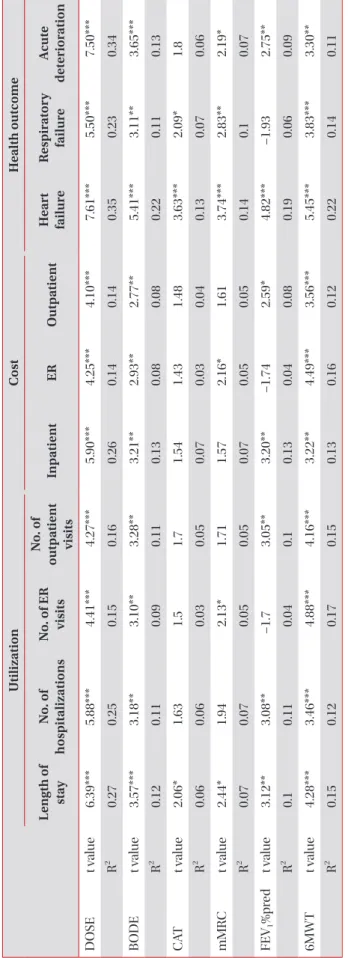
Results: Multiple linear regression models were created for each healthcare utilization, cost, and outcome including a single COPD index and the same group of demographic variables for each of the outcomes.

Conclusion: We conclude that the DOSE index facilitates the prediction of patient healthcare utilization, disease expenditure, and negative clinical outcomes. Our study indicates that the DOSE index has a potential role beyond clinical predictions.

Keywords: Pulmonary Disease, Chronic Obstructive; Pulmonary Function Tests; Health-Related Quality of Life; Costs and Cost Analyses

Address for correspondence: Bing Hai, M.M.S.

Department of Respiratory Medicine, Ward 2, The 2nd Affiliated Hospital of Kunming Medical University, 374 Dian Mian Road, Kunming, Yunnan 650101, China

Phone: 86-15559772222, Fax: 86-871-531-1542 E-mail: 1910645481@qq.com

Received: Jul. 13, 2017, Revised: Oct. 6, 2017, Accepted: Oct. 13, 2017, Published online: Mar. 7, 2018

cc

It is identical to the Creative Commons Attribution Non-Commercial License (http://creativecommons.org/licenses/by-nc/4.0/).

Copyright © 2018

The Korean Academy of Tuberculosis and Respiratory Diseases.

(2)

Introduction

Chronic obstructive pulmonary disease (COPD) is a seri- ous chronic condition which has a global impact. Symptoms of COPD include progressive dyspnea, breathlessness, cough, and sputum production, which can have a considerable im- pact on the lives of the patients experiencing it

1

. The impact of COPD on the population in China is significant, with a recent estimate placing the prevalence rate at 8.2%

2

with a mortality rate of approximately 1.6%

3

. In addition to the hu- man costs, COPD places a high economic burden on the Chinese population, with patients spending up to one-third of the average family income on COPD management costs in some regions

3

. Given morbidity and mortality that COPD can pose on people’s lives, yet the difficulty of detection in cases with mild symptoms that become rapidly worse, simple yet comprehensive prediction tools are highly useful. These could be clinically and managerially beneficial in predicting COPD care utilizations, monetary costs, and hospitalizations that are preventable.

Multiple tests have been devised for these purposes. This study compared the relative effectiveness of these six indices in predicting patient healthcare utilization, cost of care, and patient health outcome. The indices used for this study are as follows: the Body mass index, Obstruction, Dyspnea, Exercise capacity (BODE) index which was the first multidimensional assessment for COPD

4

, the Dyspnea, Obstruction, Smoking, Exacerbation (DOSE) index

5

, and the COPD Assessment Test (CAT)

6

as well as the unidimensional modified Medical Re- search Council (mMRC) Dyspnea Scale

7

, the derived forced expiratory volume in 1 second predicted (FEV

1

%pred) value

8

, and the 6-minute walk test (6MWT)

9

. The primary goal of the present study, was to identify which of the six assessment systems, the three multidimensional the BODE, DOSE, or CAT indices, or the unidimensional three measures best pre- dicts the future patient healthcare utilization, cost of care, and patient health outcome among Chinese COPD patients. The results of this study could help clinicians and hospital admin- istrators to manage this chronical disease early and efficiently and therefore avoid unnecessary adverse events and costs.

Materials and Methods

1. Sample and data collection

This longitudinal study followed participants over the course of a year. All patients who were treated inpatient or outpatient for acute exacerbation of COPD in the Department of Respiratory Medicine between December 2013 and De- cember 2014 were selected for the study. Three hundred and fifty patients who met the Global Initiative for Chronic Ob- structive Lung Disease diagnostic criteria of COPD

10

from The Second Affiliated Hospital of Kunming Medical University

were initially included in the study. The Second Affiliated Hos- pital of Kunming Medical University provided ethics approval for exempted informed consent. Exclusion criteria included those with left ventricular failure, neuropsychiatric disorders, cancer, immune deficiency, renal failure, chronic liver disease, malignant tumors, and those who opted out of the study. The presence of any these conditions excluded them form consid- eration in the study. The number of patients who remained in the study for the year was 129; meaning that 221 patients were either excluded or dropped out of the study over the year. Data were collected through medical chart review and self-admin- istered questionnaires. Information on patient outpatient and emergency room (ER) visits, costs, and inpatient stays were retrieved from electronic medical record by pulmonologists.

Between December 2013 and December 2014 the patients were also mailed self-completed questionnaires. Participants were asked questions regarding disease severity, the number of exacerbations, the results of 6MWT, the mMRC Dyspnea Scale, and the FEV

1

%pred value. Participants were followed up before and after the study period and methods such as random visit and multiple locations (home, hospital, etc.) and utilized a variety of communication means (telephone, inter- views, etc.).

2. Multidimensional measures 1) The BODE index

The BODE index is calculated using the FEV

1

%pred, the 6MWT, mMRC Dyspnea Scale, and the body mass index of the patient. The BODE index uses the sum of its components and the total score ranges from 0 to 10 points. The higher the score, the higher predicted fatality over the next 4 years.

2) The DOSE index

The DOSE index is calculated using the mMRC Dyspnea Scale, FEV

1

%pred, smoking status, and the exacerbation rate in the previous year. The DOSE index uses the sum of its com- ponents and the total score ranges from 0 to 8; the higher the score, the more severe the disease.

3) CAT index

The CAT is calculated using patient reported answers to eight 5-point Likert scale questions. The total score ranges 0–40. The CAT, in relation to physiological tests can be indica- tive of disease severity, with a higher score meaning more severe disease.

4) Healthcare utilization

The factors which were used to determine healthcare utili-

zation were the length of stay at the hospital, number of hos-

pitalizations, number of ER visits, and number of outpatient

visits. These were determined by chart review over the course

of the study.

(3)

5) Cost of disease burden

The factors which were used to determine healthcare utili- zation were the costs spent on the self-reported money spent on inpatient costs, ER costs, and outpatient costs over the course of the study.

6) Clinical outcomes

For the purpose of this study, the clinical outcomes of in- terest were reported cases of heart failure, reported cases of respiratory failure, and cases of self-reported acute deteriora- tion.

Table 1. Descriptive statistics

Characteristic Mean Median Mode Standard deviation

Age, yr 71.50 72.00 77.00 9.162

Sex - - Male -

Smoking status - - Smoker -

CAT score 11.19 9.00 9.00 6.899

CAT score (post-test) 14.11 12.00 9.00 6.878

mMRC score 1.06 1.00 1.00 0.974

mMRC score (post-test) 1.68 1.50 1.00 0.855

Frequency of exacerbation 1.26 1.00 1.00 0.724

Frequency of exacerbation (post-test) 1.57 1.00 1.00 0.881

Respiratory failure 0.94 1.00 1.00 0.726

Respiratory failure (post-test) 1.23 1.00 1.00 0.780

Heart failure 0.43 0.00 0.00 0.671

Heart failure (post-test) 0.66 0.00 0.00 0.809

No. of outpatient visits 1.78 2.00 2.00 1.318

No. of outpatient visits (post-test) 1.99 1.00 1.00 1.689

No. of ER visits 0.16 0.00 0.00 0.411

No. of ER visits (post-test) 0.57 0.00 0.00 0.971

No. of hospital admissions 0.94 1.00 1.00 0.737

No. of hospital admissions (post-test) 1.32 1.00 1.00 0.785

Length of stay 12.60 13.00 0.00 10.645

Length of stay (post-test) 18.51 15.00 15.00 11.755

FEV

1

%pred 58.60 60.00 60.00 10.980

FEV

1

%pred (post-test) 49.79 51.00 60.00 12.530

BODE index 2.37 2.00 2.00 1.957

BODE index (after test) 3.76 3.00 3.00 2.405

DOSE index 1.64 1.00 1.00 1.340

DOSE index (post-test) 2.37 2.00 1.00 1.828

6MWT 324.07 350.00 300.00 80.399

6MWT (post-test) 276.76 300.00 300.00 83.213

Clinic cost (RMB) 522.87 500.00 500.00 311.875

Clinic cost (RMB) (post-test) 494.26 400.00 200.00 471.379

ER visit cost (RMB) 89.92 0.00 0.00 225.640

ER visit cost (RMB) (post-test) 320.49 0.00 0.00 556.248

CAT: Chronic Obstructive Pulmonary Disease Assessment Test; mMRC: modified Medical Research Council; ER: emergency room;

FEV

1

%pred: forced expiratory volume in 1 second predicted; BODE: Body mass index, Obstruction, Dyspnea, Exercise capacity; DOSE: Dys-

pnea, Obstruction, Smoking, Exacerbation; 6MWT: 6-minute walk test.

(4)

Ta ble 2. Com p ar is ons of COPD s ev er ity in d ic at ors (n=129) U til iz ation C ost H ealth o ut com e L en gth of st ay N o. of h os pit al iz ations N o. of E R visits

N o. of out p atien t visits In p atien t ER Out p atien t H ear t failur e R es pir at or y failur e A cut e det er ior ation D O SE t v alue 6.39*** 5.88*** 4.41*** 4.27*** 5.90*** 4.25*** 4.10*** 7.61*** 5.50*** 7.50*** R

2

0.27 0.25 0.15 0.16 0.26 0.14 0.14 0.35 0.23 0.34 B ODE t v alue 3.57*** 3.18** 3.10** 3.28** 3.21** 2.93** 2.77** 5.41*** 3.11** 3.65*** R

2

0.12 0.11 0.09 0.11 0.13 0.08 0.08 0.22 0.11 0.13 C AT t v alue 2.06* 1.63 1.5 1.7 1.54 1.43 1.48 3.63*** 2.09* 1.8 R

2

0.06 0.06 0.03 0.05 0.07 0.03 0.04 0.13 0.07 0.06 mMR C t v alue 2.44* 1.94 2.13* 1.71 1.57 2.16* 1.61 3.74*** 2.83** 2.19* R

2

0.07 0.07 0.05 0.05 0.07 0.05 0.05 0.14 0.1 0.07 FEV

1

%pr ed t v alue 3.12** 3.08** –1.7 3.05** 3.20** –1.74 2.59* 4.82*** –1.93 2.75** R

2

0.1 0.11 0.04 0.1 0.13 0.04 0.08 0.19 0.06 0.09 6MW T t v alue 4.28*** 3.46*** 4.88*** 4.16*** 3.22** 4.49*** 3.56*** 5.45*** 3.83*** 3.30** R

2

0.15 0.12 0.17 0.15 0.13 0.16 0.12 0.22 0.14 0.11 *p<0.05, **p<0.01, ***p<0.001. C OP D: c hr onic obs tructive pulmonar y dise ase; ER : emer genc y r oom ; D OS E: Dy spne a, Obs truction, Smoking , E xacer bation; B ODE: B od y mas s index , Obs truction, Dy spne a, E x- er cise c ap acit y; C A T : C hr onic Obs tructive Pulmonar y Dise ase As ses sment T es t; mMR C : mo difie d M edic al R ese ar ch C ouncil; FEV

1

%pr ed: for ce d expir at or y volume in 1 se cond pr edict ed; 6MW T : 6-minut e w alk t es t.

(5)

Ta ble 3. Com p ar is ons of in d ict ors of COPD s ev er ity ch an ge s (n=129) U til iz ation d iffer en ce Co st d iffer en ce H ealth o ut com e d iffer en ce L en gth of st ay N o. of h os pit al iz ations N o. of E R visits

N o. of out p atien t visits In p atien t ER Out p atien t H ear t failur e R es pir at or y failur e A cut e det er ior ation D O SE t v alue 4.77*** 4.43*** 3.87*** –1.04 4.86*** 3.96*** –0.64 2.58* 2.88** 7.15*** R

2

0.17 0.16 0.34 0.03 0.18 0.8 0.02 0.08 0.1 0.32 B ODE t v alue 1.96 1.62 1.14 –0.74 1.29 1.33 –0.92 1.68 0.86 2.75** R

2

0.04 0.04 0.27 0.02 0.02 0.31 0.02 0.05 0.04 0.08 C AT t v alue 0.96 1.47 0.53 1.78 0.71 0.57 2.19* 0.71 1.6 1.28 R

2

0.04 0.06 0.02 0.04 0.07 0.02 0.05 0.03 0.06 0.04 mMR C t v alue 0.37 0.88 –0.63 0.11 0.58 –0.59 0.22 –0.26 1.12 0.14 R

2

0.04 0.05 0.02 0.01 0.07 0.02 0.02 0.03 0.05 0.03 FEV

1

%pr ed t v alue –1.37 –1.21 3.49*** –0.71 –0.55 3.54*** –1.04 –0.57 2.59* –1.73 R

2

0.05 0.06 0.11 0.02 0.07 0.11 0.03 0.03 0.09 0.06 6MW T t v alue 2.11* 2.05* –0.97 0.5 –1.52 –1.01 0.77 –1.11 –1.34 –1.93 R

2

0.04 0.05 0.27 0.02 0.03 0.3 0.02 0.03 0.05 0.05 *p<0.05, **p<0.01, ***p<0.001. C OP D: c hr onic obs tructive pulmonar y dise ase; ER : emer genc y r oom ; D OS E: Dy spne a, Obs truction, Smoking , E xacer bation; B ODE: B od y mas s index , Obs truction, Dy spne a, E x- er cise c ap acit y; C A T : C hr onic Obs tructive Pulmonar y Dise ase As ses sment T es t; mMR C : mo difie d M edic al R ese ar ch C ouncil; FEV

1

%pr ed: for ce d expir at or y volume in 1 se cond pr edict ed; 6MW T : 6-minut e w alk t es t.

(6)

3. Statistical analysis

Multiple linear regression models were run on each health- care utilization, cost and outcome where each COPD index served as the dependent variable and the same group of de- mographic variables were included for each of the respective outcomes. This means that there were six separate regressions run for each Tables 1, 2 and 3, in order to ensure that indices which were correlated with each other were not within the same analysis. In order to calculate COPD severity changes, the initial reported COPD scores of the given indices were subtracted from the final COPD scores from the same indices for a given patient. The resulting difference became the de- pendent variables for the regressions in Table 3. The relative effectiveness of prediction of COPD are evaluated based on the model fits (R

2

) and statistical significances of the indices. A better fit model demonstrated a relative higher R

2

value and a statistical significant regression coefficient of an index demon- strated a p-value less than 0.05. Both cross-sectional models and different-in-different models were conducted to examine the sensitivity of the predictions.

Results

During the study period 129 individuals remained in the study for both years, resulting in a retention rate of approxi- mately 36.85%. The descriptive statistics can be seen in Table 1. Included on Table 1 are demographic characteristics. It is worth noting that most participants were male, smokers, and ranged in age from 41 to 89, with an average age of 71.5.

As can be seen in Table 2, the BODE index as well as the DOSE index were positively associated with patient healthcare utilization, cost of disease, and negative clinical outcomes. Al- though both were positively associated, the magnitude of co- efficients associated with the DOSE index were larger. Within the construct of healthcare utilization, the coefficients, there are some sizable differences. For example, the coefficient of the length of stay at the hospital was 3.57 days for the BODE index while it was 6.39 days for DOSE index. Similar differ- ences can be seen within the construct of cost of disease, with a coefficient of 3.21 from the BODE index for the self-reported money spent on inpatient costs, contrasted to a coefficient of 5.90 for the DOSE index. All monetary values were measured in Yuans. Currently $1 US dollar is worth approximately 6 1/2 Yuan. Finally, among the Clinical outcomes, the most dras- tic difference in coefficient can be seen in the cases of self- reported acute deterioration. There were 3.65 reported cases for each increase in the BODE index while there were 7.50 re- ported acute deterioration cases for the DOSE index. The CAT index was positively associated with an increase of 2.06 days in length of stay for each point increase of the index. CAT in- crease was also positively associated 3.63 more reported heart

failures and 2.09 more reported respiratory failures. It was not significantly related to any other outcomes.

In Table 3, the comparison of the changes over time be- tween the indices was done. Within this analysis, the DOSE index remained significant with most of the outcome mea- sures. Within healthcare utilization, an increase in DOSE was associated with an increase 4.77 in the length of stay at the hospital. An increase in the DOSE index was associated with 4.43 more hospitalizations over time as well as and 3.87 more ER visits. Within cost of disease, an increase in the DOSE index saw an increase in 4.86 in inpatient costs and 3.96 in ER costs.

The DOSE index was positively in relation to the difference in clinical outcomes over the course of the study. An increase in the DOSE index was associated with 2.58 more reported heart failures, 2.88 more reported respiratory failures, and 7.15 acute deteriorations. The only significant relationship with the change in outcomes over the course of the study with the BODE index was the positive relationship with self-reported acute deterioration. It was still significant with an increase in the BODE index seeing 2.75 more acute deteriorations. Inter- estingly, the CAT index was not significantly related directly with outpatient cost, yet it became positively related with the difference in outpatient cost in Table 3. An increase in the CAT index saw an increase of 2.19 Yuan in outpatient spending.

Discussion

The primary finding of this study is that the DOSE index was the best predictors of all COPD outcomes including patient healthcare utilization, cost of the disease, and negative clini- cal outcomes out of the six indices examined. Previous stud- ies have shown that DOSE is an effective tool in predicting a range of clinical outcomes

5

, particularly compared to other indices in the United Kingdom, Sweden, and Holland

11

as well as mortality among COPD patients

12

. The DOSE index even stayed significant in most of the categories when comparing the change between the outcomes between the time periods of the study. This is the first study to demonstrate the relative predictability of DOSE index across comprehensive health outcomes among a group of Chinese patients.

This study has added to the literature positing that the DOSE index is more accurate and reliable than BODE

13

. The modified BODE has been shown to have a significant discrim- inative property

14

, indicating that in the future this should be compared directly to the DOSE index. It is also one of the first studies to compare the DOSE and the CAT. Although DOSE appears to be far more effective than CAT, it does confirm previous literature which found that CAT is a cheap and easy method to gauge certain outcomes in patients

15

. It has also contributed by providing data on the use of the DOSE index, BODE index, and CAT index in the Chinese population.

This study has several limitations. Although this study was a

(7)

longitudinal study, there was significant drop out from the par- ticipants. It is unknown is those patients were different from the participants who remained in the study. This study utilized patients who had received a diagnosis of COPD; however, it is highly likely that there are patients who had comparable COPD symptoms, yet were not included in the study because their status was not known to the researchers.

In our opinion, the DOSE index is suitable for not only to predict clinical outcomes, but also to predict hospital utiliza- tion as well as the financial burden of the disease on the pa- tient. It could be a useful instrument to researchers examining multiple aspects of COPD in the lives of patients.

We conclude that the DOSE index is useful in predicting patient healthcare utilization, cost of the disease, and negative clinical outcomes. The DOSE index was a better predictor for all three outcome categories than its individual components or than the BODE index or the CAT index. Our study indicates that the DOSE index has potential use beyond clinical predic- tions.

Conflicts of Interest

No potential conflict of interest relevant to this article was reported.

References

1. Roche N, Chavannes NH, Miravitlles M. COPD symptoms in the morning: impact, evaluation and management. Respir Res 2013;14:112.

2. Zhong N, Wang C, Yao W, Chen P, Kang J, Huang S, et al. Prev- alence of chronic obstructive pulmonary disease in China: a large, population-based survey. Am J Respir Crit Care Med 2007;176:753-60.

3. Gao J, Prasad N. Chronic obstructive pulmonary disease in China: the potential role of indacaterol. J Thorac Dis 2013;5:549-58.

4. Celli BR, Cote CG, Marin JM, Casanova C, Montes de Oca M, Mendez RA, et al. The body-mass index, airflow obstruction, dyspnea, and exercise capacity index in chronic obstructive pulmonary disease. N Engl J Med 2004;350:1005-12.

5. Jones RC, Donaldson GC, Chavannes NH, Kida K, Dickson- Spillmann M, Harding S, et al. Derivation and validation of

a composite index of severity in chronic obstructive pulmo- nary disease: the DOSE Index. Am J Respir Crit Care Med 2009;180:1189-95.

6. Jones PW, Harding G, Berry P, Wiklund I, Chen WH, Kline Leidy N. Development and first validation of the COPD As- sessment Test. Eur Respir J 2009;34:648-54.

7. Mahler DA, Wells CK. Evaluation of clinical methods for rat- ing dyspnea. Chest 1988;93:580-6.

8. Burrows B, Knudson RJ, Camilli AE, Lyle SK, Lebowitz MD.

The “horse-racing effect” and predicting decline in forced expiratory volume in one second from screening spirometry.

Am Rev Respir Dis 1987;135:788-93.

9. Bennell K, Dobson F, Hinman R. Measures of physical per- formance assessments: Self-Paced Walk Test (SPWT), Stair Climb Test (SCT), Six-Minute Walk Test (6MWT), Chair Stand Test (CST), Timed Up & Go (TUG), Sock Test, Lift and Carry Test (LCT), and Car Task. Arthritis Care Res (Hoboken) 2011;63 Suppl 11:S350-70.

10. Gloval Initiative for Chronic Obstructive Lung Disease. Glob- al strategy for the diagnosis, management and prevention of COPD 2016 [Internet]. Gloval Initiative for Chronic Obstruc- tive Lung Disease; 2016 [cited 2017 Dec 5]. Available from:

http://goldcopd.org/.

11. Jones RC, Price D, Chavannes NH, Lee AJ, Hyland ME, Stall- berg B, et al. Multi-component assessment of chronic ob- structive pulmonary disease: an evaluation of the ADO and DOSE indices and the global obstructive lung disease catego- ries in international primary care data sets. NPJ Prim Care Respir Med 2016;26:16010.

12. Sundh J, Janson C, Lisspers K, Stallberg B, Montgomery S.

The Dyspnoea, Obstruction, Smoking, Exacerbation (DOSE) index is predictive of mortality in COPD. Prim Care Respir J 2012;21:295-301.

13. Motegi T, Jones RC, Ishii T, Hattori K, Kusunoki Y, Furutate R, et al. A comparison of three multidimensional indices of COPD severity as predictors of future exacerbations. Int J Chron Obstruct Pulmon Dis 2013;8:259-71.

14. Oga T, Tsukino M, Hajiro T, Ikeda A, Nishimura K. Predictive properties of different multidimensional staging systems in patients with chronic obstructive pulmonary disease. Int J Chron Obstruct Pulmon Dis 2011;6:521-6.

15. Lee SD, Huang MS, Kang J, Lin CH, Park MJ, Oh YM, et al. The

COPD assessment test (CAT) assists prediction of COPD ex-

acerbations in high-risk patients. Respir Med 2014;108:600-8.

수치

Table 1. Descriptive statistics
Table 2. Comparisons of COPD severity indicators (n=129) UtilizationCostHealth outcome Length of  stayNo
Table 3. Comparisons of indictors of COPD severity changes (n=129) Utilization differenceCost differenceHealth outcome difference Length of  stayNo

참조

관련 문서

1) Global Initiative for Chronic Obstructive Lung Disease (GOLD). Global strategy for the diagnosis, management and prevention of COPD. Yates, B.S., Jørgen Vestbo, M.D.,

First, the results conducted eight weeks after school broadcast dance program of 19 middle school girls target body mass index were not significantly different

Weight, body fat percentage and body mass index (BMI), except only in the exercise group in comparison to the two groups after the experiment than before

Therefore, this study aims to identify the relations between gastroesophageal reflux disease and body mass index, and waist measurement as indexes of obesity.. For the

First, the rhythmic gymnastics exercise program improves the skeletal muscle mass of adult women in office workers and reduces body fat percentage,

First, when examining the differences in body composition between judo specialists and active sports participants, the BMI index and body fat mass were lower

2) In between-group comparison before and after elastic band exercise, a significant difference was found in the percentage of body fat, fat-free

A study on the relationship between body mass index and the food habits of college students. Keilins respiratory chain concept and its