The Prognostic Value of Residual Volume/Total Lung Capacity in Patients with Chronic Obstructive Pulmonary Disease
The prognostic role of resting pulmonary hyperinflation as measured by residual volume (RV)/total lung capacity (TLC) in chronic obstructive pulmonary disease (COPD) remains poorly understood. Therefore, this study aimed to identify the factors related to resting pulmonary hyperinflation in COPD and to determine whether resting pulmonary hyperinflation is a prognostic factor in COPD. In total, 353 patients with COPD in the Korean Obstructive Lung Disease cohort recruited from 16 hospitals were enrolled. Resting pulmonary hyperinflation was defined as RV/TLC ≥ 40%. Multivariate logistic regression analysis demonstrated that older age (P = 0.001), lower forced expiratory volume in 1 second (FEV1) (P < 0.001), higher St. George Respiratory Questionnaire (SGRQ) score (P = 0.019), and higher emphysema index (P = 0.010) were associated independently with resting hyperinflation. Multivariate Cox regression model that included age, gender, dyspnea scale, SGRQ, RV/TLC, and 6-min walking distance revealed that an older age (HR = 1.07, P = 0.027), a higher RV/TLC (HR = 1.04, P = 0.025), and a shorter 6-min walking distance (HR = 0.99, P < 0.001) were independent predictors of all-cause mortality. Our data showed that older age, higher emphysema index, higher SGRQ score, and lower FEV1 were associated independently with resting pulmonary hyperinflation in COPD. RV/TLC is an independent risk factor for all-cause mortality in COPD.
Keywords: COPD; Hyperinflation; Survival; Residual Volume; Total Lung Capacity Tae Rim Shin,1* Yeon-Mok Oh,2*
Joo Hun Park,3 Keu Sung Lee,3 Sunghee Oh,4 Dae Ryoung Kang,4 Seungsoo Sheen,3 Joon Beom Seo,5 Kwang Ha Yoo,6 Ji-Hyun Lee,7 Tae-Hyung Kim,8 Seong Yong Lim,9 Ho Il Yoon,10 Chin Kook Rhee,11 Kang-Hyeon Choe,12 Jae Seung Lee,2 and Sang-Do Lee2
1Division of Pulmonology, Allergy & Critical Care Medicine, Department of Internal Medicine, Hallym University Medical Center, Seoul; 2Department of Pulmonary and Critical Care Medicine and Clinical Research Center for Chronic Obstructive Airway Diseases, Asan Medical Center, University of Ulsan College of Medicine, Seoul; 3Department of Pulmonary and Critical Care Medicine, Ajou University School of Medicine, Suwon; 4Office of Biostatistics, Medical Humanities and Social Medicine, Ajou University School of Medicine, Seoul; 5Department of Radiology, Asan Medical Center, University of Ulsan College of Medicine, Seoul; 6Department of Internal Medicine, Konkuk University School of Medicine, Seoul; 7Department of Internal Medicine, CHA Bundang Medical Center, CHA University, Seongnam; 8Division of
Pulmonology, Department of Internal Medicine, Hanyang University Guri Hospital, Hanyang University College of Medicine, Guri; 9Division of Pulmonary and Critical Care Medicine, Department of Medicine, Kangbuk Samsung Hospital, Sungkyunkwan University School of Medicine, Seoul; 10Department of Internal Medicine, Seoul National University Bundang Hospital, Seoul National University College of Medicine, Seongnam;
11Department of Internal Medicine, Seoul St. Mary’s Hospital, Catholic University of Korea, Seoul;
12Division of Pulmonary and Critical Care Medicine, Department of Internal Medicine, College of Medicine, Chungbuk National University, Cheongju, Korea
* Tae Rim Shin and Yeon-Mok Oh contributed equally to this work.
Received: 27 March 2015 Accepted: 10 July 2015 Address for Correspondence:
Joo Hun Park, MD
Department of Pulmonary and Critical Care Medicine, Ajou University School of Medicine, 164 Worldcup-ro, Yeongtong-gu, Suwon 16499, Korea
Tel: +82.31-219-5116, Fax: +82.31-219-5124 E-mail: [email protected]
Funding: This study was supported by a grant from the Korea Healthcare Technology R&D Project, Ministry of Health and Welfare of Korea (A102065 & HI10C2020).
http://dx.doi.org/10.3346/jkms.2015.30.10.1459 • J Korean Med Sci 2015; 30: 1459-1465
INTRODUCTION
Pulmonary hyperinflation occurs due to the decreased elasticity of the lung parenchy- ma, increased airway resistance, and air trapping, as chronic obstructive pulmonary disease (COPD) progresses (1, 2). Many trials have shown that pulmonary hyperinfla- tion significantly impairs breathing and reducing pulmonary hyperinflation has bene- ficial effects in COPD, as shown by the recent papers that significant improvements in pulmonary function, exercise capacity, and quality of life result from lung volume re- duction surgery (3-8).
Recent reports also suggested that symptoms and exercise capacity in COPD corre- late better with variables related to pulmonary hyperinflation than with forced expira- tory volume in 1 second (FEV1), because pulmonary hyperinflation can increase the work of breathing and cause diaphragm dysfunction (2, 9, 10).
Dynamic hyperinflation has been considered a major contributor to reduced quality of life and poor exercise capacity in COPD (2, 10, 11). However, static hyperinflation, as expressed by the inspiratory capacity (IC)/total lung capacity (TLC) ratio, is reported to be an independent predictor of mortality in COPD (3). Some papers suggested that re- sidual volume (RV)/TLC is a risk factor for mortality (6, 7). Furthermore, the lung vol- umes representing resting pulmonary hyperinflation can be easily measured, in contrast to difficult measurement of dynamic hyperinflation. Thus, variables of static hyperin- flation are thought to be significant clinical markers of COPD prognosis. However, the prognostic role of RV/TLC representing resting pulmonary hyperinflation was not well explored so far. Therefore, this study was performed to identify the variables that asso- ciate with RV/TLC severity and to examine the role of RV/TLC as a COPD prognostic factor.
Respiratory Diseases
MATERIALS AND METHODS Study design
Patients
This study involved the Korean Obstructive Lung Disease (KOLD) cohort, which consists of 477 patients with COPD or asthma enrolled from pulmonary clinics in 16 hospitals throughout Ko- rea between June, 2005 and April, 2012. We followed the patients every three months on an outpatient basis for this cohort. Of these, the COPD patients whose lung volumes were measured at the time of enrollment were selected (n = 353, Fig. 1). All pa- tients fulfilled the following three criteria: post-bronchodilator ratio of FEV1 to forced vital capacity (FVC) < 0.7 after adminis- tration of 400 μg of inhaled albuterol; more than 10 pack-years of smoking history; and no or minimal abnormality on chest radiography.
Resting pulmonary hyperinflation was defined as RV/TLC ≥ 40% (12). The patients with RV/TLC < 40% served as the con- trol group. Acute exacerbation was graded from mild to severe as previously reported after follow up for 1 yr from enrollment and only moderate and severe exacerbations were included in the exacerbation group (13, 14). The patients were defined as frequent exacerbators if acute exacerbation occurred twice or more per a year (1).
Clinico-physiological indices of COPD
The demographic and clinical data, including age, sex, smoking status, history of exacerbations, etc were collected.
Body mass index (BMI) was calculated as the body weight divided by the height squared (kg/m2). Dyspnea was assessed by using the Modified Medical Research Council Dyspnea Scale.
Health-related quality of life was assessed by using the St. George Respiratory Questionnaire (SGRQ). Spirometry was performed by using the Vmax 22 (SensorMedics, Yorba Linda, CA, USA;
PFDX instrument; MedGraphics, St. Paul, MN, USA) according to American Thoracic Society guidelines (11).
Chest computed tomography (CT) indices for COPD assessment The chest CT indices used to assess COPD included the emphy- sema index, air-trapping index, and airway dimensions (15-18).
To measure these indices, all patients underwent volumetric CT scans at full inspiration and expiration with a 16-MDCT scan- ner (the CT machines came from three manufacturers, namely, the Somatom Sensation 16, Siemens Medical Solutions, Forch- heim, Germany; the GE Lightspeed Ultra, General Electric Health- care, Milwaukee, WI; and the Philips Brilliance 16, Philips Med- ical Systems, Best, Netherlands) (16). The emphysema index was determined from CT data by automatic calculation of the volume fraction of the lungs below -950 Hounsfield Units at full inspiration and the mean lung density (15). The CT air-trapping index was defined as the ratio of mean lung density on expira- tion and inspiration (17). Airway dimensions were measured near the origin of four segmental bronchi (RB1, LB1+2, RB10, LB10) by a consensus of two radiologists using in-house soft- ware. Airway dimensions, including wall area, lumen area, and wall area percent, defined as wall area/(wall area + lumen area)
× 100, were measured in each segmental bronchus (17).
Statistical analysis
SPSS version 12 (SPSS Inc., Chicago, IL, USA) was used for the analysis. All values were expressed as means ± standard devia- tion. To compare two groups, the Chi-Square test or Fisher’s ex- act test was used for categorical data and Student’s t-test was used for continuous data. The 95% confidence intervals of each variable were calculated. A P value of less than 0.05 was deemed statistically significant. Multiple logistic regression analyses to choose significant variables in the preceding analyses were per- formed. The demographic variables to indicate sample profile information such as age and sex and clinically meaningful vari- ables were included in the multiple logistic regression.
We performed cox proportional hazard regression model us- ing coxph in library (survival) R package to account for the sur- vival time value with possible censoring in the data. In the cox analysis, the pulmonary function test variables that correlated strongly with RV/TLC were excluded to avoid multicollinearity.
Ethics statement
This study was approved by the institutional review board of Asan Medical Center (Approval No. 2005-0345) and the other 15 hospitals. Written informed consent was obtained from all patients.
RESULTS
Baseline characteristics
The mean age of the participants was 66.7 ± 7.4 yr and 85.6% of the cohort were male.
Compared to the controls, the hyperinflation group were sig- Fig. 1. Flow diagram of the subjects who were enrolled in this study.
COPD or asthma n = 477
Smoking COPD
n = 380 Non smoking COPD or asthma
n = 97
RV/LC ≥ 40%
n = 242
RV/TLC < 40%
n = 111 COPD with lung volume
measurement n = 353
nificantly older (P < 0.001) and had lower BMI (P = 0.008), more severe dyspnea (P < 0.001), higher high-sensitivity C-reactive protein (hsCRP) (P = 0.015), lower serum albumin (P = 0.007) and lower serum creatinine levels (P = 0.001) (Table 1). The hy- perinflation group had significantly worse quality of life (SGRQ:
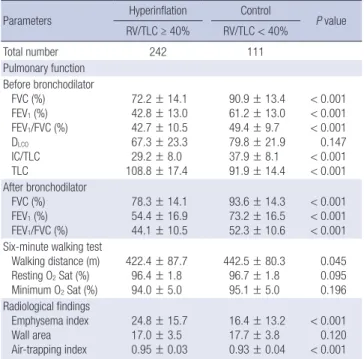
36.5 ± 17.8 vs. 27.0 ± 15.6, P < 0.001) than the controls. Pulmo- nary function was worse in the hyperinflation group, as mea- sured by FEV1, FEV1/FVC, FVC, and IC/TLC (all P values < 0.001) (Table 2). Moreover, the 6-min walking test distance was shorter in the hyperinflation group (P = 0.045) (Table 2). However, oxy- gen saturation in six-minute walk test did not show significant difference between two groups (Table 2). Radiological evalua- tions showed that emphysema index and air-trapping index were higher in the hyperinflation group (all P values < 0.001) (Table 2).
Severe COPD based on FEV1 had higher rate of hyperinflators (RV/TLC ≥ 40%) (P < 0.001) (Fig. 2) and increasing RV/TLC se- verity also associated with higher rate of frequent exacerbators (P < 0.001) (Fig. 3).
Predictors of resting pulmonary hyperinflation in COPD by logistic regression analysis
This analysis was performed to identify independent factors as- sociated with patients with resting pulmonary hyperinflation.
Multiple logistic regression analysis using the all possible risk factors in the data demonstrated that age (OR = 1.08, P = 0.001), SGRQ (OR = 1.03, P = 0.019), FEV1 (OR = 0.92, P < 0.001), and emphysema index (OR = 1.01, P = 0.010) associated indepen- dently with RV/TLC ≥ 40% (Table 3).
Survival analysis
The median follow-up period of all patients was 3.72 yr. Of the 37 patients with COPD who died during the observation peri- od, death was most frequently due to respiratory failure (5 pa- tients). Other causes were pneumonia (4 patients), acute exac- erbation of COPD (3 patients) lung cancer (3 patients), cancers other than lung cancer (3 patients), myocardial infarction (3 pa- tients), respiratory failure after surgery (2 patients), septic shock (1 patient), pneumothorax (1 patient), and suicide (1 patient).
Since the cause of death was unknown in 29.7%, only all-cause mortality was used for the survival analyses.
Table 1. Baseline characteristics of the patients with COPD depending on the pres- ence of resting pulmonary hyperinflation
Parameters Hyperinflation Control
P value RV/TLC ≥ 40% RV/TLC < 40%
Total number 242 111
Age (yr) 67.7 ± 7.0 64.7 ± 7.9 < 0.001
Gender (male) 85.1% 86.5% 0.735
Smoker (pack-years) 44.8 ± 25.2 49.5 ± 29.7 0.132
BMI (kg/m2) 22.7 ± 3.4 23.6 ± 2.7 0.008
SGRQ 36.5 ± 17.8 27.0 ± 15.6 < 0.001
mMRC 1.77 ± 1.07 1.34 ± 0.99 < 0.001
Laboratory finding WBC (× 103/μL) Hs-CRP (mg/dL) Hemoglobin (g/dL) Platelet (× 103/μL) Protein (g/dL) Albumin (g/dL) Cholesterol (mg/dL) Creatinine (mg/dL)
7.4 ± 2.1 0.47 ± 1.21 14.8 ± 1.4 242.2 ± 60.5
7.1 ± 0.5 4.22 ± 0.32 186.4 ± 36.2 1.01 ± 0.18
7.1 ± 1.9 0.25 ± 0.27 15.1 ± 1.2 238.8 ± 63.2
7.1 ± 0.5 4.31 ± 0.30 194.7 ± 35.3 1.08 ± 0.19
0.138 0.015 0.074 0.633 0.228 0.007 0.056 0.001 The continuous variables are presented as means ± standard deviation. The cate- gorical variables are presented as percentages. RV/TLC, residual volume/total lung capacity; BMI, body mass index; SGRQ, St. George Respiratory Questionnaire; mMRC, modified Medical Research Council; WBC, white blood cell count; Hs-CRP, high-sen- sitivity C-reactive protein.
Table 2. Physiological and radiological findings of the patients with COPD who were divided according to the severity of resting pulmonary hyperinflation
Parameters Hyperinflation Control
P value RV/TLC ≥ 40% RV/TLC < 40%
Total number 242 111
Pulmonary function Before bronchodilator
FVC (%) FEV1 (%) FEV1/FVC (%) DLCO
IC/TLC TLC
72.2 ± 14.1 42.8 ± 13.0 42.7 ± 10.5 67.3 ± 23.3 29.2 ± 8.0 108.8 ± 17.4
90.9 ± 13.4 61.2 ± 13.0 49.4 ± 9.7 79.8 ± 21.9 37.9 ± 8.1 91.9 ± 14.4
< 0.001
< 0.001
< 0.001 0.147
< 0.001
< 0.001 After bronchodilator
FVC (%) FEV1 (%) FEV1/FVC (%)
78.3 ± 14.1 54.4 ± 16.9 44.1 ± 10.5
93.6 ± 14.3 73.2 ± 16.5 52.3 ± 10.6
< 0.001
< 0.001
< 0.001 Six-minute walking test
Walking distance (m) Resting O2 Sat (%) Minimum O2 Sat (%)
422.4 ± 87.7 96.4 ± 1.8 94.0 ± 5.0
442.5 ± 80.3 96.7 ± 1.8 95.1 ± 5.0
0.045 0.095 0.196 Radiological findings
Emphysema index Wall area Air-trapping index
24.8 ± 15.7 17.0 ± 3.5 0.95 ± 0.03
16.4 ± 13.2 17.7 ± 3.8 0.93 ± 0.04
< 0.001 0.120
< 0.001 The continuous variables are presented as mean ± standard deviation. RV, residual volume; TLC, total lung capacity; FVC, forced vital capacity; FEV1, forced expiratory volume in 1 second; DLCO, carbon monoxide diffusion capacity; IC, inspiratory capaci- ty; O2 Sat, oxygen saturation.
Fig. 2. Rate of hyperinflators (RV/TLC ≥ 40%) according to FEV1.
Hyperinflators (%)
FEV1 (%)
≥ 80 50-79 30-49 < 30
100
75
50
25
0
P < 0.001
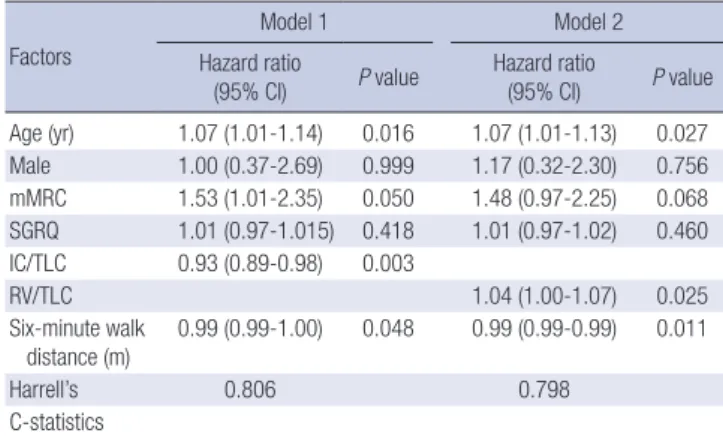
Multivariate analysis with the Cox regression model 1 that included age, gender, MRC, SGRQ, IC/TLC, and 6-min walking distance revealed that an older age [Hazard Ratio (HR) = 1.07, P = 0.016)], MRC (HR = 1.53, P = 0.05), higher IC/TLC (HR = 0.93, P = 0.003), and shorter 6-min walking distance (HR = 0.99, P = 0.048) were independent predictors of all-cause mortality (Table 4). Multivariate analysis with the Cox regression model 2 that included age, gender, MRC, SGRQ, RV/TLC, and 6-min walking distance revealed that older age (HR = 1.07, P = 0.027), higher RV/TLC (HR = 1.04, P = 0.025), and shorter 6-min walk- ing distance (HR = 0.99, P = 0.011) were independent predic- tors of all-cause mortality (Table 4).
The corresponding Harrell’s C statistics is shown as 0.809 and 0.798 for M1 and M2 survival model at the acceptable levels, re- spectively.
DISCUSSION
The present study showed that older age, higher emphysema index, lower FEV1, and poor quality of life (as shown by a higher SGRQ score) were associated independently with resting pul- monary hyperinflation in COPD. This study also demonstrated that RV/TLC was an independent risk factor for all-cause mor- tality in COPD, although longer follow up seems to be neces- sary for validation.
Pulmonary hyperinflation is frequently observed in patients with COPD. Previous studies show a strong correlation between static hyperinflation and the degree of dynamic lung hyperin- flation during exercise (19-23). Recent reports also suggested that static hyperinflation as expressed by the IC/TLC ratio is an independent predictor of exercise capacity and quality of life, and moreover, the IC/TLC ratio is an independent risk factor for mortality in the COPD cohort of Casanova et al. (3, 12, 24).
Fig. 3. Rate of frequent exacerbations according to RV/TLC. Frequency of frequent exacerbations in (A) the year before enrollment and (B) during the first year of follow-up. RV/
TLC, residual volume/total lung capacity.
Frequent exacerbators (%)
RV/TLC (%)
< 40 40-60 ≥ 60
30
20
10
0
P = 0.012
Frequent exacerbators (%)
RV/TLC (%)
< 40 40-60 ≥ 60
40
30
20
10
0
P < 0.001
A B
Table 3. Predictors of resting pulmonary hyperinflation in COPD, by multivariate lo- gistic regression analysis comparing patients with RV/TLC ≥ 40% (n = 209) to pati- ents with RV/TLC < 40% (n = 87)
Variables Odds ratio (95% CI) to
RV/TLC ≥ 40% vs. RV/TLC < 40% P value
Age (yr) 1.08 (1.03-1.13) 0.001
Male gender 1.08 (0.45-2.41) 0.846
BMI (kg/m2) 0.95 (0.85-1.06) 0.367
Dyspnea (mMRC) 1.41 (0.95-2.04) 0.083
SGRQ 1.03 (1.00-1.05) 0.019
FEV1 (%) 0.92 (0.92-0.95) 0.000
FEV1/FVC (%) 0.95 (0.90-1.00) 0.056
Emphysema index 1.01 (1.00-1.10) 0.010
Six-minute walk distance (m) 1.00 (1.00-1.01) 0.507
C-statistics 0.83 0.000
Hosmer-Lemeshow 4.89 0.769
BMI, body mass index; FEV1, forced expiratory volume in 1 second; FVC, forced vital capacity; mMRC, modified Medical Research Council; RV/TLC, residual volume/total lung volume; SGRQ, St. George Respiratory Questionnaire.
Table 4. Prognostic factors of the survival of patients with COPD, as determined by Cox regression analysis
Factors
Model 1 Model 2
Hazard ratio
(95% CI) P value Hazard ratio
(95% CI) P value Age (yr) 1.07 (1.01-1.14) 0.016 1.07 (1.01-1.13) 0.027 Male 1.00 (0.37-2.69) 0.999 1.17 (0.32-2.30) 0.756 mMRC 1.53 (1.01-2.35) 0.050 1.48 (0.97-2.25) 0.068 SGRQ 1.01 (0.97-1.015) 0.418 1.01 (0.97-1.02) 0.460 IC/TLC 0.93 (0.89-0.98) 0.003
RV/TLC 1.04 (1.00-1.07) 0.025
Six-minute walk
distance (m) 0.99 (0.99-1.00) 0.048 0.99 (0.99-0.99) 0.011
Harrell’s 0.806 0.798
C-statistics
CI, confidence interval; mMRC, modified Medical Research Council; RV, residual vol- ume; SGRQ, St. George Respiratory Questionnaire; TLC, total lung capacity.
However, a well-structured systematic analysis of RV/TLC as a prognostic factor in COPD has not been performed, to date.
Therefore, this study was performed with the RV/TLC values in the KOLD cohort.
Several noteworthy findings were obtained.
First, an older age and airflow limitation were independently associated with resting pulmonary hyperinflation in COPD. It has been assumed that because emphysema progresses with age, older age can contribute to static hyperinflation. However, no epidemiological study has yet shown how much RV/TLC worsens with aging, similar to the age-related decline in FEV1. Longitudinal follow-up with lung volume measurements is re- quired to address that question, despite our finding that older age was an independent predictor of resting pulmonary hyper- inflation.
The second important finding is that the hyperinflation group associated independently with higher SGRQ score, indicating that resting pulmonary hyperinflation linked with quality of life in COPD. Quality of life is an essential tool to monitor COPD and SGRQ is a COPD-specific questionnaire to assess health related quality of life, although it is not easily used on an outpa- tient basis because it is time-consuming (25). Though there is a report that SGRQ score is an independent marker for mortality in patients with COPD, our study did not prove it in multi-vari- ate analysis (26).
The third important finding is that RV/TLC and 6-min walk- ing distance were independent risk factors of all-cause mortali- ty in COPD. Our observation is supported by two studies which suggested that RV/TLC is a predictor of survival in COPD (6, 7).
The prospective multicenter study by Nishimura et al., reported that the COPD patients who did not survive the 5-yr observa- tion period had a higher RV/TLC than the survivors (6). How- ever, RV/TLC was not mentioned as an important predictor of mortality because survival analyses based on RV/TLC with Cox regression method were not performed in that study (6). The more recent study showed that RV/TLC was an independent predictor of all-cause mortality in COPD (7). However, only se- vere COPD was included in that study. Our study expands on these observations, because 67.7% of the present study cohort consisted of patients with mild or moderate COPD (FEV1% ≥ 50). RV/TLC still remained a significant predictor of all-cause mortality even in overall milder COPD.
It should be noted that other COPD cohorts had lower fre- quencies of patients with mild or moderate COPD. Such pati- ents comprised 44.2% of the ECLIPSE study cohort and 29.8%
of the cohort of Celli et al. (27, 28). Moreover, our cohort had milder COPD compared to the cohort of Casanova et al. (3), of which 45% had severe COPD (FEV1% 30-49) and 25% had very severe COPD (FEV1% < 30): only 27.5% and 4.8% of our cohort had severe and very severe COPD, respectively. Therefore, dif- ferent findings of our study compared to the other studies can
be attributed to the disparity between the cohorts (3, 27, 28).
However, a relative short term follow up of our study (median follow-up period = 3.72 yr) can be a limitation in interpreting our survival analysis. This means that our findings cannot be generalized until they are validated by future studies.
Our data showed that 6-min walking distance was an inde- pendent risk factor for mortality in patients with COPD, though its association with RV/TLC was not proven in the multi-variate analysis. Our finding is supported by previous reports that the 6-min walking distance is a significant prognostic marker as one of the BODE index parameters in COPD (27, 29).
We acknowledge several limitations of this study. First, the small size of the cohort is a major limitation because COPD is a heterogenous disease with many phenotypes. Therefore, future studies are required to validate our main observations. Second, since 85.5% of patients survived the observation period, a lon- ger follow-up period is needed to make the survival analysis more powerful. Third, the COPD assessment test score was not analyzed in our study because it was not obtained in the initial enrollment period. Fourth, we did not take into consideration the history of medication in our analysis, because this study was not a randomized controlled trial.
In conclusion, this study of the KOLD COPD cohort suggest- ed that an older age, higher emphysema index, higher SGRQ scores, and lower FEV1 were associated independently with rest- ing pulmonary hyperinflation measured by RV/TLC. RV/TLC is an independent risk factor for all-cause mortality in COPD, thou- gh short observation period is a limitation for interpretation.
DISCLOSURE
Oh YM has been an investigator in university-sponsored studies (Asan Institute for Life Science, University of Ulsan College of Medicine) and an industry-sponsored study (MSD Korea and AstraZeneca Korea) and has participated as a speaker at scien- tific meetings that have been organized and financed by vari- ous pharmaceutical companies (Handok, GlaxoSmithKline, AstraZeneca Korea, MSD Korea, Novartis, and Boehringer In- gelheim). Lee SD serves as a consultant for GlaxoSmithKline and has participated as a speaker at scientific meetings that have been organized and financed by various pharmaceutical com- panies (GlaxoSmithKline, AstraZeneca Korea, and Boehringer Ingelheim). Other authors have no potential conflicts of interest to disclose.
AUTHOR CONTRIBUTION
Coordinating and designing this study: Park JH. Analysis of data:
Oh S, Kang DR, Sheen S. Radiologic evaluation: Seo JB. Data collection: Oh YM, Lee KS, Park JH, Yoo KH, Lee JH, Kim TH, Lim SY, Yoon HI, Rhee CK, Yoon HK, Choe KH, Lee JS, Lee SD.
Approval of final manuscript: all authors.
ORCID
Tae Rim Shin http://orcid.org/0000-0002-9470-2454 Yeon-Mok Oh http://orcid.org/0000-0003-0116-4683 Joo Hun Park http://orcid.org/0000-0001-9971-7025 Keu Sung Lee http://orcid.org/0000-0001-9748-9225 Sunghee Oh http://orcid.org/0000-0002-0962-4691 Dae Ryoung Kang http://orcid.org/0000-0002-8792-9730 Seungsoo Sheen http://orcid.org/0000-0003-1733-5192 Joon Beom Seo http://orcid.org/ 0000-0003-0271-7884 Kwang Ha Yoo http://orcid.org/0000-0001-9969-2657 Ji-Hyun Lee http://orcid.org/0000-0002-8287-5470 Tae-Hyung Kim http://orcid.org/0000-0002-3863-7854 Seong Yong Lim http://orcid.org/0000-0001-8098-3622 Ho Il Yoon http://orcid.org/0000-0002-5306-3692 Chin Kook Rhee http://orcid.org/0000-0003-4533-7937 Kang-Hyeon Choe http://orcid.org/0000-0001-7197-6770 Jae Seung Lee http://orcid.org/0000-0003-4130-1486 Sang-Do Lee http://orcid.org/0000-0001-8189-4509 REFERENCES
1. Vestbo J, Hurd SS, Agustí AG, Jones PW, Vogelmeier C, Anzueto A, Barnes PJ, Fabbri LM, Martinez FJ, Nishimura M, et al. Global strategy for the diagnosis, management, and prevention of chronic obstructive pulmo- nary disease: GOLD executive summary. Am J Respir Crit Care Med 2013;
187: 347-65.
2. Ferguson GT. Why does the lung hyperinflate? Proc Am Thorac Soc 2006;
3: 176-9.
3. Casanova C, Cote C, de Torres JP, Aguirre-Jaime A, Marin JM, Pinto-Pla- ta V, Celli BR. Inspiratory-to-total lung capacity ratio predicts mortality in patients with chronic obstructive pulmonary disease. Am J Respir Crit Care Med 2005; 171: 591-7.
4. Martinez FJ, de Oca MM, Whyte RI, Stetz J, Gay SE, Celli BR. Lung-vol- ume reduction improves dyspnea, dynamic hyperinflation, and respira- tory muscle function. Am J Respir Crit Care Med 1997; 155: 1984-90.
5. Marchand E, Gayan-Ramirez G, De Leyn P, Decramer M. Physiological basis of improvement after lung volume reduction surgery for severe em- physema: where are we? Eur Respir J 1999; 13: 686-96.
6. Nishimura K, Izumi T, Tsukino M, Oga T. Dyspnea is a better predictor of 5-year survival than airway obstruction in patients with COPD. Chest 2002; 121: 1434-40.
7. Budweiser S, Harlacher M, Pfeifer M, Jörres RA. Co-morbidities and hy- perinflation are independent risk factors of all-cause mortality in very severe COPD. COPD 2014; 11: 388-400.
8. Slebos DJ, Klooster K, Ernst A, Herth FJ, Kerstjens HA. Bronchoscopic lung volume reduction coil treatment of patients with severe heteroge- neous emphysema. Chest 2012; 142: 574-82.
9. Lahaije AJ, van Helvoort HA, Dekhuijzen PN, Vercoulen JH, Heijdra YF.
Resting and ADL-induced dynamic hyperinflation explain physical in- activity in COPD better than FEV1. Respir Med 2013; 107: 834-40.
10. Krieger BP. Hyperinflation and intrinsic positive end-expiratory pres- sure: less room to breathe. Respiration 2009; 77: 344-50.
11. Standardization of Spirometry, 1994 Update. American Thoracic Soci- ety. Am J Respir Crit Care Med 1995; 152: 1107-36.
12. Albuquerque AL, Nery LE, Villaça DS, Machado TY, Oliveira CC, Paes AT, Neder JA. Inspiratory fraction and exercise impairment in COPD patients GOLD stages II-III. Eur Respir J 2006; 28: 939-44.
13. Wouters EF, Postma DS, Fokkens B, Hop WC, Prins J, Kuipers AF, Pas- ma HR, Hensing CA, Creutzberg EC; COSMIC (COPD and Seretide: a Multi-Center Intervention and Characterization) Study Group. With- drawal of fluticasone propionate from combined salmeterol/fluticasone treatment in patients with COPD causes immediate and sustained dis- ease deterioration: a randomised controlled trial. Thorax 2005; 60: 480-7.
14. Wedzicha JA, Seemungal TA. COPD exacerbations: defining their cause and prevention. Lancet 2007; 370: 786-96.
15. Gevenois PA, de Maertelaer V, De Vuyst P, Zanen J, Yernault JC. Com- parison of computed density and macroscopic morphometry in pulmo- nary emphysema. Am J Respir Crit Care Med 1995; 152: 653-7.
16. Wood SA, Zerhouni EA, Hoford JD, Hoffman EA, Mitzner W. Measure- ment of three-dimensional lung tree structures by using computed tomog- raphy. J Appl Physiol 1995; 79: 1687-97.
17. Lee YK, Oh YM, Lee JH, Kim EK, Lee JH, Kim N, Seo JB, Lee SD; KOLD Study Group. Quantitative assessment of emphysema, air trapping, and airway thickening on computed tomography. Lung 2008; 186: 157-65.
18. Nakano Y, Muro S, Sakai H, Hirai T, Chin K, Tsukino M, Nishimura K, Itoh H, Paré PD, Hogg JC, et al. Computed tomographic measurements of airway dimensions and emphysema in smokers. Correlation with lung function. Am J Respir Crit Care Med 2000; 162: 1102-8.
19. O’Donnell DE, Revill SM, Webb KA. Dynamic hyperinflation and exer- cise intolerance in chronic obstructive pulmonary disease. Am J Respir Crit Care Med 2001; 164: 770-7.
20. Tantucci C, Duguet A, Similowski T, Zelter M, Derenne JP, Milic-Emili J.
Effect of salbutamol on dynamic hyperinflation in chronic obstructive pulmonary disease patients. Eur Respir J 1998; 12: 799-804.
21. Marin JM, Carrizo SJ, Gascon M, Sanchez A, Gallego B, Celli BR. Inspi- ratory capacity, dynamic hyperinflation, breathlessness, and exercise per- formance during the 6-minute-walk test in chronic obstructive pulmo- nary disease. Am J Respir Crit Care Med 2001; 163: 1395-9.
22. Diaz O, Villafranca C, Ghezzo H, Borzone G, Leiva A, Milic-Emil J, Lis- boa C. Role of inspiratory capacity on exercise tolerance in COPD patients with and without tidal expiratory flow limitation at rest. Eur Respir J 2000; 16: 269-75.
23. O’Donnell DE, Webb KA. Exertional breathlessness in patients with chro- nic airflow limitation. The role of lung hyperinflation. Am Rev Respir Dis 1993; 148: 1351-7.
24. Nishimura K, Yasui M, Nishimura T, Oga T. Airflow limitation or static hyperinflation: which is more closely related to dyspnea with activities of daily living in patients with COPD? Respir Res 2011; 12: 135.
25. Global Initiative for Chronic Obstructive Lung Disease (GOLD). Global strategy for diagnosis, management, and prevention of chronic obstruc- tive pulmonary disease. Revised 2011. Available at http://www.goldcopd.
org/uploads/users/files/GOLD_Report_2011_Feb21.pdf [accessed on 15 July 2015].
26. Domingo-Salvany A, Lamarca R, Ferrer M, Garcia-Aymerich J, Alonso J, Félez M, Khalaf A, Marrades RM, Monsó E, Serra-Batlles J, et al. Health-
related quality of life and mortality in male patients with chronic obstruc- tive pulmonary disease. Am J Respir Crit Care Med 2002; 166: 680-5.
27. Celli BR, Cote CG, Marin JM, Casanova C, Montes de Oca M, Mendez RA, Pinto Plata V, Cabral HJ. The body-mass index, airflow obstruction, dyspnea, and exercise capacity index in chronic obstructive pulmonary disease. N Engl J Med 2004; 350: 1005-12.
28. Hurst JR, Vestbo J, Anzueto A, Locantore N, Müllerova H, Tal-Singer R,
Miller B, Lomas DA, Agusti A, Macnee W, et al.; Evaluation of COPD Longitudinally to Identify Predictive Surrogate Endpoints (ECLIPSE) Investigators. Susceptibility to exacerbation in chronic obstructive pul- monary disease. N Engl J Med 2010; 363: 1128-38.
29. O’Donnell DE. Hyperinflation, dyspnea, and exercise intolerance in chro- nic obstructive pulmonary disease. Proc Am Thorac Soc 2006; 3: 180-4.