Facial soft tissue thickness among skeletal malocclusions: is there a difference?
Objective: The purpose of this study was to determine the soft tissue thickness of male and female orthodontic patients with different skeletal malocclusions.
Methods: Soft tissue thickness measurements were made on lateral cephalometric radiographs of 180 healthy orthodontic patients with different skeletal malo- cclusions (Class I: 60 subjects, Class II: 60 subjects, Class III: 60 subjects). Ten measurements were analyzed. For statistical evaluation, one-way ANOVA and Kruskal-Wallis tests were performed. Least significant difference (LSD) and Dunnet T3 post hoc tests were used to determine the individual differences. Results: Soft tissue thicknesses were found to be greater for men than for women. Statistically significant differences among the skeletal groups were found in both men and women at the following sites: labrale superius, stomion, and labrale inferius. The thickness at the labrale superius and stomion points in each skeletal type was the greatest in Class III for both men and women. On the other hand, at the labrale inferius point, for both men and women, soft tissue depth was the least in Class III and the greatest in Class II. Conclusions: Soft tissue thickness differences among skeletal malocclusions were observed at the labrale superius, stomion, and labrale inferius sites for both men and women.
[Korean J Orthod 2012;42(1):23-31]
Key words: Facial profile, Soft tissue thickness, Skeletal malocclusions, Cephalo- metrics
Hasan Kamaka Mevlut Celikoglub
aDepartment of Orthodontics, Faculty of Dentistry, Kirikkale University, Kirikkale, Turkey
bDepartment of Orthodontics, Faculty of Dentistry, Karadeniz Technical University, Trabzon, Turkey pISSN 2234-7518 • eISSN 2005-372X http://dx.doi.org/10.4041/kjod.2012.42.1.23
Received May 8, 2011; Revised June 24, 2011; Accepted July 15, 2011.
Corresponding author: Mevlut Celikoglu.
Assistant Professor, Department of Orthodontics, Karadeniz Technical University, Trabzon 61080, Turkey.
Tel +90-462-377-4747 e-mail [email protected]
© 2012 The Korean Association of Orthodontists.
The authors report no commercial, proprietary, or financial interest in the products or companies described in this article.
This is an Open Access article distributed under the terms of the Creative Commons Attribution Non-Commercial License (http://creativecommons.org/licenses/by-nc/3.0) which permits unrestricted non-commercial use, distribution, and reproduction in any medium, provided the original work is properly cited.
INTRODUCTION
Evaluation of the soft tissues in patients undergoing orthodontics or corrective jaw surgery plays a crucial role in both diagnosis and treatment planning. Both hard and soft tissue norms must be considered in establishing harmonious facial aesthetics and an optimal functional occlusion.1,2
Cephalometric norms for different ethnic and racial groups have been established previously in many stu-dies. Most investigators have concluded that there are sig ni ficant dif- ferences among these groups, and many cephalometric standards have been developed for the different groups.3-7 These studies indicate that normal measurements for 1 group should not be considered nor-mal for every other race or ethnic group. Therefore, it is important to develop individual standards for each population. Different ra cial groups must be treated accor ding to their own charac- teristics.8
Previous studies have analyzed facial soft tissue thick- ness in Japanese children representing several dif ferent skeletal classes.9,10 Utsuno et al.9 reported that measur- ements differed among these various classes. Several stu dies have made similar measurements in the Turkish popu- lation.8,11,12 Basciftci et al.8 conducted a study to deter mine Holdaway soft tissue norms in Anatolian Tur kish adults and found significant differences between genders for soft tissue chin thickness and upper lip thick ness.
However, we have not found any published study making these types of measurements in patients who had also undergone orthodontic treatment. A bibliographic search in Medline using PubMed and the keywords “soft tissue thickness,” “skeletal classes,” “facial profile,” and “soft tissue profile did not produce any results. The aim of the present study, therefore, was to determine the soft tissue thickness of orthodontic patients with different skeletal malocclusions, data that will be useful in diagnosis and surgical-treatment plan-ning.
MATERIALS AND METHODS
The sample size for the groups was calculated based on a significance level of 0.05 and a power of 80% in order to detect a clinically meaningful difference of 0.70 ± 0.95 mm for the thickness of the labrale superius among the 3 skeletal groups. Power analysis showed that 30 male and 30 female patients were required in each skeletal group.
And thus the sample of this retrospective study comprised 180 randomly selected patients (mean age: 20.10 ± 2.96 years; range, 18 to 30 years) referred to our clinic. Subjects were selected according to the following criteria: Turkish with Turkish grandparents, no previous orthodontic or prosthodontic treatment, subjects with different skeletal malocclusions and with normal vertical relationship (SN-
MP angle, 32 ± 5o; mean, 33.17 ± 1.52).8,13
After obtaining parental informed consent, lateral ceph- alometric films were acquired with a 165-cm film- to- tube distance and rigid head fixation. All subjects were positioned in the cephalostat with the sagittal plane at a right angle to the path of the x-rays, the Frankfort plane parallel to the horizontal, the teeth in centric occlusion, and the lips in a relaxed position. Soft tissue and skeletal features were traced on acetate sheets using craniographic methods.14,15 Skeletal type was determined based upon the ANB angle and Wits, which indicates the positional relationship of the maxilla and mandible. The 3 skeletal types were classified as: Class I, ANB angle 1 - 5 degrees (60 subjects); Class II, ANB angle greater than 5 degrees (60 subjects); and Class III, ANB angle less than 1 degrees (60 subjects).13,16 Ethical approval was not required for this retrospective study.
An acetate sheet was placed on top of the X-ray film,
Figure 1. The measurement points used in the study: 1, gla bella (G); 2, nasion (N); 3, rhinion (Rhi); 4, subnasale (Sn); 5, labrale superius (Ls); ,6, stomion (Sto); 7, labrale inferius (Li); 8, labiomentale (Labm); 9, pogonion (Pog); and 10, gnathion (Gn). Points 1, 2, 3, 9, and 10 were perpendicular to FHP or to the bony surface. The remaining points were measured as follows: point; 4, the distance between point A and subnasale; 5, the distance between prosthion and labrale superious; 6, the shortest distance between the upper incisor and the attachment points of the upper and lower lip; 7, the distance between infradentale and the vermilion border of the lower lip; 8, the distance between point B and the deepest point of the labiomental crease. FHP, Frankfort horizontal plane.
which was mounted on a light box. Profiles of soft and bony tissue were traced by pencil. After measuring ANB and SN-MP angles to identify the skeletal class, the following anthropological landmarks were plotted: Or (the midpoint between the lowest points of the right and left orbital margins); Po (the highest point of the external, acoustic meatus); and the Frankfort Horizontal Plane (FHP, the plane intersecting Po and Or). The distance between bony and soft tissue was measured for each of the following anthropolo-gical landmarks:10 1, glabella (G); 2, nasion (N); 3, Rhinion (Rhi); 4, Subnasale (Sn); 5, Labrale superius (Ls); 6, Stomion (Sto); 7, Labrale inferius (Li); 8, Labiomentale (Labm); 9, Pogonion (Pog); and 10, Gna-thion (Gn) (Figure 1). Points 1, 2, 3, 9, and 10 were perpendicular to FHP or to the bony surface. The remaining points were measured as follows: point 4, the distance between point A and subnasale; 5, the distance between prosthion (lowest point of the alveolar bone between the left and right upper, central incisors) and labrale superious (vermilion border of the upper lip);
6, the shortest distance between the upper incisor and the attachment points of the upper and lower lip; 7, the distance between infradentale (the most anterior point of the alveolar bone between the left and right lower, central incisors) and the vermilion border of the lower lip; 8, the distance between point B and the deepest point of the labiomental crease.
All assessments were performed by one investigator in a darkened room using a radiographic illuminator to ensure contrast enhancement of tooth images. To avoid observer bias, each lateral cephalometric film was coded with a number and thus the observer was blinded to the gender and skeletal pattern of the child.
A Kolmogorov-Smirnov test was performed to test the normality of the measurements. Parametric tests were used to analyze the data showing normal distribution, and non-parametric tests were used for the data showing abnormal distribution. For each measurement in each age group, the mean, standard deviation, and mean standard error values were calculated. The comparisons among the skeletal classes were performed using one-way ANOVA and Kruskal-Wallis tests. When ANOVA and Kruskal- Wallis test results were significant, Least significant dif- ference (LSD) (for parametric data) and Dunnet T3 (for non-parametric data) tests were used to determine the individual differences. In addition to these tests, Student’s t test (for parametric data) and the Mann-Whitney U test (for non-parametric data) were used to compare the mean values of the measurements between the genders.
To determine the presence of any errors typically asso- ciated with digitizing and measurements, 30 radio- graphs were selected randomly for examination. All pro ce dures such as landmark identification, tracing, and measurement were repeated on these 30 radiographs
3 weeks after the first examination, by the same inves- tigator. A paired t test was applied to both the first set and second set of measurements, and no significant difference was found between the two sets. Intra-class correlation coefficients were performed to assess the reliability of the measurements as described by Houston,17 and the coefficients of reliability for the measurements were above 0.92. All statistical analyses were performed using the SPSS software package program (SPSS for Windows 98, version 10.0; SPSS Inc., Chicago, IL, USA). A p-value of
<0.05 was considered statistically significant.
RESULTS
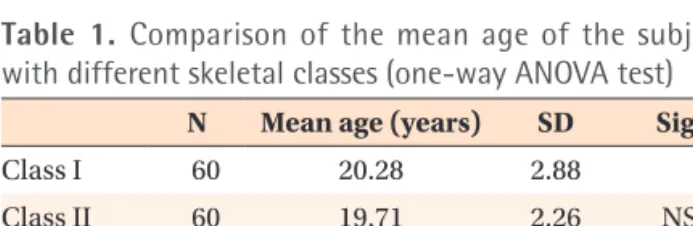
Table 1 shows the mean ages of the subjects in each skeletal class. They were 20.28 ± 2.88 years for Class I, 19.71 ± 2.26 years for Class II, and 20.31 ± 3.64 years for Class III. The combined mean age of all subjects was 20.10
± 2.96 years. One-way ANOVA showed no statistically significant difference in the distribution of the mean ages of the subjects with different skeletal classes (p > 0.05).
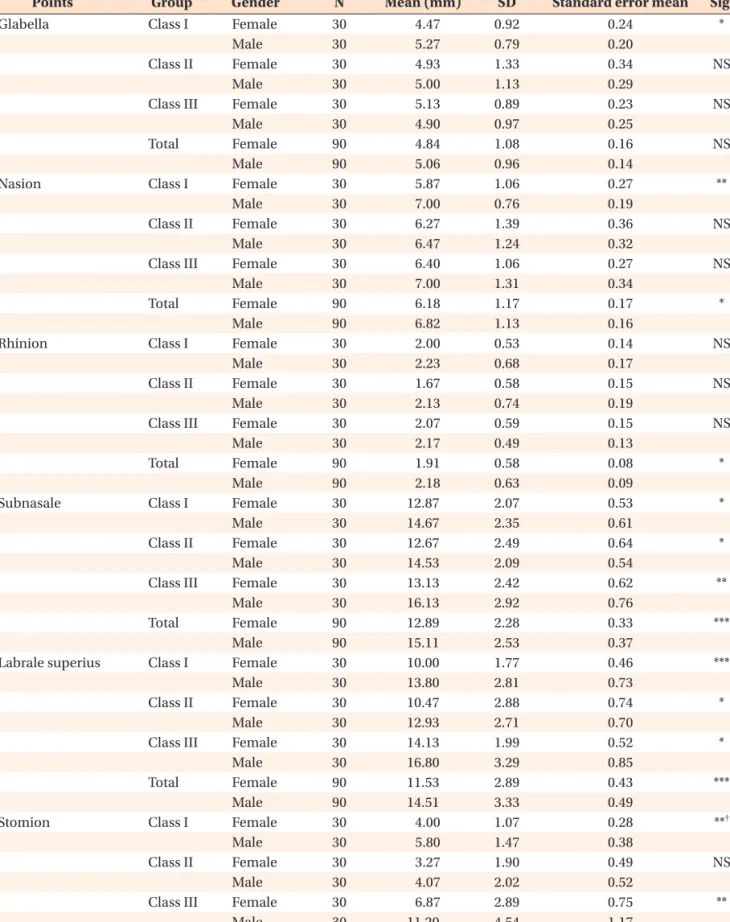
Student’s t and Mann-Whitney U tests were applied to data relating to gender in each skeletal group. When the soft tissue thickness of men and women was compared, values for men were higher in all skeletal groups (Table 2).
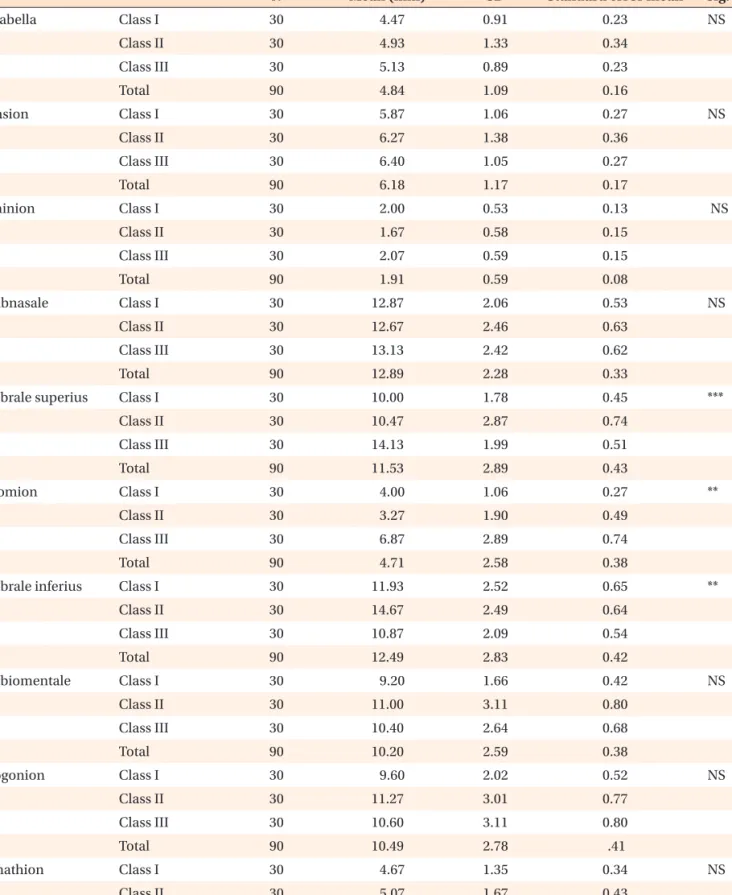
Tables 3 and 4 show the mean thickness, standard deviations, and mean standard error of each measurement point for each skeletal class for both women and men.
When ANOVA and Kruskal-Wallis tests were applied to variables relating to skeletal classes, differences were found for labrale superius, stomion, and labrale inferius sites for both men and women (p < 0.05).
Table 5 shows the differences between each skeletal class. The thickness at the labrale superius point was significantly increased in Class III compared to Class I and Class II for both males and females (p < 0.01).
Considerable difference in soft tissue thickness was ob- served at the stomion site among each skeletal type, with the lowest value in Class II, greatest in Class III, and an intermediate value in Class I for both men and women (significant differences for men between Class I and Class II, between Class I and Class III, and between Class II
Table 1. Comparison of the mean age of the subjects with different skeletal classes (one-way ANOVA test)
N Mean age (years) SD Sig.
Class I 60 20.28 2.88
Class II 60 19.71 2.26 NS
Class III 60 20.31 3.64
Total 180 20.10 2.96
SD, Standard deviation; Sig., significant; NS, not signifi cant.
Table 2. Comparison of the facial soft tissue thickness between genders in each skeletal group
Points Group Gender N Mean (mm) SD Standard error mean Sig.
Glabella Class I Female 30 4.47 0.92 0.24 *
Male 30 5.27 0.79 0.20
Class II Female 30 4.93 1.33 0.34 NS
Male 30 5.00 1.13 0.29
Class III Female 30 5.13 0.89 0.23 NS
Male 30 4.90 0.97 0.25
Total Female 90 4.84 1.08 0.16 NS
Male 90 5.06 0.96 0.14
Nasion Class I Female 30 5.87 1.06 0.27 **
Male 30 7.00 0.76 0.19
Class II Female 30 6.27 1.39 0.36 NS
Male 30 6.47 1.24 0.32
Class III Female 30 6.40 1.06 0.27 NS
Male 30 7.00 1.31 0.34
Total Female 90 6.18 1.17 0.17 *
Male 90 6.82 1.13 0.16
Rhinion Class I Female 30 2.00 0.53 0.14 NS
Male 30 2.23 0.68 0.17
Class II Female 30 1.67 0.58 0.15 NS
Male 30 2.13 0.74 0.19
Class III Female 30 2.07 0.59 0.15 NS
Male 30 2.17 0.49 0.13
Total Female 90 1.91 0.58 0.08 *
Male 90 2.18 0.63 0.09
Subnasale Class I Female 30 12.87 2.07 0.53 *
Male 30 14.67 2.35 0.61
Class II Female 30 12.67 2.49 0.64 *
Male 30 14.53 2.09 0.54
Class III Female 30 13.13 2.42 0.62 **
Male 30 16.13 2.92 0.76
Total Female 90 12.89 2.28 0.33 ***
Male 90 15.11 2.53 0.37
Labrale superius Class I Female 30 10.00 1.77 0.46 ***
Male 30 13.80 2.81 0.73
Class II Female 30 10.47 2.88 0.74 *
Male 30 12.93 2.71 0.70
Class III Female 30 14.13 1.99 0.52 *
Male 30 16.80 3.29 0.85
Total Female 90 11.53 2.89 0.43 ***
Male 90 14.51 3.33 0.49
Stomion Class I Female 30 4.00 1.07 0.28 **†
Male 30 5.80 1.47 0.38
Class II Female 30 3.27 1.90 0.49 NS
Male 30 4.07 2.02 0.52
Class III Female 30 6.87 2.89 0.75 **
Male 30 11.20 4.54 1.17
Total Female 90 4.71 2.58 0.38 **†
Male 90 7.02 4.24 0.63
and Class III; and for women, between Class I and Class III and between Class II and Class III). At point labrale inferius, the soft tissue depth was the lowest in Class III, the greatest in Class II, and intermediate in Class I for both men and women (significant differences for males between Class I and Class II, between Class I and Class III, and between Class II and Class III; and for females between Class I and Class II and between Class II and Class III).
DISCUSSION
Arnett and Gunson18 suggested that the patient should be positioned in a relaxed lip position while evaluating the soft tissue profile since this position demonstrates the relationship of soft tissues to hard tissues without muscular compensation for dentoskeletal abnormalities.
In a recently published study,19 the relaxed lip position was also used for standardization of the method, when Table 2. Continued
Points Group Gender N Mean (mm) SD Standard error mean Sig.
Labrale inferius Class I Female 30 11.93 2.52 0.65 **
Male 30 15.00 2.83 0.73
Class II Female 30 14.67 2.49 0.64 *
Male 30 16.87 1.88 0.49
Class III Female 30 10.87 2.09 0.54 *
Male 30 12.93 2.74 0.71
Total Female 90 12.49 2.83 0.42 ***
Male 90 14.93 2.95 0.43
Labiomentale Class I Female 30 9.20 1.66 0.43 *
Male 30 10.53 1.85 0.48
Class II Female 30 11.00 3.12 0.80 NS
Male 30 11.67 2.64 0.68
Class III Female 30 10.40 2.64 0.68 NS
Male 30 10.40 1.84 0.48
Total Female 90 10.20 2.59 0.38 NS
Male 90 10.87 2.14 0.32
Pogonion Class I Female 30 9.60 2.03 0.52 *
Male 30 11.40 1.99 0.51
Class II Female 30 11.27 3.01 0.78 NS
Male 30 11.00 2.78 0.72
Class III Female 30 10.60 3.11 0.80 NS
Male 30 10.33 2.89 0.75
Total Female 90 10.49 2.78 0.41 NS
Male 90 10.91 2.57 0.38
Gnathion Class I Female 30 4.67 1.35 0.35 NS
Male 30 5.67 1.05 0.27
Class II Female 30 5.07 1.67 0.43 *
Male 30 5.53 0.74 0.19
Class III Female 30 5.53 1.59 0.41 NS
Male 30 6.27 1.28 0.33
Total Female 90 5.09 1.55 0.23 *
Male 90 5.82 1.07 0.16
SD, Standard deviation; Sig., significant; NS, not significant. *p < 0.05; **p < 0.01;***p < 0.001. Analysis by Student’s t test and +Mann-Whitney U test.
Table 3. Comparison of the facial soft tissue thickness for female subjects with different skeletal classes
N Mean (mm) SD Standard error mean Sig.
Glabella Class I 30 4.47 0.91 0.23 NS
Class II 30 4.93 1.33 0.34
Class III 30 5.13 0.89 0.23
Total 90 4.84 1.09 0.16
Nasion Class I 30 5.87 1.06 0.27 NS
Class II 30 6.27 1.38 0.36
Class III 30 6.40 1.05 0.27
Total 90 6.18 1.17 0.17
Rhinion Class I 30 2.00 0.53 0.13 NS
Class II 30 1.67 0.58 0.15
Class III 30 2.07 0.59 0.15
Total 90 1.91 0.59 0.08
Subnasale Class I 30 12.87 2.06 0.53 NS
Class II 30 12.67 2.46 0.63
Class III 30 13.13 2.42 0.62
Total 90 12.89 2.28 0.33
Labrale superius Class I 30 10.00 1.78 0.45 ***
Class II 30 10.47 2.87 0.74
Class III 30 14.13 1.99 0.51
Total 90 11.53 2.89 0.43
Stomion Class I 30 4.00 1.06 0.27 **
Class II 30 3.27 1.90 0.49
Class III 30 6.87 2.89 0.74
Total 90 4.71 2.58 0.38
Labrale inferius Class I 30 11.93 2.52 0.65 **
Class II 30 14.67 2.49 0.64
Class III 30 10.87 2.09 0.54
Total 90 12.49 2.83 0.42
Labiomentale Class I 30 9.20 1.66 0.42 NS
Class II 30 11.00 3.11 0.80
Class III 30 10.40 2.64 0.68
Total 90 10.20 2.59 0.38
Pogonion Class I 30 9.60 2.02 0.52 NS
Class II 30 11.27 3.01 0.77
Class III 30 10.60 3.11 0.80
Total 90 10.49 2.78 .41
Gnathion Class I 30 4.67 1.35 0.34 NS
Class II 30 5.07 1.67 0.43
Class III 30 5.53 1.59 0.41
Total 90 5.09 1.54 0.23
SD, Standard deviation; Sig., significant; NS, not significant. *p < 0.05; **p < 0.01; ***p < 0.001. Analysis by ANOVA and +Kruskal- Wallis tests.
taking the cephalograms for accurate assessment of the soft tissues. In agreement with those studies,18,19 the relaxed lip position was used in the present study when taking the cephalograms in order to ensure accurate assessment of soft tissue thickness. Since orthodontic or prosthodontic treatment may produce changes in the soft tissue profile, patients undergoing such treatment were not included in this study.
In the present study, all soft tissue thicknesses in men were greater than those in women. However, statistically significant gender differences were not determined for
all of the points in each skeletal class. According to Uysal et al.,19 statistically significant gender differences were determined for the thickness of the labrale superius, labrale inferius, pogonion, and menton measurements.
Additionally, several studies8,20,21 evaluating the soft tissue cephalometric norms for different populations with dif- ferent mean ages showed that these parameters were more statistically significant in men than in women.
Few studies9,10 have investigated the soft tissue thickness of patients with different skeletal malocclu-sions. The published data was for women only- Japanese girls (aged Table 4. Comparison of the facial soft tissue thickness for male subjects with different skeletal classes
N Mean (mm) SD Standard error mean Sig.
Glabella Class I 30 5.27 0.79 0.21 NS
Class II 30 5.00 1.13 0.29
Total 90 5.06 0.96 0.14
Nasion Class I 30 7.00 0.75 0.19 NS
Class II 30 6.47 1.24 0.32
Total 90 6.82 1.13 0.16
Rhinion Class I 30 2.23 0.68 0.17 NS
Class II 30 2.13 0.74 0.19
Total 90 2.18 0.63 0.09
Subnasale Class I 30 14.67 2.35 0.60 NS
Class II 30 14.53 2.09 0.54
Total 90 15.11 2.53 0.38
Labrale superius Class I 30 13.80 2.81 0.72 **
Class II 30 12.93 2.71 0.70
Total 90 14.51 3.33 0.49
Stomion Class I 30 5.80 1.47 0.38 ***
Class II 30 4.07 2.01 0.52
Total 90 7.02 4.23 0.63
Labrale inferius Class I 30 15.00 2.82 0.73 **
Class II 30 16.87 1.88 0.48
Total 90 14.93 2.94 0.43
Labiomentale Class I 30 10.53 1.84 0.47 NS
Class II 30 11.67 2.63 0.68
Total 90 10.87 2.17 0.32
Pogonion Class I 30 11.40 1.99 0.51 NS
Class II 30 11.00 2.77 0.71
Total 90 10.91 2.57 0.38
Gnathion Class I 30 5.67 1.05 0.27 NS
Class II 30 5.53 0.74 0.19
Total 90 5.82 1.07 0.15
SD, Standard deviation; Sig., significant; NS, not significant. *p < 0.05; **p < 0.01; ***p < 0.001. Analysis by ANOVA and +Kruskal- Wallis tests.
6 - 16 years) and women (aged 17 - 33 years) who had different skeletal malocclu-sions. The present study aimed to compare the soft tissue thickness in both male and female orthodontic patients with different skeletal malocclusions.
The thickness at labrale superius and stomion points among each skeletal type was significantly the greatest in Class III for both males and females. On the other hand, at point labrale inferius, the soft tissue depth was the least in Class III and the greatest in Class II for both males and females. As has been shown in numerous studies, mean age of the subjects examined might also affect the soft tissue thickness. In the present study, however, mean ages of the subjects were matched among the groups and the results of the ANOVA test showed no significant differences and thus this factor might not have effects on the results. This finding might be due to the angulation of the maxillary and mandibular central incisors. As is known from the literature, the maxillary incisors are tipped labially and the mandibular incisors lingually in patients with Class III malocclusion. Mandibular anterior teeth might push the upper lip upward and outward. In contrast, the maxillary incisors are tipped lingually and mandibular incisors labially. Maxillary anterior teeth might push the lower lip downward and outward. Thus, this situation might have affected the thickness of the labrale superius, stomion, and labrale inferius points.
It is difficult to make a valuable comparison between our findings and the findings of other clinicians since a limited number of studies have been published on this subject. Utsuno et al.10 found significant differences among skeletal classes at points subnasale, labrale supe- rious, labiomentale, and pogonion. The disagreement between our findings and these authors’ findings might be due to the racial differences. A review of the literature
confirms differences in the soft tissue profile among various ethnic and racial groups.
CONCLUSION
1. The differences among different skeletal malocclu- sions may be taken into account in patients undergoing orthodontics or corrective jaw surgery, both during diagnosis and treatment planning.
2. Significant differences in soft tissue thickness among skeletal malocclusions were observed for the labrale superius, stomion, and labrale inferius sites in both men and women.
3. Soft tissue thickness at all sites was greater in men than in women.
REFERENCES
1. Arnett GW, Bergman RT. Facial keys to orthodontic diagnosis and treatment planning--Part II. Am J Orthod Dentofacial Orthop 1993;103:395-411.
2. Arnett GW, Bergman RT. Facial keys to orthodontic diagnosis and treatment planning. Part I. Am J Orthod Dentofacial Orthop 1993;103:299-312.
3. Miyajima K, McNamara JA Jr, Kimura T, Murata S, Iizuka T. Craniofacial structure of Japanese and European-American adults with normal occlusions and well-balanced faces. Am J Orthod Dentofacial Orthop 1996;110:431-8.
4. Hwang HS, Kim WS, McNamara JA Jr. Ethnic differences in the soft tissue profile of Korean and European-American adults with normal occlusions and well-balanced faces. Angle Orthod 2002;72:72-80.
5. Bacon W, Girardin P, Turlot JC. A comparison of cephalometric norms for the African Bantu and a Table 5. Results of post hoc tests (LSD and Dunnet T3) showing the differences between each skeletal classes
Class I and II Class I and III Class II and III
Male Female Male Female Male Female
Glabella NS† NS NS† NS NS† NS
Nasion NS† NS NS† NS NS† NS
Rhinion NS† NS† NS† NS† NS† NS†
Subnasale NS NS NS NS NS NS
Labrale superius NS NS ** *** ** **
Stomion *† NS† **† **† ***† **†
Labrale inferius * ** * NS *** ***
Labiomentale NS NS NS NS NS NS
Pogonion NS NS NS NS NS NS
Gnathion NS NS† NS NS† NS NS†
LSD, Least significant difference; NS, not significant. †Dunnet T3 test; *p < 0.05; **p < 0.01; ***p < 0.001.
caucasoid population. Eur J Orthod 1983;5:233-40.
6. Cooke MS, Wei SH. Cephalometric standards for the Southern Chinese. Eur J Orthod 1988;10:264-72.
7. Nanda R, Nanda RS. Cephalometric study of the den- tofacial complex of North Indians. Angle Orthod 1969;39:22-8.
8. Basciftci FA, Uysal T, Buyukerkmen A. Determination of Holdaway soft tissue norms in Anatolian Turkish adults. Am J Orthod Dentofacial Orthop 2003;123:
395-400.
9. Utsuno H, Kageyama T, Uchida K, Yoshino M, Miya- zawa H, Inoue K. Facial soft tissue thickness in Japanese children. Forensic Sci Int 2010;199:109.e1-6.
10. Utsuno H, Kageyama T, Uchida K, Yoshino M, Oohi- gashi S, Miyazawa H, et al. Pilot study of fa cial soft tissue thickness differences among three ske le tal classes in Japanese females. Forensic Sci Int 2010;195:165.e1-5.
11. Erbay EF, Caniklioglu CM. Soft tissue profile in Anato- lian Turkish adults: Part II. Comparison of different soft tissue analyses in the evaluation of beauty. Am J Orthod Dentofacial Orthop 2002;121:65-72.
12. Erbay EF, Caniklioglu CM, Erbay SK. Soft tissue profile in Anatolian Turkish adults: Part I. Evaluation of horizontal lip position using different soft tis sue analyses. Am J Orthod Dentofacial Orthop 2002;121:
57-64.
13. Gazilerli U. The Steiner norms between 13-16 years
old Turkish children with the normal occlusion on the region of Ankara (master thesis). Turkey: Ankara University, 1976.
14. Holdaway RA. A soft-tissue cephalometric analysis and its use in orthodontic treatment planning. Part I.
Am J Orthod 1983;84:1-28.
15. Holdaway RA. A soft-tissue cephalometric analysis and its use in orthodontic treatment planning. Part II.
Am J Orthod 1984; 85:279-93.
16. Celikoglu M, Kazanci F, Miloglu O, Oztek O, Kamak H, Ceylan I. Frequency and characteristics of tooth agenesis among an orthodontic patient population.
Med Oral Patol Oral Cir Bucal 2010;15:e797-801.
17. Houston WJ. The analysis of errors in orthodontic measurements. Am J Orthod 1983;83:382-90.
18. Arnett GW, Gunson MJ. Facial planning for ortho- dontists and oral surgeons. Am J Orthod Dento facial Orthop 2004;126: 290-5.
19. Uysal T, Yagci A, Basciftci FA, Sisman Y. Standards of soft tissue Arnett analysis for surgical planning in Turkish adults. Eur J Orthod 2009;31:449-56.
20. Kalha AS, Latif A, Govardhan SN. Soft-tissue cephalo- metric norms in a South Indian ethnic popu lation.
Am J Orthod Dentofacial Orthop 2008;133: 876-81.
21. Hamdan AM. Soft tissue morphology of Jordanian adolescents. Angle Orthod 2010;80:80-5.