• 검색 결과가 없습니다.

Three-dimensional symmetry and parallelism of the skeletal and soft-tissue poria in patients with facial asymmetry

N/A
N/A
Protected

Academic year: 2022

Share "Three-dimensional symmetry and parallelism of the skeletal and soft-tissue poria in patients with facial asymmetry"

Copied!
7
0
0

로드 중.... (전체 텍스트 보기)

전체 글

(1)

Three-dimensional symmetry and parallelism of the skeletal and soft-tissue poria in patients with facial asymmetry

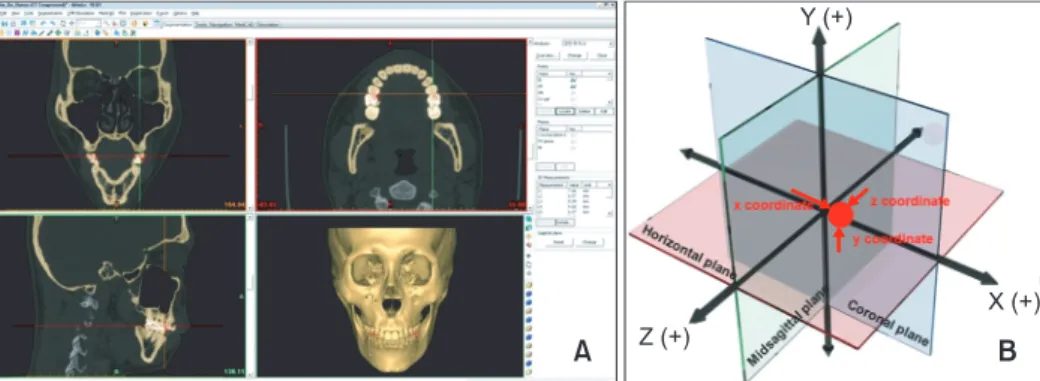
Objective: The purpose of this study was to examine the symmetry and paral- lelism of the skeletal and soft-tissue poria by three-dimensional (3D) computed tomographic (CT) imaging. Methods: The locations of the bilateral skeletal and soft-tissue poria in 29 patients with facial asymmetry (asymmetric group) and 29 patients without facial asymmetry (symmetric group) were measured in 3D reconstructed models of CT images by using a 3D coordinate system.

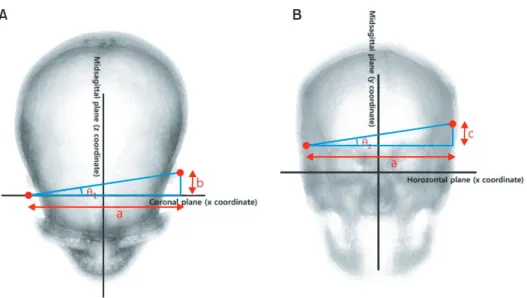
The mean intergroup differences in the anteroposterior and vertical angular deviations of the poria and their anteroposterior and vertical parallelism were statistically analyzed. Results: The symmetric and asymmetric groups showed significant anteroposterior angular differences in both the skeletal and the soft- tissue poria (p = 0.007 and 0.037, respectively; Mann-Whitney U-test). No significant differences in the anteroposterior and vertical parallelism of the poria were noted (p ≤ 0.05; Wilcoxon signed-rank test). Conclusions: In general, the skeletal poria are parallel to the soft-tissue poria. However, patients with facial asymmetry tend to have asymmetric poria.

[Korean J Orthod 2014;44(2):62-68]

Key words: Computed tomography, Soft tissue, Anatomy, Facial asymmetry, Porion, Parallelism

Min-Gun Kim Jin-Woo Lee Kyung-Suk Cha Dong-Hwa Chung Sang-Min Lee

Department of Orthodontics, School of Dentistry, Dankook University, Cheonan, Korea

Received September 10, 2012; Revised June 26, 2013; Accepted June 28, 2013.

Corresponding author: Jin-Woo Lee.

Professor, Department of Orthodontics, School of Dentistry, Dankook University, 119 Dandae-ro, Dongnam-gu, Cheonan 330-714, Korea.

Tel +82-41-550-1945 e-mail [email protected]

© 2014 The Korean Association of Orthodontists.

The authors report no commercial, proprietary, or financial interest in the products or companies described in this article.

This is an Open Access article distributed under the terms of the Creative Commons Attribution Non-Commercial License (http://creativecommons.org/licenses/by-nc/3.0) which permits unrestricted non-commercial use, distribution, and reproduction in any medium, provided the original work is properly cited.

pISSN 2234-7518 • eISSN 2005-372X

http://dx.doi.org/10.4041/kjod.2014.44.2.62

(2)

INTRODUCTION

Precise analysis and diagnosis are important for ortho- dontic treatment planning and require high-quality basal data. Lateral cephalograms provide the preliminary data for facial analysis, and facebow transfers provide other essential data for planning orthognathic surgery and fabricating interim stents. Because these records are obtained by using ear rods, the reliability of the derived data depends on the ability of the ear rods to locate the head in an appropriate position. The key structures in this process are the skeletal and soft-tissue poria.

In essence, the following three criteria should be sati sfied to obtain suitable lateral cephalograms and facebow transfers:

1. The imaginary line passing through the bilateral poria should be perpendicular to the midsagittal plane of the skull.

2. The ear rods should locate the head accurately through the soft-tissue poria.

3. The location of the head through the soft-tissue poria should be identical to that through the skele- tal poria.

With regard to the first criterion, numerous studies of the symmetry of the skeletal poria have been conducted.

According to Kim et al.,

1

the skeletal porion is the most appropriate reference point for evaluating craniofacial asymmetry. However, in a study by Katsumata et al.,

2

who used a diagrammatic chart (i.e., skeletogram) of the mean asymmetry indices of modified cephalometric landmarks and their standard deviations in normal individuals to evaluate the degree of deformity in pa- tients with facial asymmetry, the skeletal porion exhi- bited a stronger asymmetry index than the orbitale and menton in control subjects. Further, Park et al.

3

indi cated that the orbitale and porion are occasionally asym metric and should not be used as compositional points in the horizontal reference plane. Nevertheless, in cone-beam computed tomography (CBCT), in which images are obtained in the natural head position, these limitations can be overcome by setting the horizontal plane parallel to the ground.

To date, only a few studies have focused on the sym- metry of the soft-tissue poria. Kim et al.

4

studied the asymmetry of the skeletal and soft-tissue poria but con fined their analysis to the lower facial third. Ghom

5

stated that ear rods during radiography should be used unilaterally because patients with facial asymmetry have asymmetric soft-tissue poria. Because the porion is an important element of the horizontal reference plane, its features should be reviewed; further, the parallelism of the skeletal and soft-tissue poria should be examined.

The purpose of this study was to examine the sym- metry and parallelism of the skeletal and soft-tissue poria by three-dimensional (3D) computed tomographic (CT) imaging (Figure 1).

MATERIALS AND METHODS

Subjects

Fifty-eight patients at the Orthodontic Clinic of Dan- kook University Dental Hospital (Cheonan, Korea) parti- cipated in this study. They were classified into the symmetric (n = 29) and asymmetric (n = 29) groups on the basis of the extent of menton deviation (< 4 mm

= symmetric; > 4 mm = asymmetric). Patients with a history of orthodontic treatment or maxillofacial surgery, maxillofacial anomalies (e.g., cleft palate or cleft lip), or syndromic diseases affecting the craniofacial structure were excluded.

Figure 1. Parallelism of the skeletal and soft-tissue poria . A, Vertical parallelism; B, anteroposterior parallelism.

(3)

CT imaging

CT scans were performed with the subject's Frankfurt horizontal plane perpendicular to the ground and the midsagittal plane aligned with the long axis of the machine (six channel, 400 V, 50 Hz; Somatom Emotion 6; Siemens AG, Erlangen, Germany). Both the maxilla and the mandible were included in the scans. The tomographic conditions were gantry angle of 0°, voltage of 120 kV, auto mA, slice thickness of 0.625 mm, slice pitch of 3, scanning time of 4 s, and field of view of 250 mm.

Image reconstruction

The CT images were saved in Digital Imaging and Com munication in Medicine (DICOM) format and trans- ferred to a personal computer for reconstruction by using a 3D imaging program (Mimics 10.01; Materialise, Leuven, Belgium). The Mimics program reads transverse images and produces longitudinal and frontal images

for 3D modeling. The Hounsfield unit (HU), which expres ses the gray scale in CT, was adjusted to 443 HU to represent the maxillary tuberosity with the lowest density. Volume rendering was performed by creating a surface using continuous triangular units for each pixel.

The image quality in the program was adjusted to be optimal (Figure 2A).

Measurements

Table 1 lists the reference points and planes in the 3D reconstructed models.

The 3D coordinate system

The 3D coordinate system was created by using Mimics 10.01. The intersection of the three reference planes was the starting point (0, 0, 0). The distances from a selected point to the midsagittal, horizontal, and coronal planes represented the x-coordinate, y-coordinate, and z-coordinate of that point, respectively (Figure 2B). The

Figure 2. The three-dimensional (3D) reconstructed model. A, 3D reconstruction of computed tomographic images; B, 3D coordinate system.

Table 1. Description of the landmarks and reference planes

Variable Definition

Landmark

Sella The midpoint of the pituitary fossa of sphenoid bone

Nasion The point of contact between frontal bone and suture between 2 halves of nasal bones Basion The midpoint on the anterior margin of the foramen magnum

Skeletal porion (right, left) Highest midpoint on roof of skeletal external auditory meatus (right and left) Soft tissue porion (right, left) Highest midpoint on roof of soft tissue external auditory meatus (right and left) Orbitale (left) Lowest point on infraorbital margin of left orbit

Menton The midpoint of the inferior border of mental protuberance Reference plane

Midsagittal reference plane The plane passing basion, nasion and sella

Horizontal plane The plane perpendicular to midsagittal plane passing right porion and left orbitale

Coronal plane The plane perpendicular to midsagittal plane and horizontal plane passing sella

(4)

coordinates of the bilateral skeletal and soft-tissue poria in each subject were determined by using this system.

Angular deviation

The anteroposterior ( θ

1

) and vertical ( θ

2

) differences in the bilateral skeletal and soft-tissue poria were calcu- lated by determining the angles between the relevant reference planes and the lines passing through the left and right poria. The coordinate system of the coronal and midsagittal planes was used to calculate the θ

1

value and lengths of a and b (Figure 3A) and that of the horizontal and midsagittal planes was used to calculate the θ

2

value and lengths of a and c (Figure 3B). θ

sk

and θ

sof

represent the angular deviations of the skeletal and soft-tissue poria, respectively. The calculations yielded negative values for b and c. Because this study focused on the amount of difference rather than the relative position, the absolute values of b and c were used.

Statistical analyses

SPSS software 12.0 (SPSS Inc., Chicago, IL, USA) was used for statistical analyses. In the normality tests, only θ

sk1

exhibited a normal distribution. Therefore, the Wilcoxon signed-rank test was performed to analyze the anteroposterior parallelism of the poria on the basis of the significance of θ

sk1

and θ

sof1

and the vertical paral- lelism on the basis of the significance of θ

sk2

and θ

sof2

. The Mann–Whitney U-test was performed to determine the significance of the intergroup differences in the angular deviations. Significant variations among the angular measurements were evaluated by using receiver operating characteristic (ROC) curves to determine the

cutoff values for discriminating the groups.

To evaluate the reliability of the measurements, five random samples were chosen and remeasured one week later. Dahlberg's formula was used to evaluate method error, as follows:

Method error = .

d: difference between the first and the second measure.

n: sample size which was re-measured.

RESULTS

Both the groups had 17 male and 12 female subjects.

Figure 3. Measurement of the angular deviations. A, Anteroposterior deviation ( θ

1

); B, vertical deviation (θ

2

).

a, l x coordinate of left porion - x coordinate of right porion l; b, l z coordinate of left porion - z coordinate of right porion l; c, l y coordinate of left porion - y coordinate of right porion l.

Table 2. Comparison of the angular deviations of the skeletal and soft-tissue poria between the asymmetric and the symmetric groups and parallelism of the poria within the groups

Variable (

o

) Asymmetry

group (n = 31) Symmetry

group (n = 31) p-value θ

sk1

1.527 ± 1.045 0.875 ± 0.716 0.007*

θ

sof1

1.312 ± 0.974 0.799 ± 0.533 0.037*

p-value 0.088 0.389

θ

sk2

0.974 ± 1.157 0.613 ± 0.583 0.335 θ

sof2

0.994 ± 1.066 0.552 ± 0.498 0.095

p-value 0.938 0.389

Values are presented as mean ± standard deviation or p- value only.

*p ≤ 0.05 is significant (Wilcoxon signed-rank test, Mann-

Whitney U-test.).

(5)

The mean ages of the patients in the symmetric and asymmetric groups were 22.51 ± 5.03 and 23.42 ± 2.64 years, respectively. The groups showed a significant difference in the mean menton deviation (1.57 ± 1.11 mm vs. 10.14 ± 4.13 mm; p = 0.000 by the independent t-test).

The paired t-test revealed no systemic error in the measurements. The minimum and maximum me thod error values of the reference points in the 3D reconstructed models were 0.23 and 0.33 mm, respectively.

The Mann-Whitney U-test demonstrated significant dif ferences in the values of θ

sk1

and θ

sof1

between the groups (Table 2). However, the Wilcoxon signed-rank test revealed no significant differences in anteroposterior and vertical parallelism of the poria in both the groups.

The ROC curves of θ

sk1

and θ

sof1

are presented in Figure 4.

DISCUSSION

The present study focused on collecting reliable data for the preliminary diagnostic stage of orthognathic surgery. Patients were divided into the symmetric and asymmetric groups to investigate the average deviation of the bilateral poria in the hard and soft tissues. Fur- ther more, the parallelism of these structures was exa- mined.

The symmetric and asymmetric groups were classified on the basis of a cutoff menton deviation of 4 mm and the statistical difference in the group means was vali- dated by using the independent t-test (p = 0.000). Facial asymmetry is best predicted by the menton deviation.

6,7

According to Kim et al.,

8

the smallest menton deviation that can identify facial asymmetry is 3 mm, and a deviation greater than 4 mm is clearly discernable. The published research on facial asymmetry has set the

standard for menton deviation at 4 - 5 mm.

A 3D coordinate system is essential for studying sym- metry and parallelism in 3D reconstructed models. Pre- vious studies used different coordinate systems and the standard plane first selected by the researcher deter- mined the remaining reference planes. In some studies, the horizontal plane was established as the standard plane and the midsagittal and coronal planes were used as the other planes.

9,10

Studies in which the midsagittal plane was used as the standard plane and the horizon- tal and coronal planes followed have also been con- ducted.

2,11

When the horizontal plane is determined first, it is set by using the bilateral poria and the left orbitale or nasion. However, because the present study investigated the symmetry and parallelism of the poria, this method was not suitable. Therefore, the midsagittal plane was established first, by using the basion, nasion, and sella as in the Cho and Moon

12

study. Structures closer to the cranial base are more symmetric and stable in size; therefore, they can be used as points to compose a standard plane.

2,13,14

Furthermore, the use of three points to determine the midsagittal plane seems to be a reliable method.

As shown on Table 2, the mean values of the antero

-

posterior ( θ

1

) and vertical ( θ

2

) angular deviations were higher in the asymmetric group than in the symmetric group, although the difference was only 0.5

o

- 1.5

o

. Therefore, patients with facial asymmetry tend to show greater positional deviations of the skeletal and soft- tissue poria. Furthermore, for both the hard and the soft tissues, the average anteroposterior deviation is greater than the average vertical deviation regardless of facial asymmetry.

In the 3D reconstructed models, the average distance between the bilateral hard-tissue poria was 110 mm;

therefore, a 1

o

angular difference equates to a linear deviation of approximately 2 mm in the hard tissue (Figure 5A). Moreover, the average distance between the bilateral soft-tissue poria was 135 mm, indicating that a 1

o

angular difference converts to a 2.5-mm deviation in the soft tissue (Figure 5B). The angular differences in the skeletal and soft-tissue poria were only 0.652

o

Figure 4. Receiver operating characteristic (ROC) curves

of θ

sk1

and θ

sof1

. a, cutoff section of θ

sk1

; b, cutoff section of θ

sof1

.

Figure 5. Conversion of angular deviation into linear

deviation. A, For the skeletal poria; B, for the soft-tissue

poria.

(6)

and 0.513

o

, respectively, between the asymmetric and the symmetric groups. Therefore, the respective linear differences were only 1.28 and 1.27 mm, which can be considered clinically negligible. However, the asym- metric group exhibited an average anteroposterior an- gular deviation of 1.5

o

in the hard tissue, indicating an anteroposterior linear deviation of 3 mm, which is not clinically negligible. The average anteroposterior angular deviation of the soft tissue in this group was 1.312

o

; therefore, the anteroposterior linear deviation was 3.25 mm. This deviation appears more remarkable in a cephalogram with 110% enlargement. These results are in accordance with the results of Kim et al.

1

In their study, the average angle between the hard-tissue

“external acoustic meatus” and the facial axis (foramen caecum-subspinale) was 88.28

o

in the symmetric group and 87.89

o

in the asymmetric group. Although the difference is more than 2

o

, the angle is close to 90

o

and should be a suitable reference. This difference in interpretation was also found in the current study, which has similar results. There are numerous studies that have used various methods to calculate the asymmetry of the poria. Katsumata et al.

2

and Maeda et al.

15

used a left and right asymmetry index for their symmetric and asymmetric groups in order to create a diagrammatic chart (i.e., a skeletogram); according to their study, the hard tissue porion exhibited a larger asymmetry index value than the orbitale and menton in the symmetric group. According to Park et al.,

3

the orbitale and porion are sometimes asymmetric and should not be used as com positional points in the horizontal reference plane.

Furthermore, in CBCTs which are obtained using the natural head position, regardless of the asymmetry of poria and orbitale, these limitations can be overcome by setting the horizontal plane as that which is parallel to the ground.

Only the anteroposterior angular differences (θ

sk1

and θ

sof1

) of the skeletal and soft-tissue poria were sig ni- ficant, with the asymmetric group exhibiting grea ter angular deviations. The cutoff values that antero post- eriorly discriminate an asymmetric porion from a sym- metric porion can be inferred from the ROC curves in Figure 4. An ROC curve plots the relationship between the false positive rate (specificity) and the true positive rate (sensitivity) for different cutoff points. The more toward the upper left side that the curve is located and the closer to the reference line, the more accurately does it discriminate the cutoff value. The area between the curve and the reference line indicates accuracy. A value of 1 indicates perfect accuracy and that of 0.5 indi cates inaccuracy and unsuitability for use. In this study, the area of θ

sk1

was 0.70 and that of θ

sof1

was 0.66. Therefore, the cutoff value must be determined with high sensitivity and low specificity, if possible. In

Figure 4, the appropriate sections are “a” and “b.” The angular values corresponding to these areas are 0.7

o

- 0.8

o

. Therefore, the cutoff value of both θ

sk1

and θ

sof1

for anteroposteriorly discriminating symmetric and asymmetric poria is in the 0.7

o

- 0.8

o

range (1.34 - 1.53 mm in the skeletal poria and 1.65 - 1.89 mm in the soft-tissue poria).

According to these results, patients with facial asym- metry can exhibit an average linear deviation of 3 mm in the skeletal or soft-tissue poria. In patients with a menton deviation greater than 4 mm, the deviation of the soft-tissue poria should be corrected by moving the ear rods anteroposteriorly on the articulator. In general, as CT scans are obtained before surgery, this alignment process does not require additional CT imaging. Further- more, when obtaining a lateral cephalogram, only one ear rod should be used.

Mandibular symmetry and the porion position seem to be associated. Some studies have explained this asso- ciation through plagiocephaly. Unilateral flat te ning of the posterior head causes rotation of the cra nial base,

16-19

which can affect not only the anteroposterior location of the auricle but also mandi bular symmetry.

20,21

However, other studies have indicated that mandibular asymmetry is independent of cranial asymmetry and is less correlated with cranial deformation. Therefore, mandibular asymmetry may not be a result of the anterior transition of the auricle.

The published literature includes one comparative study of the skeletal and soft-tissue poria.

4

However, this study was undertaken two-dimensionally and focused on menton deviation rather than the porion position.

In the present study, in both the symmetric and the asymmetric groups, the skeletal poria were parallel to the soft-tissue poria. Regardless of whether the skeletal poria are asymmetric or not, the soft-tissue poria are aligned with them.

CONCLUSION

The key conclusions that can be drawn from this study are as follows:

1. Patients with facial asymmetry show greater antero- posterior deviations of the skeletal and soft-tissue poria than those without facial asymmetry.

2. The skeletal poria are parallel to the soft-tissue poria regardless of facial asymmetry.

3. In patients with facial asymmetry, the average porion deviation is 3 mm; this should be corrected during facebow transfer.

4. Only one ear rod should be used when obtaining la-

teral cephalograms.

(7)

REFERENCES

1. Kim YH, Sato K, Mitani H, Shimizu Y, Kikuchi M.

Asym metry of the sphenoid bone and its suitability as a reference for analyzing craniofacial asymmetry.

Am J Orthod Dentofacial Orthop 2003;124:656-62.

2. Katsumata A, Fujishita M, Maeda M, Ariji Y, Ariji E, Langlais RP. 3D-CT evaluation of facial asymmetry.

Oral Surg Oral Med Oral Pathol Oral Radiol Endod 2005;99:212-20.

3. Park SH, Yu HS, Kim KD, Lee KJ, Baik HS. A proposal for a new analysis of craniofacial morphology by 3- dimensional computed tomography. Am J Orthod Dento facial Orthop 2006;129:600. e23-34.

4. Kim WS, Lee KH, Hwang HS. Comparison of asymmetric degree between maxillofacial hard and soft tissue in facial asymmetric subjects using three-dimensional computed tomography. Korean J Orthod 2005;35:163-73.

5. Ghom AG. Textbook of oral radiology. Noida, In- dia: Elsevier (A Division of Reed Elsevier India Pvt.

Limited); 2008.

6. Ahn JS, Hwang HS. Relationship between percep- tion of facial asymmetry and posteroanterior cepha- lometric measurements. Korean J Orthod 2001;31:

489-98.

7. Lee MS, Chung DH, Lee JW, Cha KS. Assessing soft-tissue characteristics of facial asymmetry with photographs. Am J Orthod Dentofacial Orthop 2010;

138:23-31.

8. Kim KS, Kim YJ, Lee KH, Kim YH, Kook YA. Level of perception of changed lip protrusion and asymmetry of the lower facial height. Korean J Orthod 2006;36:

434-41.

9. Kwon TG, Park HS, Ryoo HM, Lee SH. A comparison of craniofacial morphology in patients with and with out facial asymmetry--a three-dimensional ana- lysis with computed tomography. Int J Oral Maxil- lofac Surg 2006;35:43-8.

10. Yoo SK, Kim YO, Kim HJ, Kim NH, Jang YB, Kim KD, et al. Alignment of CT images of skull dys- morphology using anatomy-based perpendicular axes. Phys Med Biol 2003;48:2681-95.

11. Kitaura H, Yonetsu K, Kitamori H, Kobayashi K, Nakamura T. Standardization of 3-D CT measure- ments for length and angles by matrix transfor- mation in the 3-D coordinate system. Cleft Palate Craniofac J 2000;37:349-56.

12. Cho JH, Moon JY. Comparison of midsagittal refe- rence plane in PA cephalogram and 3D CT. Korean J Orthod 2010;40:6-15.

13. Grayson BH, McCarthy JG, Bookstein F. Analysis of craniofacial asymmetry by multiplane cephalometry.

Am J Orthod 1983;84:217-24.

14. Peck S, Peck L, Kataja M. Skeletal asymmetry in esthetically pleasing faces. Angle Orthod 1991;61:

43-8.

15. Maeda M, Katsumata A, Ariji Y, Muramatsu A, Yo- shida K, Goto S, et al. 3D-CT evaluation of facial asymmetry in patients with maxillofacial deformities.

Oral Surg Oral Med Oral Pathol Oral Radiol Endod 2006;102:382-90.

16. Captier G, Leboucq N, Bigorre M, Canovas F, Bonnel F, Bonnafé A, et al. Plagiocephaly: morphometry of skull base asymmetry. Surg Radiol Anat 2003;

25:226-33.

17. Huang MH, Gruss JS, Clarren SK, Mouradian WE, Cunningham ML, Roberts TS, et al. The differential diagnosis of posterior plagiocephaly: true lambdoid synostosis versus positional molding. Plast Reconstr Surg 1996;98:765-74; discussion 775-6.

18. Lo LJ, Marsh JL, Pilgram TK, Vannier MW. Plagio- cephaly: differential diagnosis based on endo cranial morphology. Plast Reconstr Surg 1996;97:282-91.

19. Mulliken JB, Vander Woude DL, Hansen M, LaBrie RA, Scott RM. Analysis of posterior plagiocephaly:

deformational versus synostotic. Plast Reconstr Surg 1999;103:371-80.

20. Kane AA, Lo LJ, Vannier MW, Marsh JL. Mandibular dysmorphology in unicoronal synostosis and plagio- cephaly without synostosis. Cleft Palate Craniofac J 1996;33:418-23.

21. St John D, Mulliken JB, Kaban LB, Padwa BL.

Anthro pometric analysis of mandibular asymmetry in infants with deformational posterior plagiocephaly.

J Oral Maxillofac Surg 2002;60:873-7.

수치

Figure 1. Parallelism of the skeletal and soft-tissue poria . A, Vertical parallelism; B, anteroposterior parallelism
Figure 2. The three-dimensional (3D) reconstructed model. A, 3D reconstruction of computed tomographic images; B,  3D coordinate system.
Figure 3. Measurement of the angular deviations. A, Anteroposterior deviation ( θ 1 ); B, vertical deviation (θ 2 )
Figure  5. Conversion of angular deviation into linear  deviation. A, For the skeletal poria; B, for the soft-tissue  poria

참조

관련 문서